 plumi
Graphs, calculations and significant figures: Edexcel International A Level Chemistry questions
Edexcel International A Level Chemistry past-paper questions on P.1.3 Graphs, calculations and significant figures, 2019–2025, with mark schemes and examiner’s reports where available.
Paper
All papers
Exam
All years
Calculations
Q2(c)(i)
The whole paper ↗
Q3(d)(i)
The whole paper ↗
Q17(b)(ii)
The whole paper ↗
Q2(c)
The whole paper ↗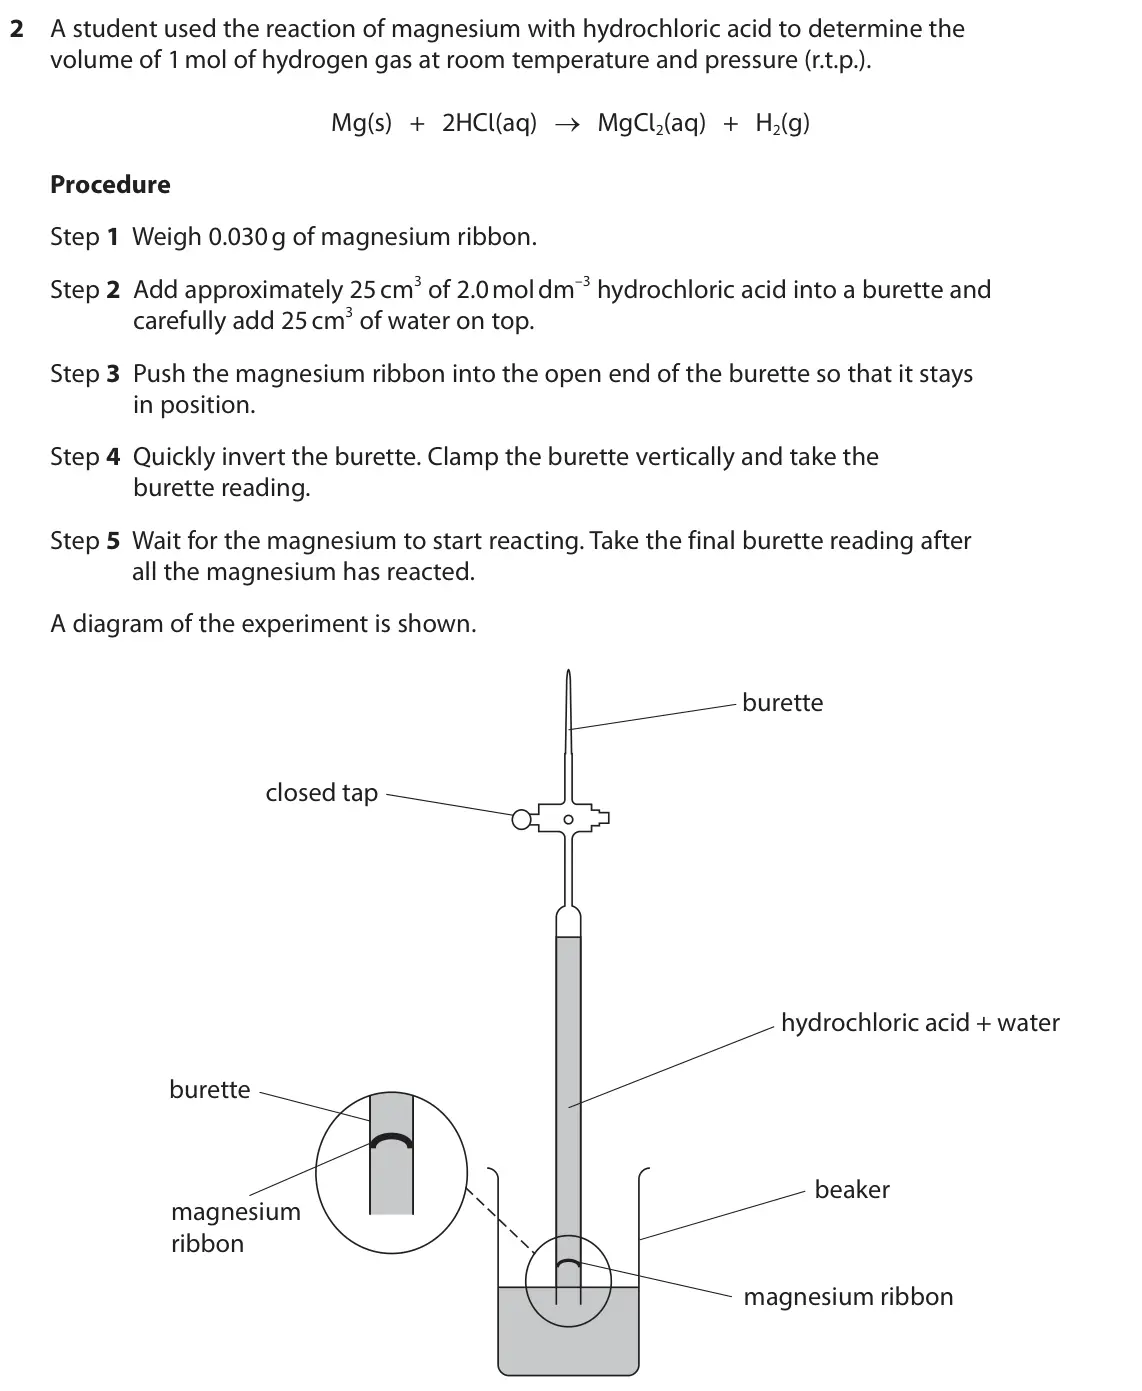
Q4(a)(ii)
The whole paper ↗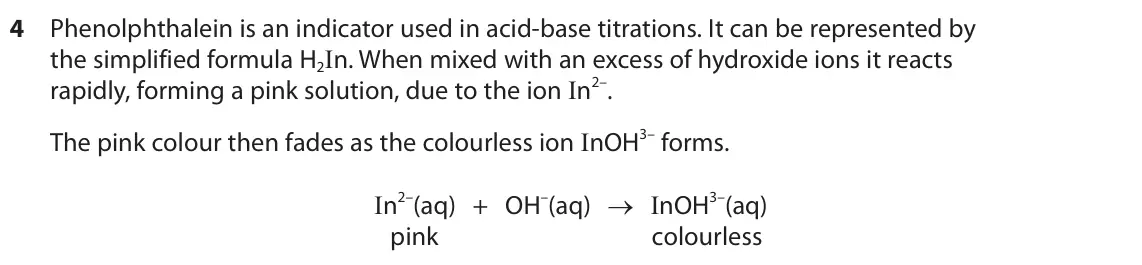
Q17(a)(i)
The whole paper ↗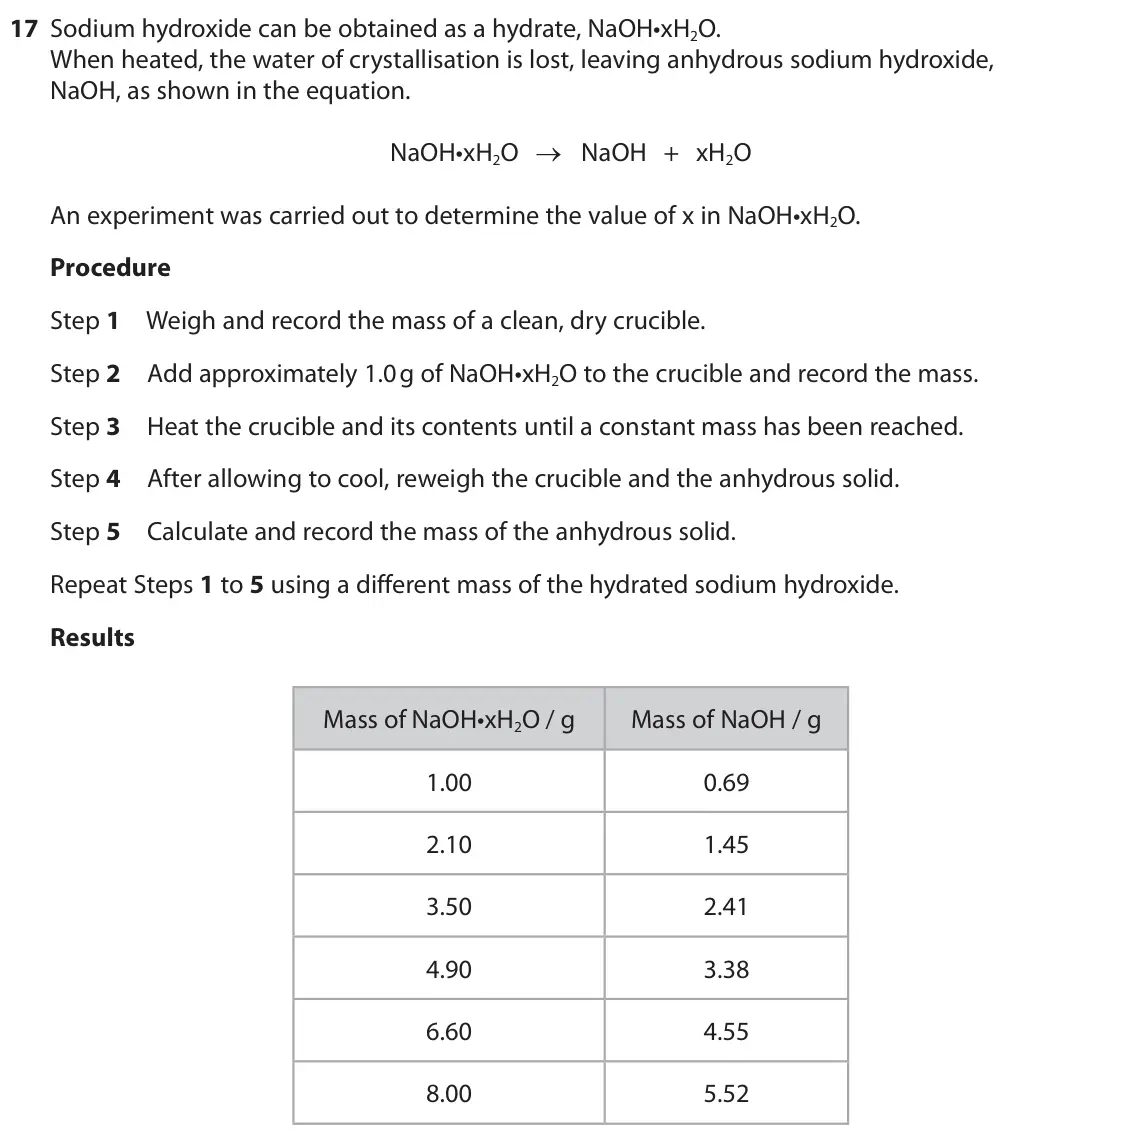
Q2(a)(i)
The whole paper ↗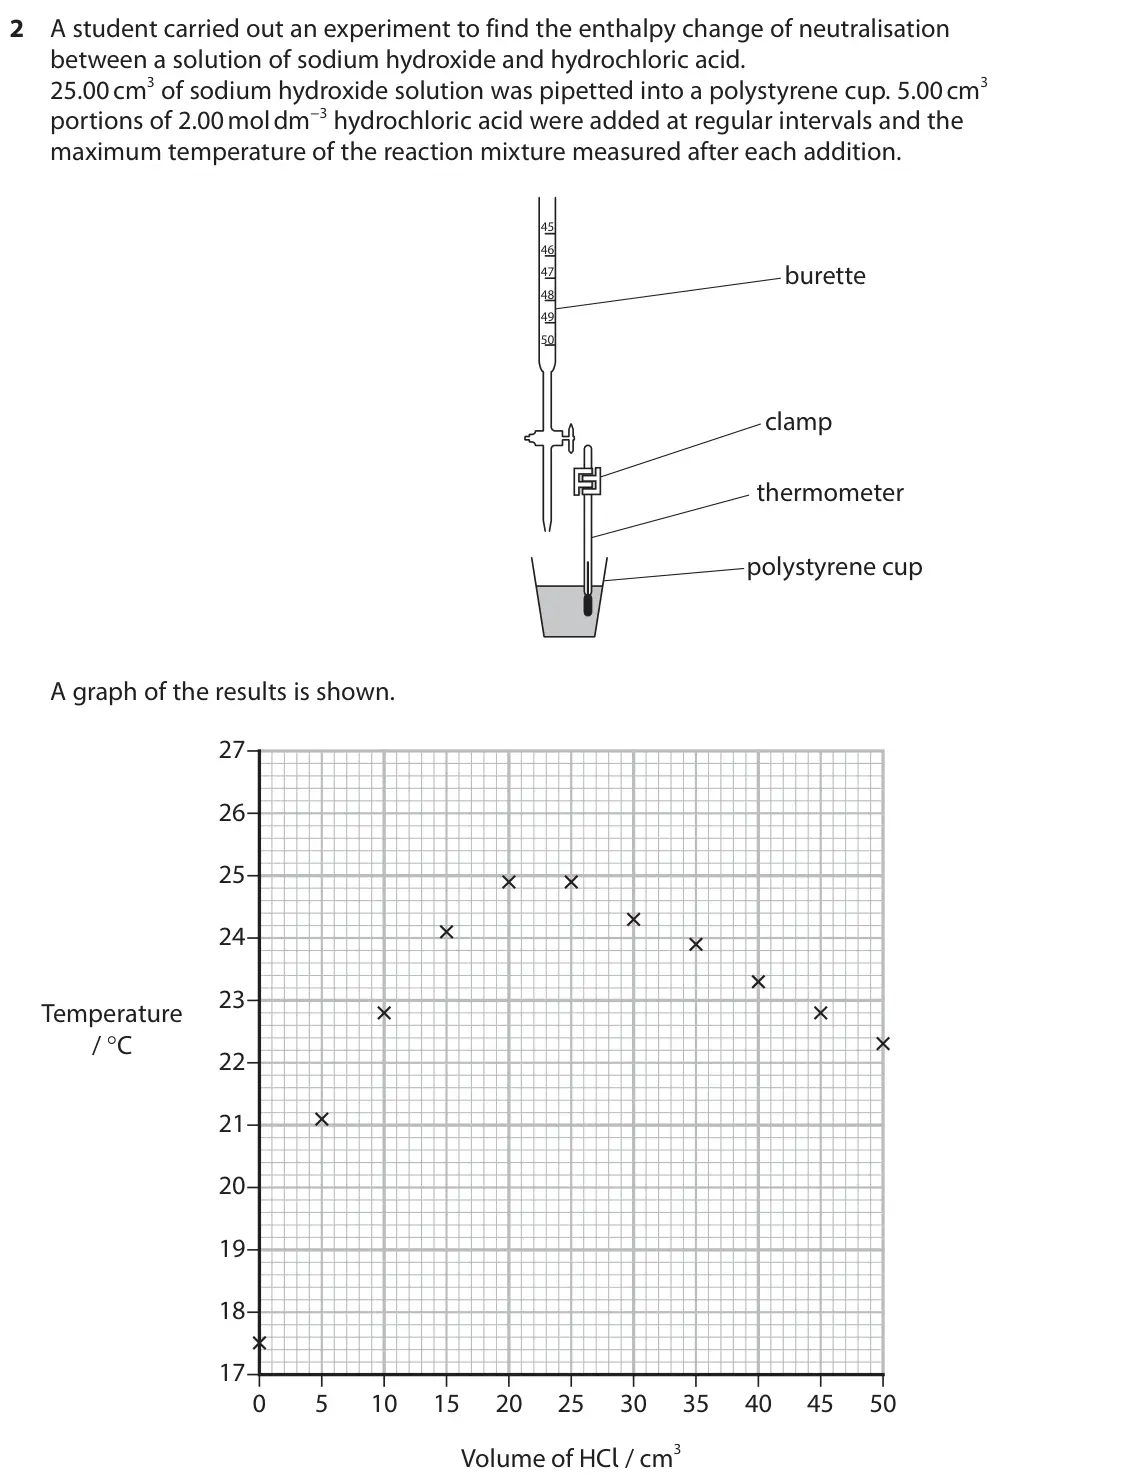
Q4(a)
The whole paper ↗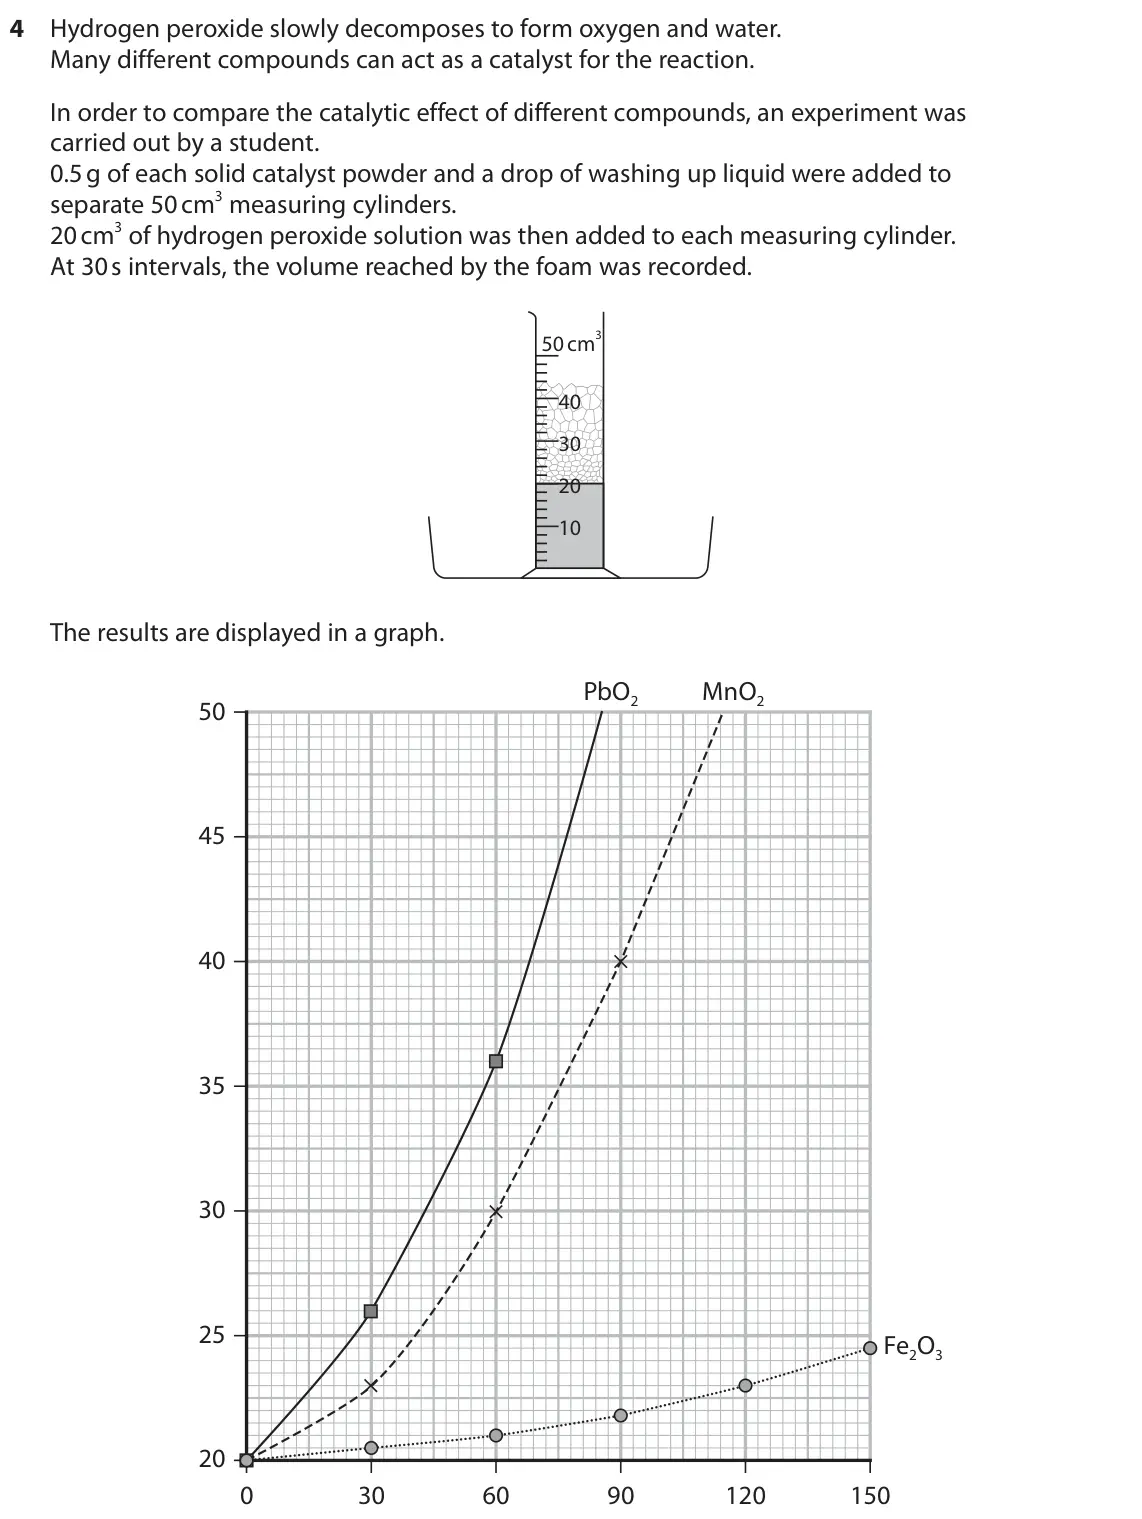
Q4(b)(ii)
The whole paper ↗Q18(c)(i)
The whole paper ↗
Q18(c)(ii)
The whole paper ↗Q2(b)(ii)
The whole paper ↗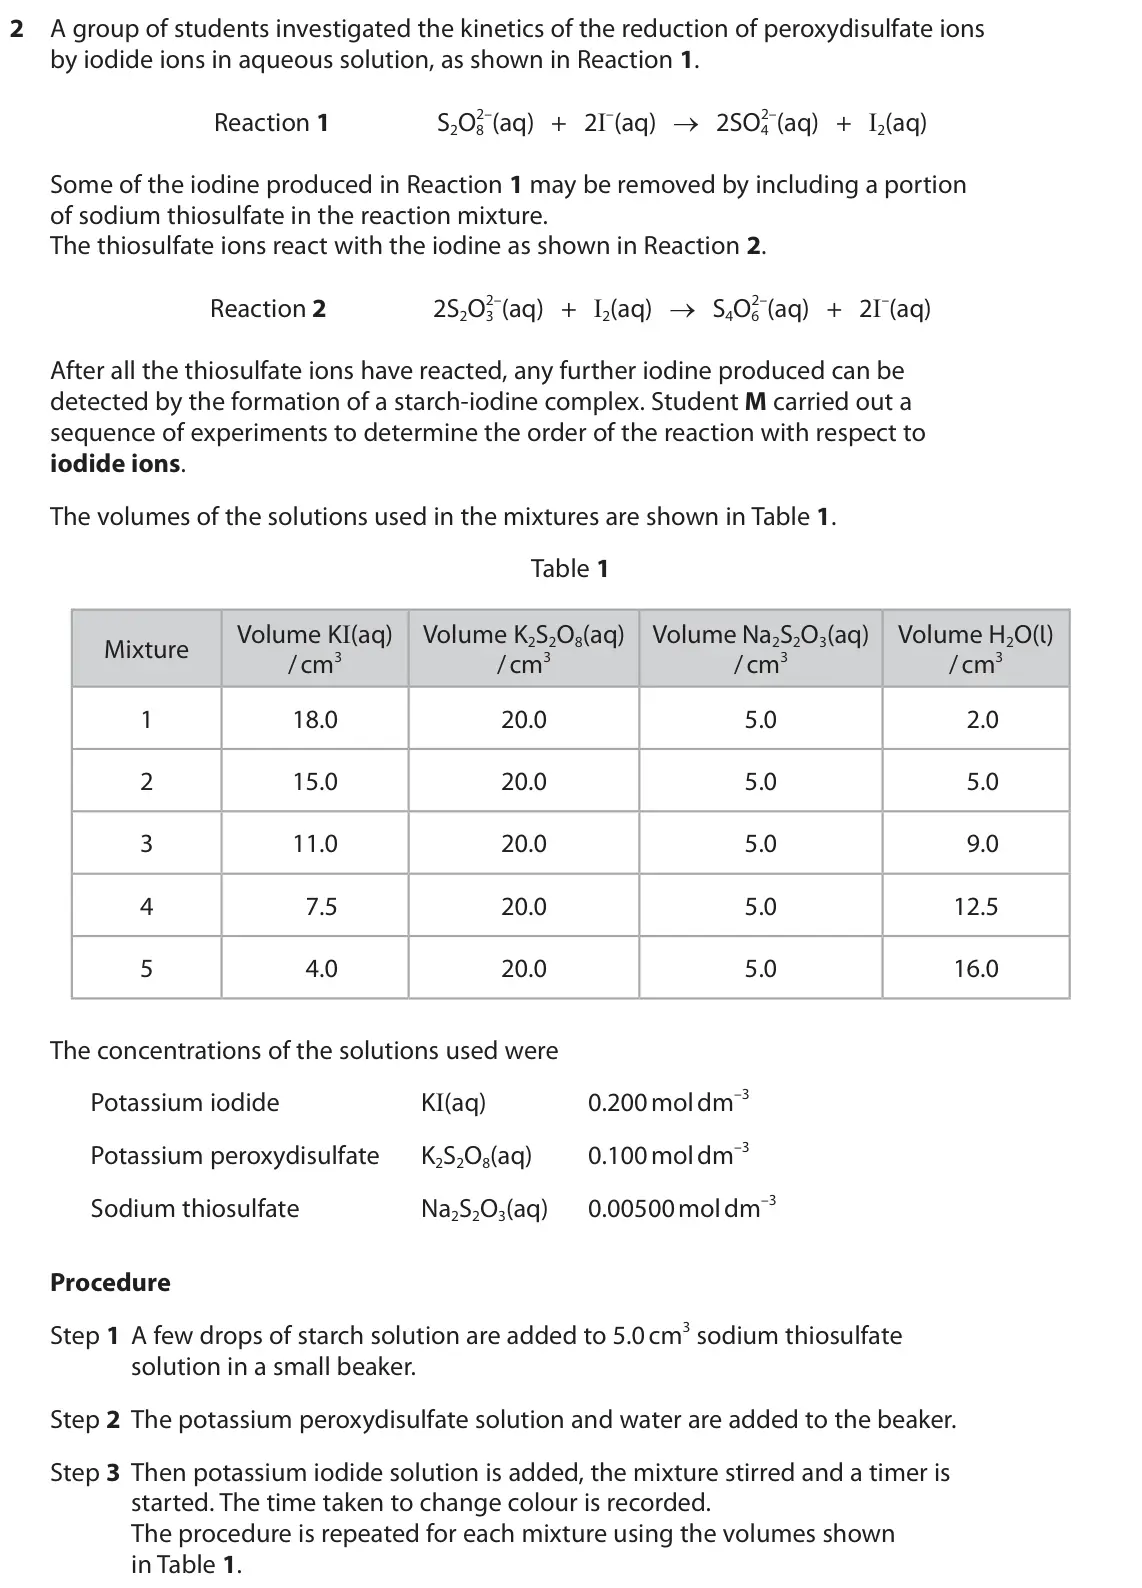
Q19(b)(ii)
The whole paper ↗
Q19(b)(iii)
The whole paper ↗Q17(a)
The whole paper ↗
Q4(d)(i)
The whole paper ↗
Q3(b)(i)
The whole paper ↗
Q4(a)(i)
The whole paper ↗
Q4(a)(ii)
The whole paper ↗Q4(a)(iii)
The whole paper ↗
All 39 questions on Graphs, calculations and significant figures, as a list
- June 2025, Unit 6, Q2(c)(i) (2 marks): Complete the table and calculate the mean titre in cm3. (2)
- June 2025, Unit 6, Q3(d)(i) (3 marks): Complete the table. (3)
- January 2025, AS Unit 2, Q17(b)(ii) (4 marks): Plot a graph of the rate of reaction, as represented by (1 ÷ t) × 103 , against the volume of rhubarb juice. (4)
- January 2025, AS Unit 3, Q2(c) (2 marks): The diagram shows the burette readings from Steps 4 and 5. Burette reading from Step 4 Burette reading from Step 5 Record the burette readings, and hence the vo
- January 2025, Unit 6, Q4(a)(ii) (3 marks): Plot a graph of the concentration of In2– against time. (3)
- October 2024, AS Unit 1, Q17(a)(i) (3 marks): Complete a graph of the results by • plotting the points • labelling the axes • including a straight line of best fit. (3) 8 7 6 5 4 3 2 1 0 0 1 2 3 4 5 6 7 8
- October 2024, AS Unit 3, Q2(a)(i) (3 marks): Draw two lines of best-fit to determine the maximum temperature change at the point of neutralisation. (3) Volume of hydrochloric acid at neutralisation cm3 Max
- October 2024, AS Unit 3, Q4(a) (2 marks): Label the axes of the graph. (2)
- October 2024, AS Unit 3, Q4(b)(ii) (3 marks): Calculate the maximum rate of foam production measured for PbO2. Include units with your answer. (3) Units
- October 2024, Unit 5, Q18(c)(i) (3 marks): Plot a graph of absorbance against concentration using the data in the table. (3)
- October 2024, Unit 5, Q18(c)(ii) (2 marks): 50.0 cm3 of a solution of copper(II) sulfate of unknown concentration was pipetted into a 250.0 cm3 volumetric flask and the volume made up to the mark with dei
- October 2024, Unit 6, Q2(b)(ii) (2 marks): A group of students investigated the kinetics of the reduction of peroxydisulfate ions by iodide ions in aqueous solution, as shown in Reaction 1. 2–(aq) + 2I–(
- June 2024, AS Unit 1, Q19(b)(ii) (3 marks): Plot a graph of the data. Include a line of best fit. (3)
- June 2024, AS Unit 1, Q19(b)(iii) (1 mark): Data for the bromination of 0.5 g samples of a margarine are shown. Volume of 0.0625 mol dm–3 Trial bromine water / cm3 1 36.9 2 34.1 3 39.3 4 32.5 Calculate th
- June 2024, AS Unit 2, Q17(a) (3 marks): Find the end‑point volume and the maximum temperature by adding appropriate lines of best fit to the graph. (3) End‑point volume = Maximum temperature =
- June 2024, AS Unit 3, Q4(d)(i) (2 marks): Determine the maximum temperature change, ∆T , for this reaction, using the graph. You must show your working on the graph. (2)
- June 2024, Unit 6, Q3(b)(i) (3 marks): Plot a graph of volume of sodium thiosulfate against time. (3)
- January 2024, AS Unit 3, Q4(a)(i) (1 mark): Calculate the density of an ethanol‑water mixture, sample A, 5.00 cm3 of which has a mass of 4.75 g. (1)
- January 2024, AS Unit 3, Q4(a)(ii) (3 marks): Plot a graph of density against the percentage of ethanol by volume. (3) Density / g cm–3 percentage ethanol by volume
- January 2024, AS Unit 3, Q4(a)(iii) (1 mark): Determine the percentage of ethanol by volume in sample A using your answer to (a)(i) and the graph in (a)(ii). Show your working on the graph. (1)
- October 2023, AS Unit 3, Q2(d)(i) (3 marks): Plot the data on the grid. (3) 0 0
- October 2023, AS Unit 3, Q2(d)(ii) (2 marks): Use the graph to determine the volume of carbon dioxide formed when 0.25 g of calcium carbonate is used. You must show your working on the graph. (2)
- June 2023, Unit 6, Q3(d)(i) (3 marks): Plot a graph of titre against time. (3)
- January 2023, AS Unit 1, Q24(a)(i) (2 marks): Plot a graph of the data. (2) N3– O2– F– (Ne) Na+ Mg2+ Al3+
- January 2023, AS Unit 1, Q24(a)(ii) (2 marks): Predict the radius of the magnesium ion using a straight line of best fit on your graph. (2)
- January 2023, Unit 6, Q2(b)(i) (2 marks): An experiment was carried out using this procedure. The results are shown. Time / s 50 320 750 1200 2050 3180 4020 Volume of HCl / cm3 24.5 22.0 18.5 15.5 11.0
- October 2022, AS Unit 3, Q3(a)(i) (2 marks): Plot the data on the grid. (2)
- October 2022, Unit 4, Q18(c)(i) (2 marks): Complete the table of data. (2)
- October 2022, Unit 4, Q18(c)(ii) (3 marks): Plot a graph of ln Kc against 1 / T. Include a line of best fit. (3) ln Kc 1 / T (K–1)
- October 2022, Unit 4, Q18(c)(iii) (1 mark): Determine the gradient of your graph. You must show your working on the graph. (1)
- October 2022, Unit 6, Q4(b)(iv) (4 marks): Calculate the rate of the reaction at a time of 2 hours. Include units with your answer. Show your working on the graph. (4)
- January 2022, Unit 4, Q22(b) (2 marks): The value of the total entropy change, ΔS total, varies with temperature. Data for the value of ΔS total at different temperatures but at standard pressure of 1
- January 2022, Unit 6, Q3(c)(i) (1 mark): Complete the table by calculating the remaining values of 1/t. (1)
- January 2022, Unit 6, Q3(c)(ii) (3 marks): Plot a graph of 1/t against the volume of KBr. Include a line of best fit. (3) 0 0
- October 2021, Unit 4, Q17(a)(i) (3 marks): Plot a graph of concentration of benzenediazonium chloride against time. (3)
- October 2021, Unit 4, Q17(b)(iii) (3 marks): Determine the gradient of the graph by drawing a best-fit line. Include a sign and units in your answer. (3)
- June 2021, AS Unit 1, Q22(a)(i) (2 marks): Plot a graph of atomic radius against atomic number. (2)
- June 2019, AS Unit 3, Q3(b)(i) (3 marks): Plot a labelled graph of mass of metal on the horizontal axis against temperature change on the vertical axis. (3)
- June 2019, AS Unit 3, Q3(b)(ii) (2 marks): Determine the mass of metal M that reacts exactly with 50.0 cm3 of 1.35 mol dm−3 copper(II) sulfate by drawing appropriate best-fit straight lines. You must sho
Questions, mark schemes and examiner’s reports are © Pearson Edexcel, from their published past papers. Plumi isn’t affiliated with any exam board. Want whole papers? Edexcel International A Level Chemistry past papers.
The Plumi iPad app also offers exam-style questions with AI feedback on your handwritten working.