 plumi
Calculating rates from time and graphs: Edexcel International A Level Chemistry questions
Edexcel International A Level Chemistry past-paper questions on 9.A.2 Calculating rates from time and graphs, 2019–2025, with mark schemes and examiner’s reports where available.
Paper
All papers
Exam
All years
Calculations
Q8(a)
The whole paper ↗ Your answer
Q8(b)
The whole paper ↗Your answerQ17(b)(i)
The whole paper ↗
Q17(b)(ii)
The whole paper ↗Q18(c)(i)
The whole paper ↗
Q4(b)(i)
The whole paper ↗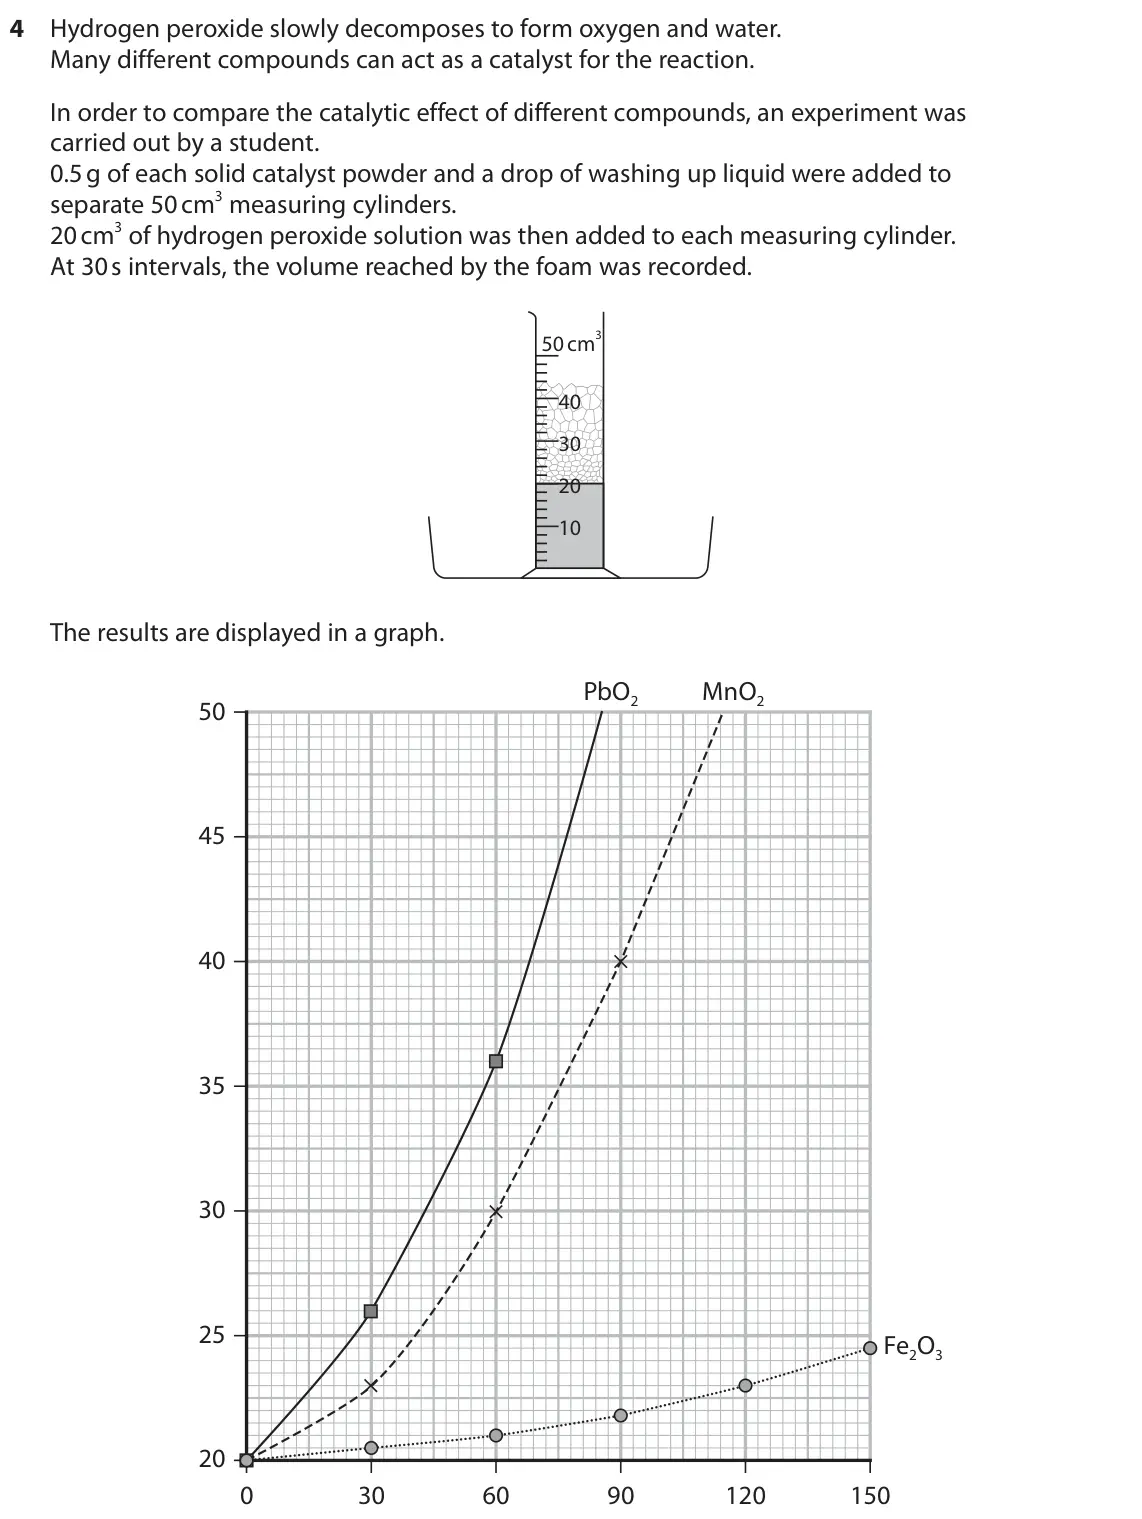
Q4(b)(ii)
The whole paper ↗Q4(c)(ii)
The whole paper ↗Q16(a)(i)
The whole paper ↗
Q3(b)
The whole paper ↗ Your answer
Q4(c)
The whole paper ↗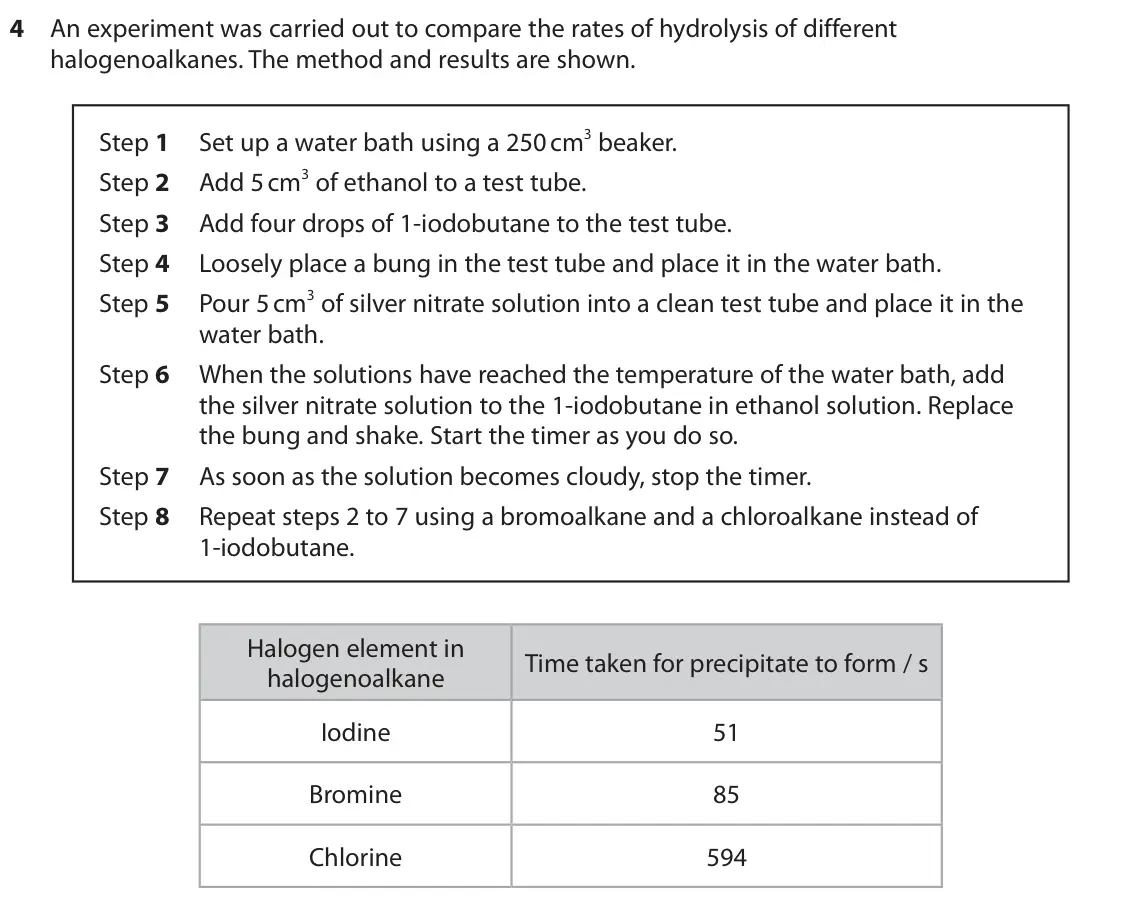
- Your answer
- Your answer
Q4(b)(iv)
The whole paper ↗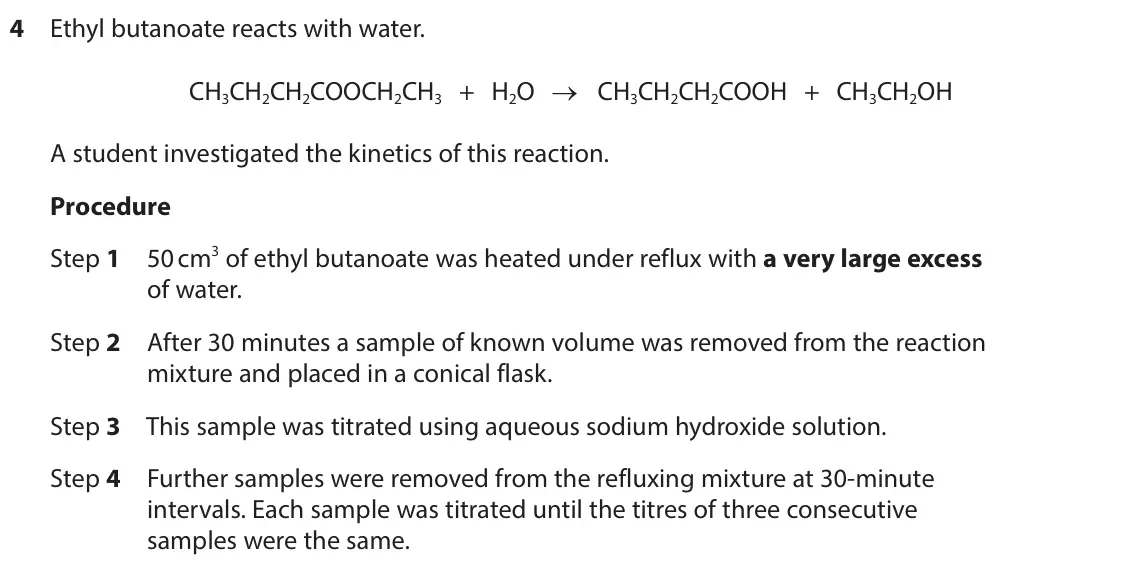
Q15(b)(ii)
The whole paper ↗
Q4(a)(i)
The whole paper ↗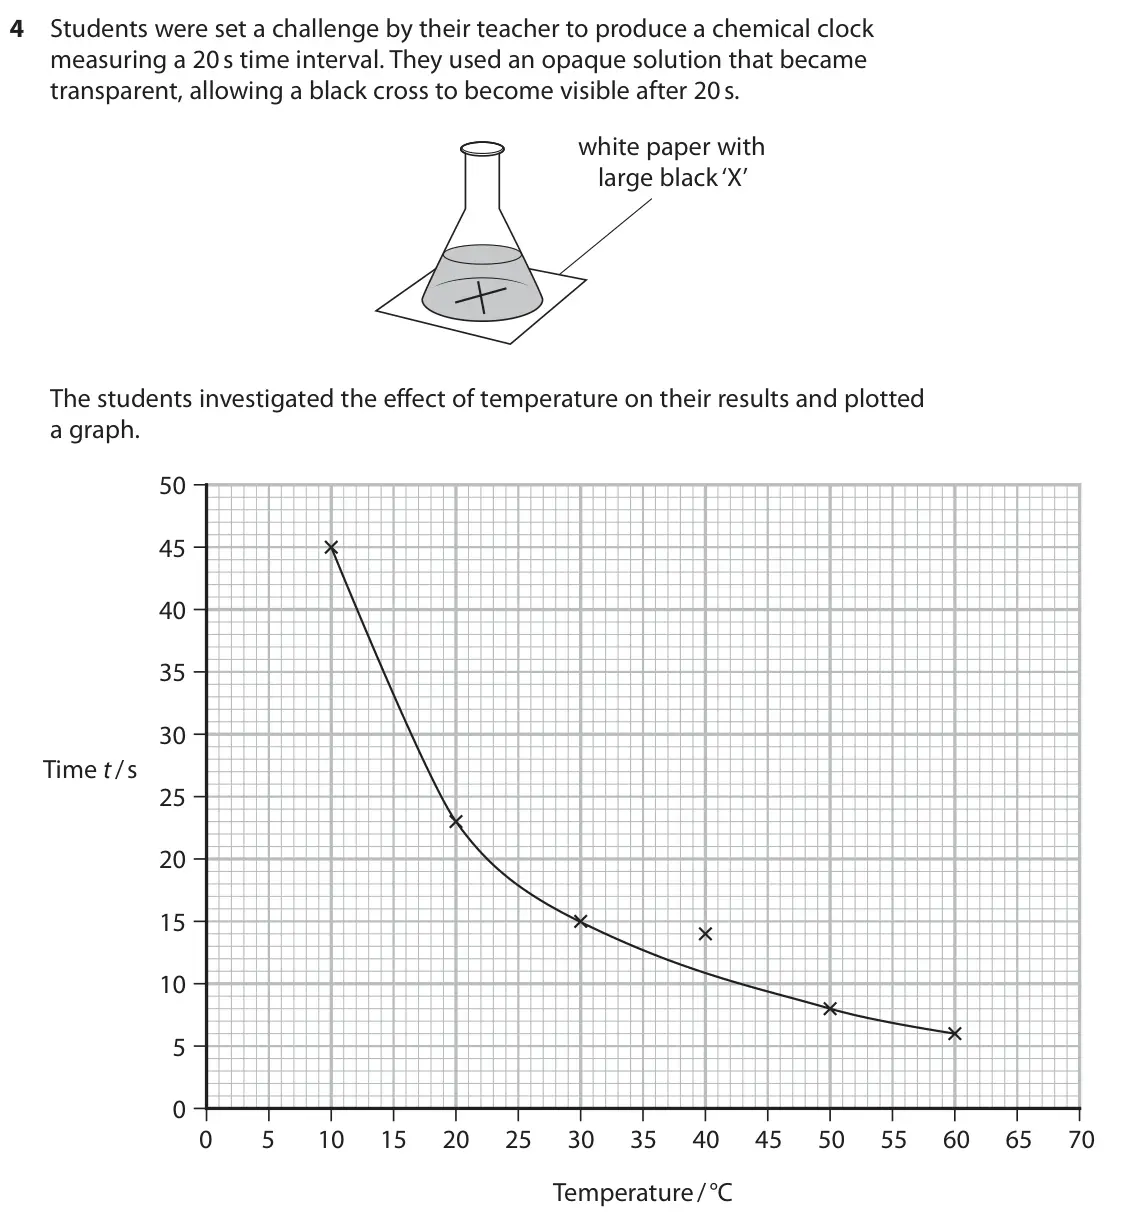
- Your answer
Q5(b)
The whole paper ↗ Your answer
Q11(b)
The whole paper ↗
Q11(c)
The whole paper ↗
All 22 questions on Calculating rates from time and graphs, as a list
- January 2025, AS Unit 2, Q8(a) (1 mark): What is the approximate value of the initial rate of reaction? (1) A 4.5 × 10⁻⁵ B 1.8 × 10⁻⁵ C 1.3 × 10⁻⁵ D 2.0 × 10⁻⁶
- January 2025, AS Unit 2, Q8(b) (1 mark): What are the units for the rate of reaction? (1) A mol s–1 B mol dm–3 s–1 C mol dm3 s–1 D dm3 mol–1 s Use this space for any rough working. Anything you write i
- January 2025, AS Unit 2, Q17(b)(i) (1 mark): Complete the table. (1) Acidified (1 ÷ t) × 103 Rhubarb juice Deionised 1 ÷ t manganate(VII) Time (t) / s / cm3 water / cm3 / s–1 / s–1 / cm3 5 1 5 398 0.00251
- January 2025, AS Unit 2, Q17(b)(ii) (4 marks): Plot a graph of the rate of reaction, as represented by (1 ÷ t) × 103 , against the volume of rhubarb juice. (4)
- January 2025, Unit 4, Q18(c)(i) (2 marks): The graph shows the results of an experiment at 80°C. 80 70 60 50 Volume of hydrogen 40 / cm3 30 20 10 0 10 20 30 40 50 60 70 80 90 Time / s Calculate the react
- October 2024, AS Unit 3, Q4(b)(i) (1 mark): State how PbO2 can be identified as the best catalyst under these conditions. (1)
- October 2024, AS Unit 3, Q4(b)(ii) (3 marks): Calculate the maximum rate of foam production measured for PbO2. Include units with your answer. (3) Units
- October 2024, AS Unit 3, Q4(c)(ii) (2 marks): In a repeat experiment, a larger measuring cylinder was used so that it contained all the foam produced. Sketch the expected graph of the volume reached by the
- June 2024, Unit 4, Q16(a)(i) (3 marks): Calculate the initial rate of reaction, in mol dm–3 s–1, at 1000 K. You must show your working on the graph. (3)
- June 2024 (R), AS Unit 2, Q3(b) (1 mark): The graph shows the results of one of the experiments. 120 100 80 Volume of carbon dioxide / cm3 60 40 20 0 0 20 40 60 80 100 120 Time / s What is the approxima
- June 2024 (R), AS Unit 3, Q4(c) (1 mark): State how the results of this experiment could be converted into a value that can be used as a measure of rate. (1)
- June 2023, AS Unit 2, Q15 (1 mark): Hydrogen peroxide decomposes in the presence of a catalyst. 2H2O2(aq) → 2H2O(l) + O2(g) The volume of gas formed is measured at regular time intervals and the d
- October 2022, AS Unit 2, Q16 (1 mark): The results of an experiment to determine the rate of the reaction between magnesium and hydrochloric acid are shown. 120 100 80 Volume of hydrogen / cm3 60 40
- October 2022, Unit 6, Q4(b)(iv) (4 marks): Calculate the rate of the reaction at a time of 2 hours. Include units with your answer. Show your working on the graph. (4)
- June 2022, AS Unit 2, Q15(b)(ii) (3 marks): The results of the student’s experiment are shown on the graph. 100 80 60 Volume of CO2 / cm3 40 20 0 0 120 240 360 480 600 Time / s Calculate the initial rate
- October 2021, AS Unit 3, Q4(a)(i) (3 marks): Calculate the rate at 15 °C to a suitable number of significant figures. Include units in your answer. (3)
- June 2021, AS Unit 2, Q3 (1 mark): The graph shows how the concentration of iodine changes with time in a reaction. 0.30 0.25 0.20 [I2] 0.15 / mol dm–3 0.10 0.05 0.00 0 2 4 6 8 10 12 14 16 Time /
- October 2020, AS Unit 2, Q5(b) (1 mark): In an experiment, the volume of oxygen produced by the decomposition of hydrogen peroxide was measured at various times as the reaction progressed and a graph w
- October 2020, AS Unit 2, Q11(b) (1 mark): Which sketch graph shows the volume of carbon dioxide (y‑axis) plotted against time (x‑axis) during the reaction? (1) A B C D
- October 2020, AS Unit 2, Q11(c) (1 mark): Which sketch graph shows the rate of the reaction (y‑axis) plotted against time (x‑axis) during the reaction? (1) A B C D
- October 2020, Unit 6, Q3(d)(iv) (1 mark): Reciprocal time (1/t) is used as a measure of rate in this experiment. Suggest the assumption on which this depends. Refer in your answer to the shape of a typi
- June 2019, AS Unit 2, Q17 (1 mark): The graph shows how the concentration of a reactant changes with time. e d Concentration c 0 0 b a Time Which expression gives the best estimate for the value o
Questions, mark schemes and examiner’s reports are © Pearson Edexcel, from their published past papers. Plumi isn’t affiliated with any exam board. Want whole papers? Edexcel International A Level Chemistry past papers.
The Plumi iPad app also offers exam-style questions with AI feedback on your handwritten working.