 plumi
Presenting data, conclusions and uncertainties: Edexcel International A Level Chemistry questions
Edexcel International A Level Chemistry past-paper questions on P.1.2 Presenting data, conclusions and uncertainties, 2019–2025, with mark schemes and examiner’s reports where available.
Paper
All papers
Exam
All years
Calculations
Q4(e)(ii)
The whole paper ↗
Q2(c)(iii)
The whole paper ↗
Q2(e)
The whole paper ↗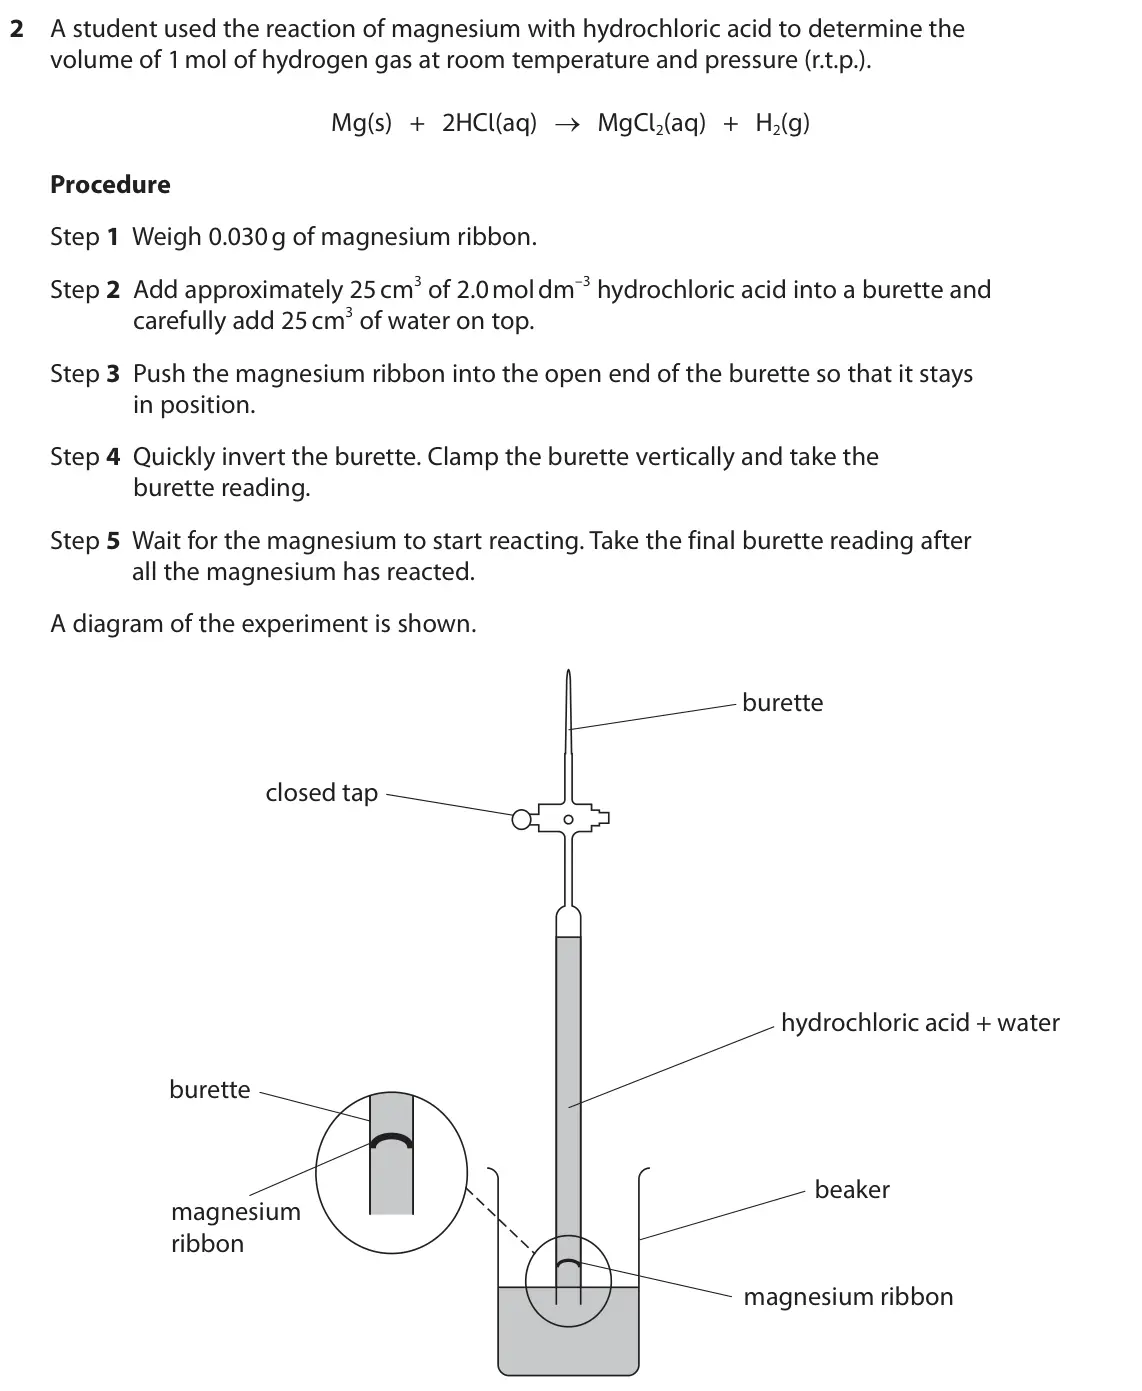
Q2(f)(i)
The whole paper ↗Q4(b)(iii)
The whole paper ↗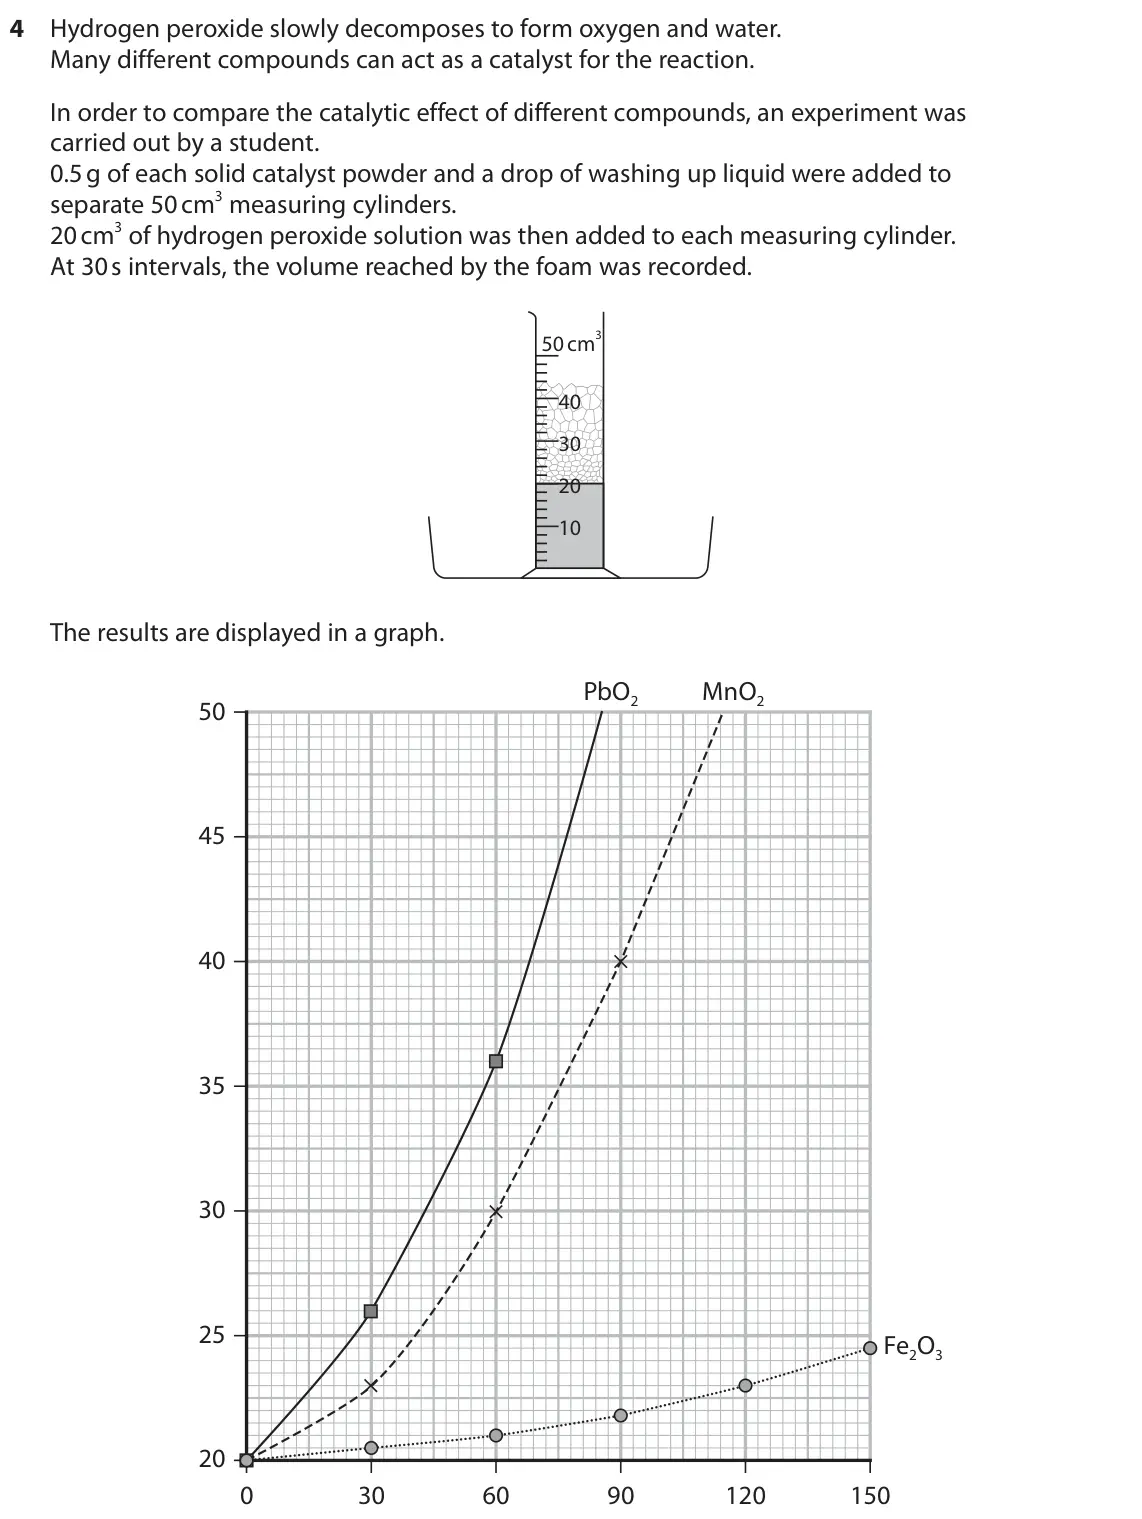
Q4(c)(i)
The whole paper ↗Q18(c)(iii)
The whole paper ↗
Q4(d)(iii)
The whole paper ↗
Q4(d)
The whole paper ↗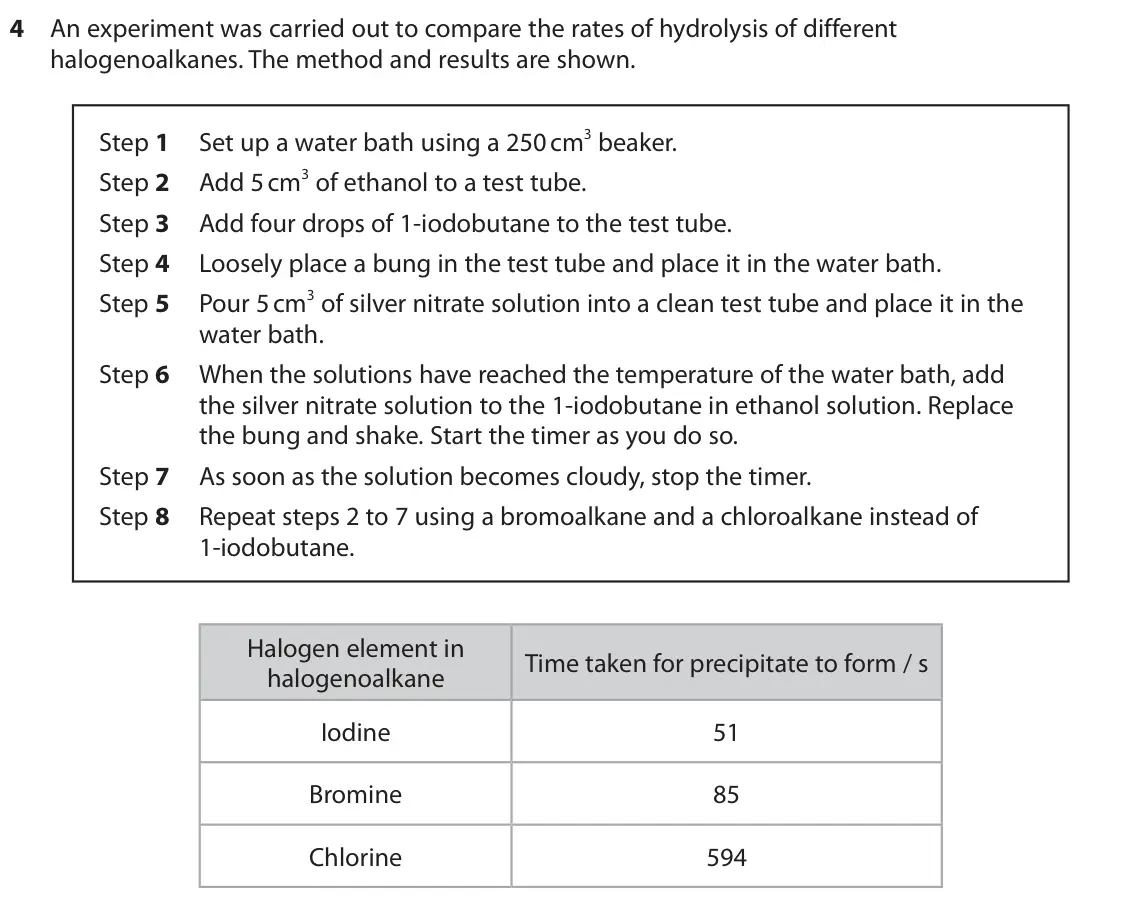
Q4(b)(i)
The whole paper ↗
Q2(b)(iv)
The whole paper ↗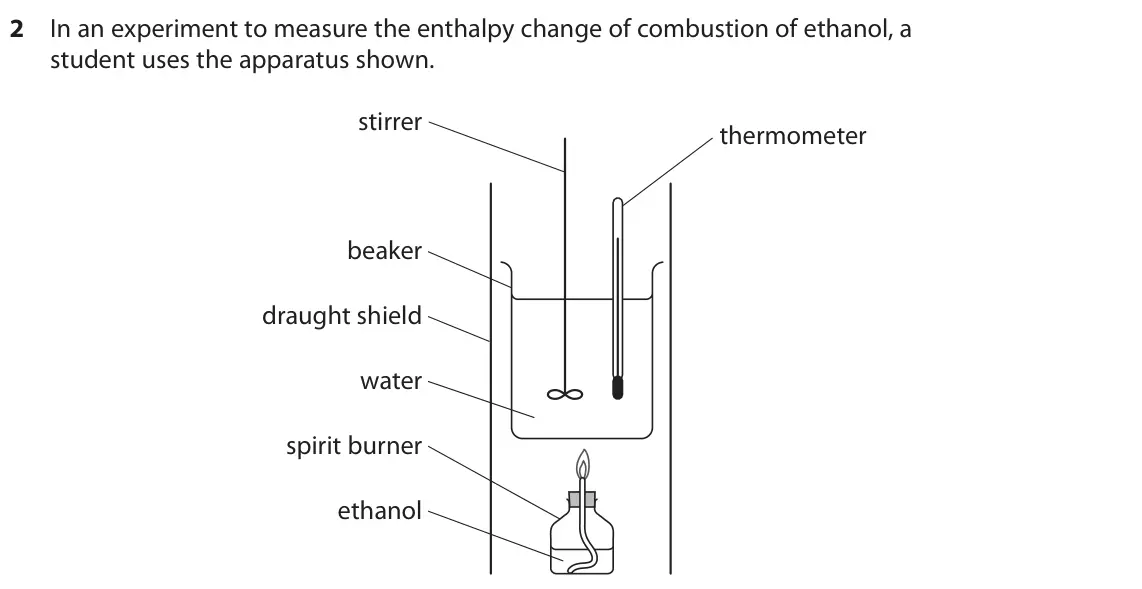
Q2(c)(i)
The whole paper ↗Q2(c)(ii)
The whole paper ↗Q3(c)
The whole paper ↗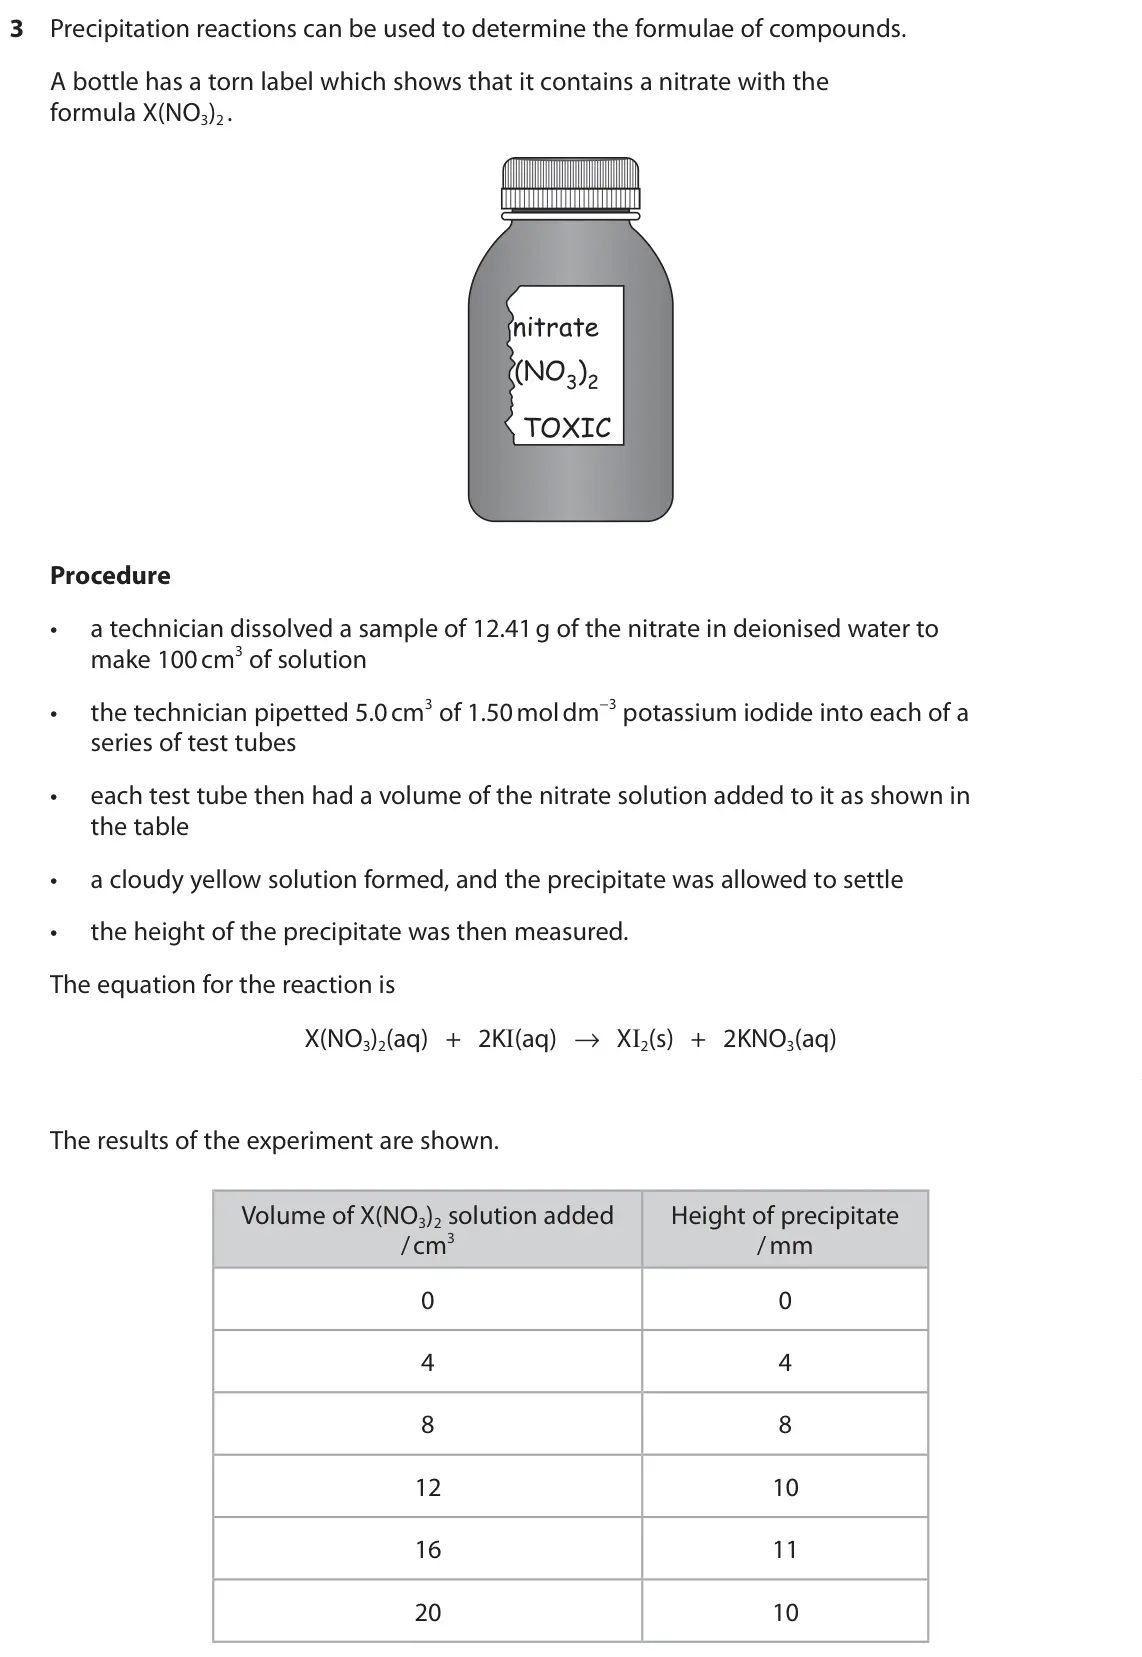
Q2(d)(i)
The whole paper ↗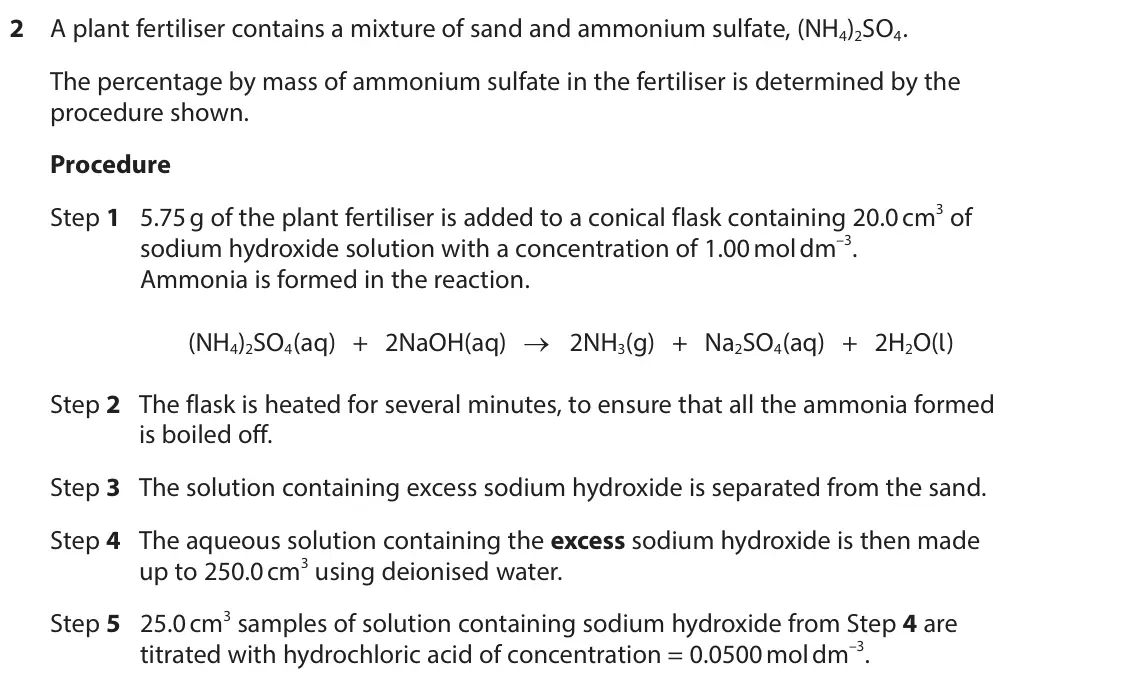
Q2(b)(i)
The whole paper ↗
Q2(b)(ii)
The whole paper ↗- Your answer
Q1(c)(ii)
The whole paper ↗
Q3(c)(i)
The whole paper ↗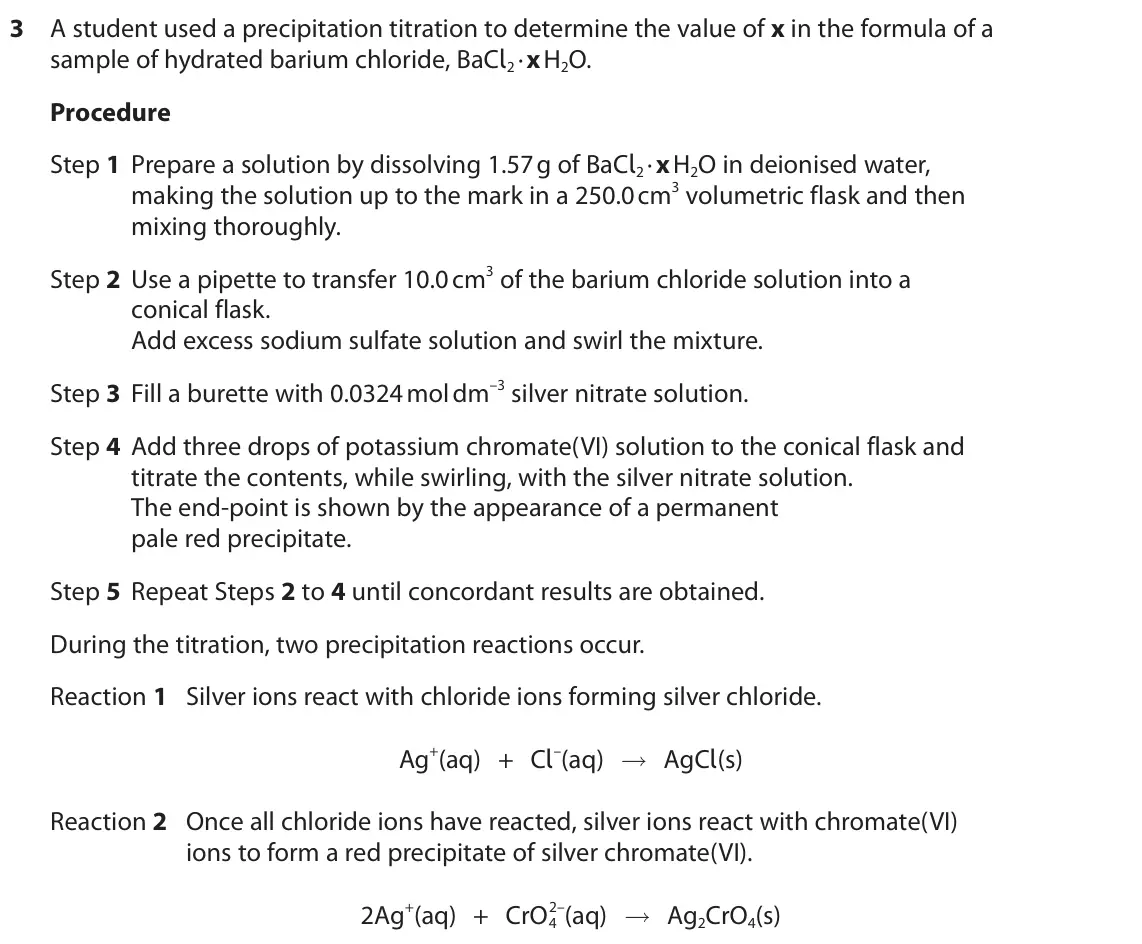
All 25 questions on Presenting data, conclusions and uncertainties, as a list
- June 2025, AS Unit 3, Q4(e)(ii) (2 marks): Explain why, during an experiment using 2.00 g of accurately weighed out iron wool, the mass of product measured in the weighing bottle was greater than your an
- June 2025, Unit 6, Q2(c)(iii) (1 mark): The solubility of calcium hydroxide decreases with increasing temperature. Suggest why the mean titre from the experiment in (c)(i) does not agree with the expe
- January 2025, AS Unit 3, Q2(e) (2 marks): The magnesium ribbon used in Step 1 contained a magnesium oxide impurity of up to 2% by mass. Explain whether this magnesium oxide impurity could account for an
- January 2025, AS Unit 3, Q2(f)(i) (1 mark): Calculate the percentage uncertainty in the mass of magnesium used in the experiment. (1)
- October 2024, AS Unit 3, Q4(b)(iii) (1 mark): Suggest why the value calculated from the graph may not be accurate. (1)
- October 2024, AS Unit 3, Q4(c)(i) (1 mark): In most kinetics experiments the rate of reaction decreases with time. Suggest a reason why the rate of reaction seems to increase in this experiment. (1)
- October 2024, Unit 5, Q18(c)(iii) (1 mark): Give one possible reason why any concentrations of copper(II) sulfate determined from the graph of values over 0.50 mol dm−3 are uncertain. (1)
- June 2024, AS Unit 3, Q4(d)(iii) (1 mark): Give a possible reason why the temperature does not appear to change at various times, such as 5½ to 6½ minutes. (1)
- June 2024 (R), AS Unit 3, Q4(d) (1 mark): State why it is not necessary to repeat these experiments for each halogenoalkane. (1)
- June 2023, AS Unit 3, Q4(b)(i) (1 mark): Calculate the percentage error in this student’s value. The data book value for the molar volume of hydrogen under these conditions is 23.9 dm3 mol–1. (1)
- January 2023, AS Unit 3, Q2(b)(iv) (1 mark): The uncertainty in each reading of the thermometer was ±0.1°C. Calculate the percentage uncertainty in the temperature change in the student’s experiment. (1)
- January 2023, AS Unit 3, Q2(c)(i) (1 mark): State how the changes in the experiment improve the percentage uncertainties in the measurement of mass and temperature. No calculation is required. (1)
- January 2023, AS Unit 3, Q2(c)(ii) (2 marks): Explain how the difference between uncertainty and accuracy led the teacher to make this statement. (2)
- October 2022, AS Unit 3, Q3(c) (1 mark): Suggest why some of the precipitate heights may be above the maximum height expected. Assume there were no measurement errors. (1)
- October 2022, Unit 6, Q2(d)(i) (3 marks): Explain the effect, if any, on the titre value and hence on the calculated percentage of ammonium sulfate in the fertiliser. (3)
- June 2022, AS Unit 3, Q2(b)(i) (1 mark): Calculate the experimental error for the second student. [Ar of potassium = 39.1] (1)
- June 2022, AS Unit 3, Q2(b)(ii) (3 marks): The second student calculated the Ar value of M to be 37.52 with a total percentage uncertainty of 4.5 %. Comment on the value of 37.52 obtained by this student
- June 2022, Unit 5, Q6 (1 mark): A titre has an uncertainty of 0.32 %. The uncertainty of each burette reading is ±0.05 cm3 . What is the most likely value of the titre in cm3 ? A 6.40 B 15.60
- January 2022, AS Unit 3, Q1(c)(ii) (2 marks): The total percentage uncertainty in this experiment was 2.6 %. Show that the enthalpy change of 14.5 kJ mol–1 is consistent with a data book value of 14.8 kJ mo
- January 2022, AS Unit 3, Q3(c)(i) (2 marks): Complete the table and use the concordant results to calculate the mean titre. (2)
- October 2021, AS Unit 3, Q4(b) (2 marks): Evaluate the students' results and decide whether it is necessary to repeat their experiments. (2)
- October 2021, Unit 6, Q3(c) (1 mark): The thermometer used to measure the temperature change had an uncertainty of ±0.25 °C for each measurement. Calculate the percentage uncertainty in the temperat
- January 2021, AS Unit 3, Q3(b)(ii) (2 marks): The student suggested that the experiment could be made more accurate by increasing the mass of carbonate from 0.33 g to 1.00 g. No changes to the size of the a
- October 2020, Unit 6, Q3(e)(ii) (2 marks): Give two reasons why Run 1 has the lowest uncertainty in the volume measurements. (2)
- June 2019, AS Unit 3, Q3(b)(iv) (1 mark): One mass of M in the experiment gave an anomalous data point. Suggest a reason, other than measurement error, for this anomaly. (1)
Questions, mark schemes and examiner’s reports are © Pearson Edexcel, from their published past papers. Plumi isn’t affiliated with any exam board. Want whole papers? Edexcel International A Level Chemistry past papers.
The Plumi iPad app also offers exam-style questions with AI feedback on your handwritten working.