 plumi
Population size and ecosystems: WJEC A‑Level Biology questions
Every WJEC A-Level Biology exam question on 3.5 Population size and ecosystems, 2016–2025, with its mark scheme and examiner’s report.
Find questions1,223
Calculations
Q4(a)
The whole paper ↗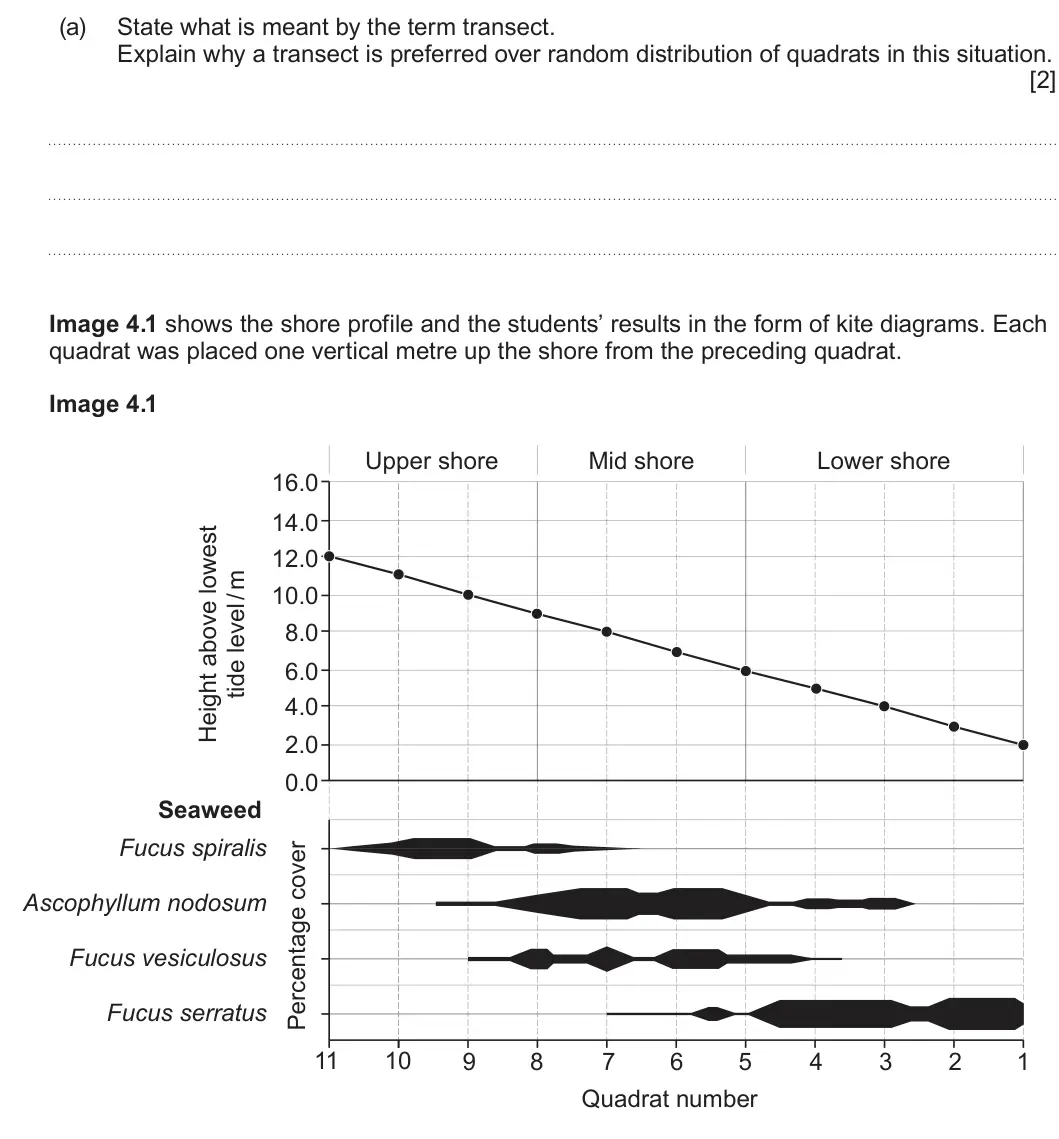
Q4(b)
The whole paper ↗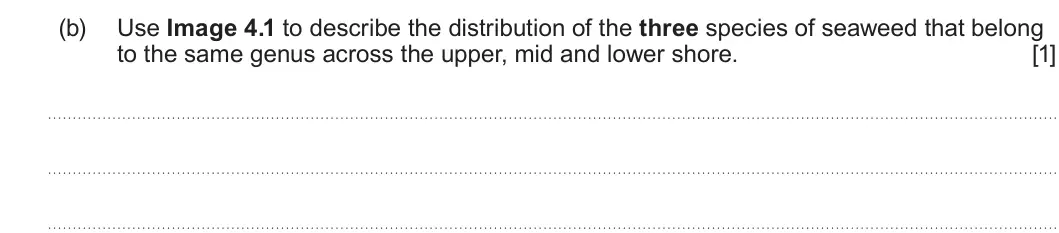
Q4(c)(i)
The whole paper ↗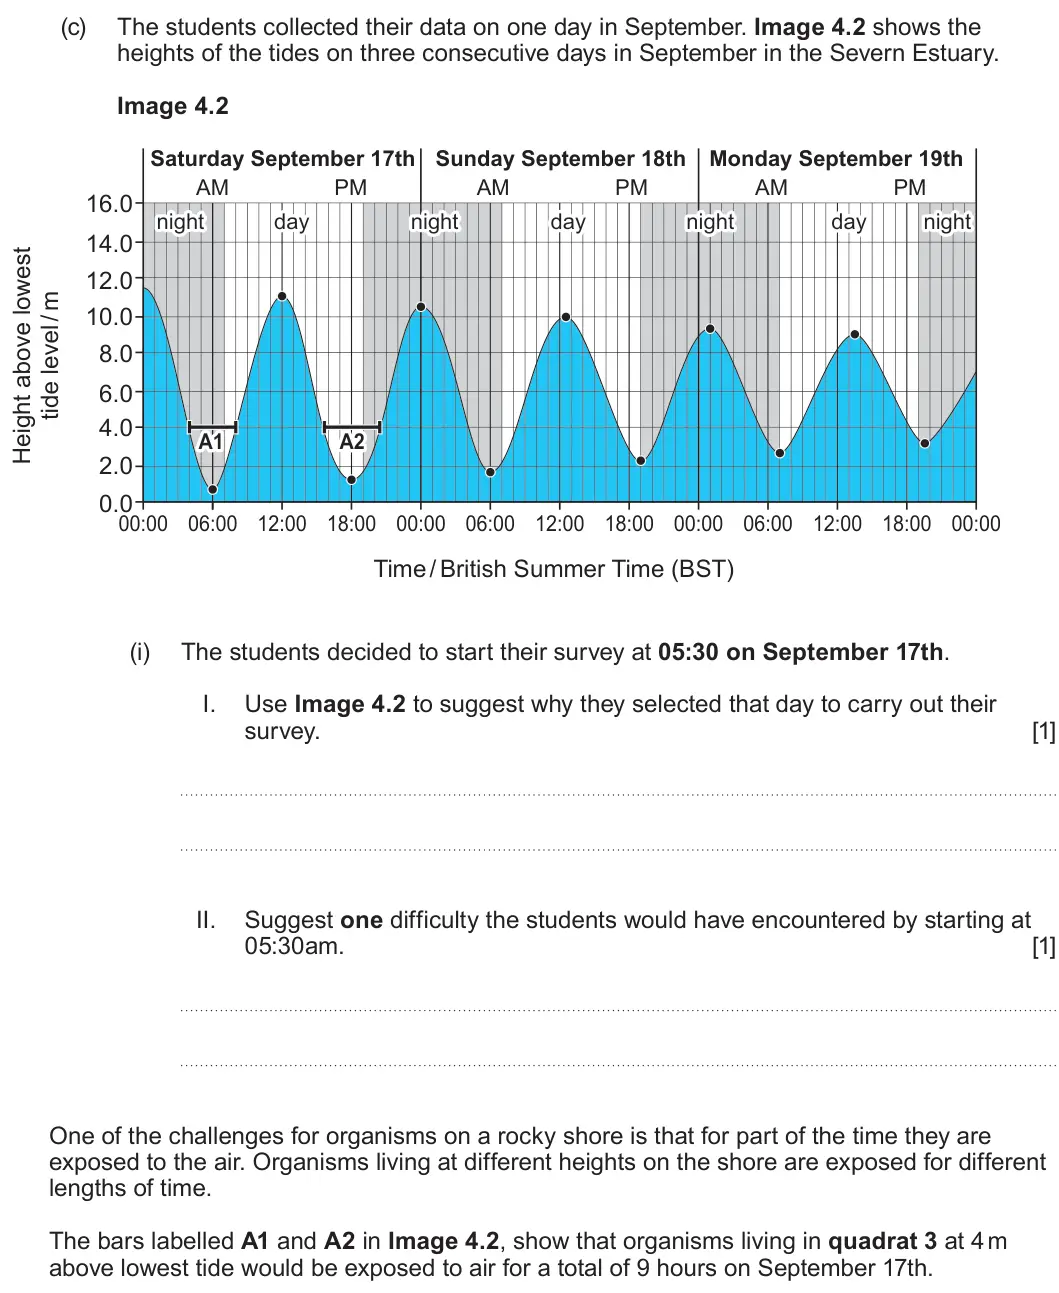
Q4(c)(ii)
The whole paper ↗
Q4(d)
The whole paper ↗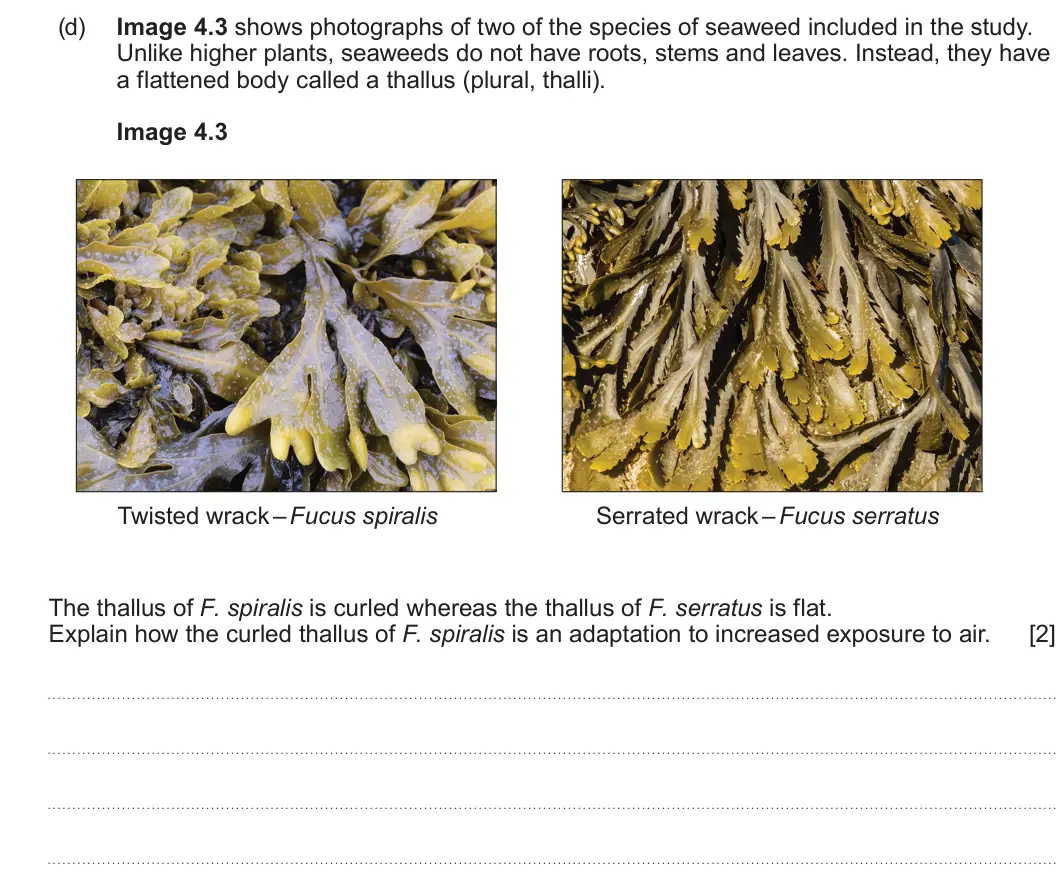
Q4(e)(ii)
The whole paper ↗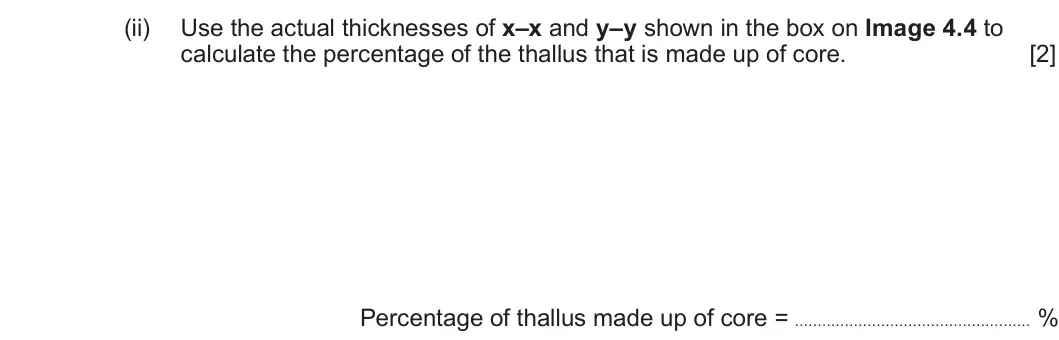
Q4(f)(i)
The whole paper ↗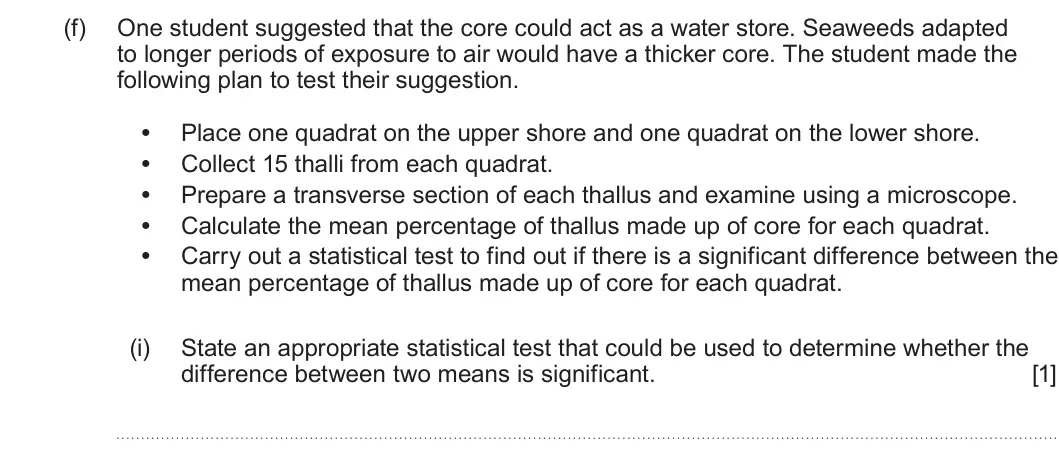
Q4(f)(ii)
The whole paper ↗
Q4(f)(iii)
The whole paper ↗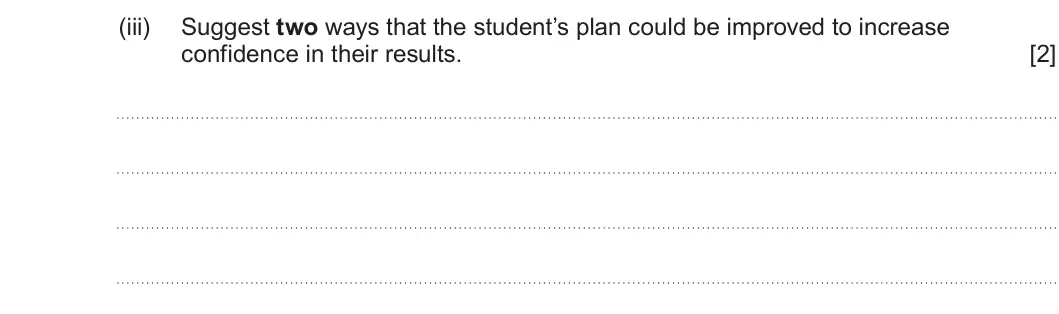
Q3(c)
The whole paper ↗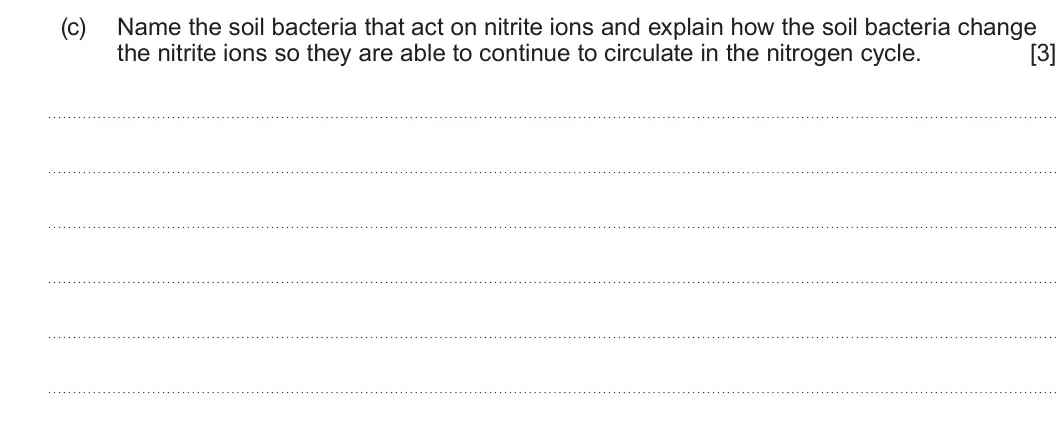
Q6(a)(i)
The whole paper ↗
Q6(a)(ii)
The whole paper ↗
Q6(a)(iii)
The whole paper ↗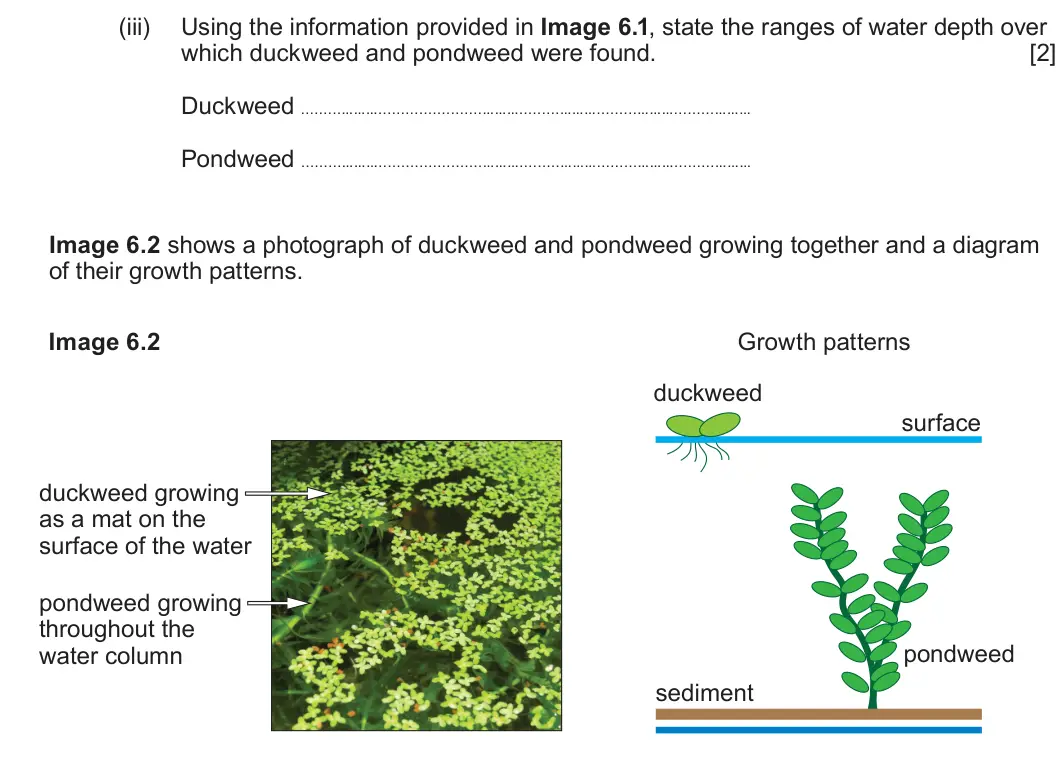
Q6(b)(i)
The whole paper ↗
Q6(b)(ii)
The whole paper ↗
Q6(b)(iii)
The whole paper ↗
Q2(d)(i)
The whole paper ↗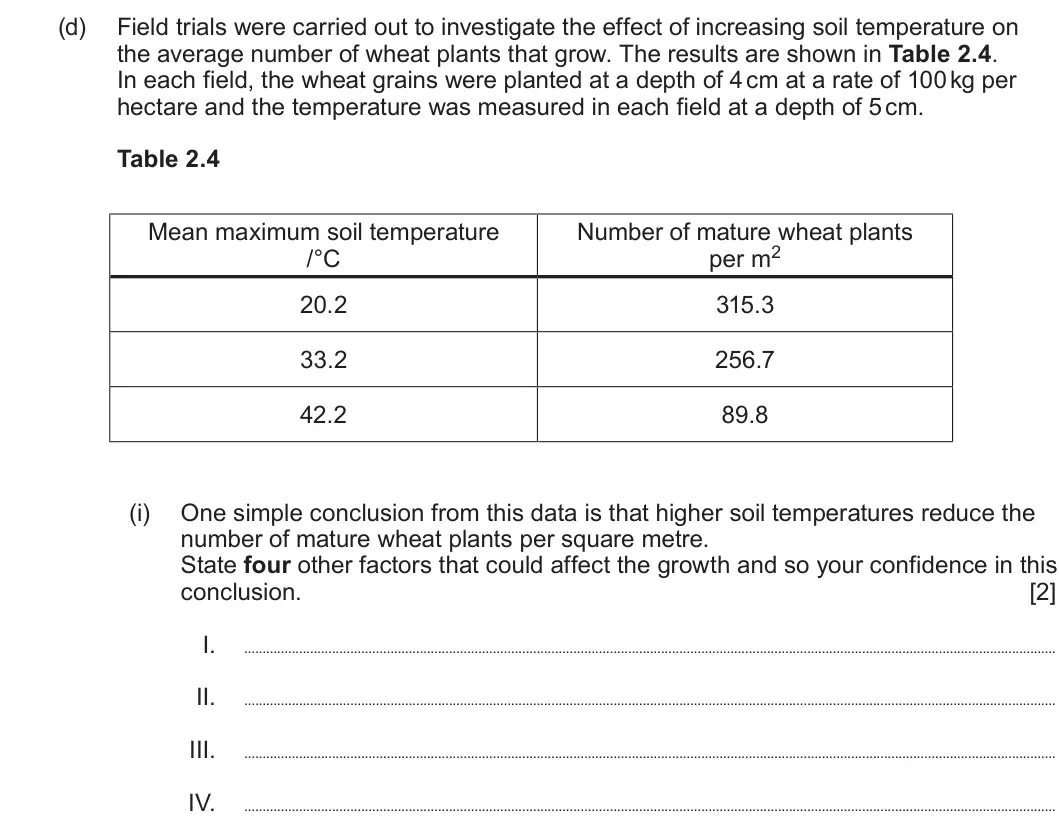
Q2(e)(i)
The whole paper ↗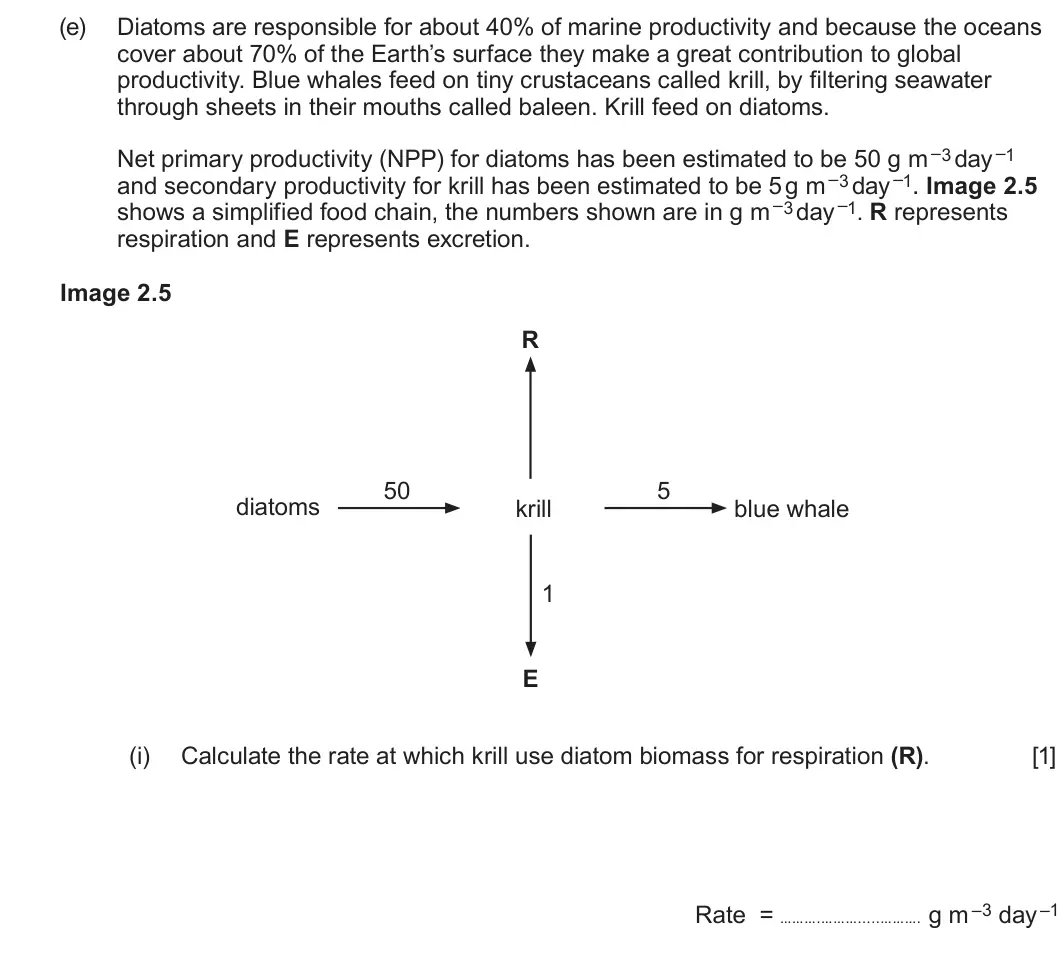
Q2(e)(ii)
The whole paper ↗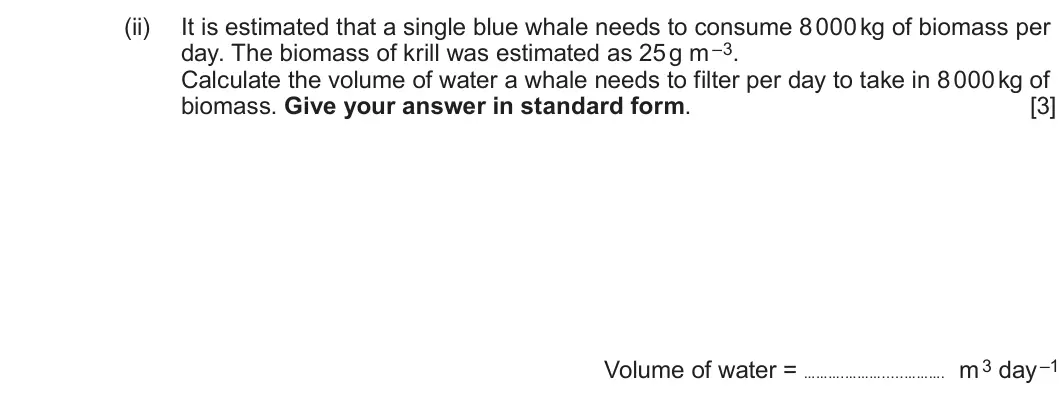
All 59 questions on Population size and ecosystems, as a list
- Summer 2025, Unit 3, Q4(a) (2 marks): State what is meant by the term transect. Explain why a transect is preferred over random distribution of quadrats in this situation. [2] Image 4.1 shows the sh
- Summer 2025, Unit 3, Q4(b) (1 mark): Use Image 4.1 to describe the distribution of the three species of seaweed that belong to the same genus across the upper, mid and lower shore. [1]
- Summer 2025, Unit 3, Q4(c)(i) (2 marks): The students decided to start their survey at 05:30 on September 17th. I. Use Image 4.2 to suggest why they selected that day to carry out their survey. [1] II.
- Summer 2025, Unit 3, Q4(c)(ii) (2 marks): Use information from Images 4.1 and 4.2 to calculate how many hours the organisms living in quadrat 7 would be exposed to air on September 17th. Draw lines on I
- Summer 2025, Unit 3, Q4(d) (2 marks): Image 4.3 shows photographs of two of the species of seaweed included in the study. Unlike higher plants, seaweeds do not have roots, stems and leaves. Instead,
- Summer 2025, Unit 3, Q4(e)(ii) (2 marks): Use the actual thicknesses of x–x and y–y shown in the box on Image 4.4 to calculate the percentage of the thallus that is made up of core. [2] Percentage of th
- Summer 2025, Unit 3, Q4(f)(i) (1 mark): State an appropriate statistical test that could be used to determine whether the difference between two means is significant. [1]
- Summer 2025, Unit 3, Q4(f)(ii) (1 mark): Use the information given above to state the Null Hypothesis for their test. [1]
- Summer 2025, Unit 3, Q4(f)(iii) (2 marks): Suggest two ways that the student’s plan could be improved to increase confidence in their results. [2]
- Summer 2024, Unit 3, Q3(c) (3 marks): Name the soil bacteria that act on nitrite ions and explain how the soil bacteria change the nitrite ions so they are able to continue to circulate in the nitro
- Summer 2024, Unit 3, Q6(a)(i) (1 mark): State the name given to the type of sampling technique used in this survey. [1]
- Summer 2024, Unit 3, Q6(a)(ii) (2 marks): The swamp in this survey could be correctly termed as both a habitat and an ecosystem. Distinguish between the terms, habitat and ecosystem. [2]
- Summer 2024, Unit 3, Q6(a)(iii) (2 marks): Using the information provided in Image 6.1, state the ranges of water depth over which duckweed and pondweed were found. [2] Duckweed Pondweed Image 6.2 shows
- Summer 2024, Unit 3, Q6(b)(i) (1 mark): With reference to Image 6.2 suggest why duckweed outcompetes pondweed in the shallower part of the range. [1]
- Summer 2024, Unit 3, Q6(b)(ii) (3 marks): Name two nutrients for which the plants will compete and explain what each nutrient is used for in the plants. [3]
- Summer 2024, Unit 3, Q6(b)(iii) (3 marks): Explain why the concentration of nutrients is likely to be greater at the bottom of the pools and suggest a hypothesis to explain why pondweed outcompetes duckw
- Summer 2024, Unit 4, Q2(d)(i) (2 marks): One simple conclusion from this data is that higher soil temperatures reduce the number of mature wheat plants per square metre. State four other factors that c
- Summer 2023, Unit 3, Q2(e)(i) (1 mark): Calculate the rate at which krill use diatom biomass for respiration (R). [1] Rate = . ..... . g m –3 day –1
- Summer 2023, Unit 3, Q2(e)(ii) (3 marks): It is estimated that a single blue whale needs to consume 8 000 kg of biomass per day. The biomass of krill was estimated as 25 g m –3. Calculate the volume of
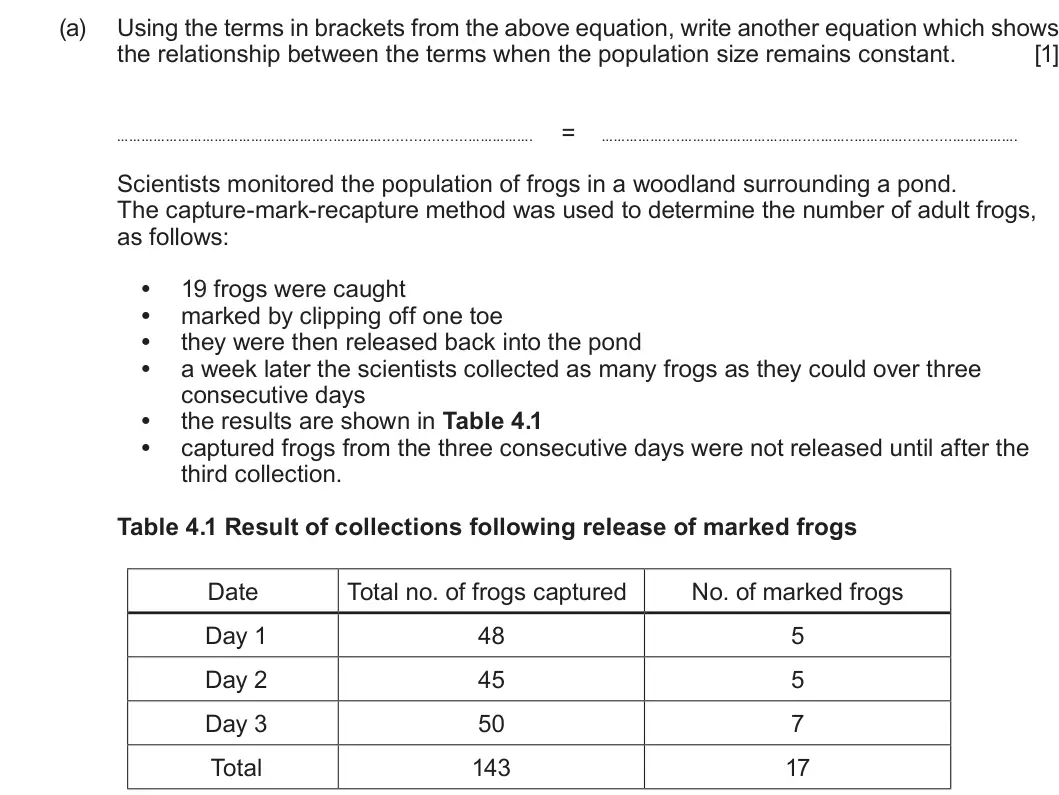
- Summer 2023, Unit 3, Q4(a) (1 mark): Using the terms in brackets from the above equation, write another equation which shows the relationship between the terms when the population size remains cons
- Summer 2023, Unit 3, Q4(b)(i) (2 marks): From the figures given in the method and Table 4.1 estimate the total number of frogs in the woodland, using the following formula: [2] N = Mn m Where, • N = nu
- Summer 2023, Unit 3, Q4(b)(ii) (1 mark): Explain why the chosen method of marking the frogs might have affected the estimate of the frog population. [1]
- Summer 2023, Unit 3, Q4(d)(i) (3 marks): Calculate the rate of decline in number of tadpoles for pond 1 at day 10 Give your answer to two significant figures. [3] Rate of decline .. .. .. tadpoles m–3
- Summer 2023, Unit 3, Q4(d)(ii) (3 marks): Using the information from Graph 4.2 it was concluded that a density-dependent factor was causing the change in the tadpole populations. State the evidence for
- Summer 2023, Unit 3, Q4(e)(i) (2 marks): With reference to Graph 4.3, state two conclusions that can be drawn about the effect of density and selection on the rate of development of tadpoles in the thr
- Summer 2023, Unit 3, Q4(e)(ii) (2 marks): Another group of scientists said that it was not valid to use the results from tank 2 and tank 3 to make a conclusion about the effect of selection. Suggest why
- Summer 2023, Unit 3, Q6(a)(ii) (2 marks): I. On Image 6.1, label one of the arrows with an X to show a process which involves micro-organisms. II. Explain the role of micro-organisms in this process. [2
- Summer 2023, Unit 4, Q4(a)(i) (2 marks): State two conclusions that you could draw from the data in Graph 4.2A and Graph 4.2B. [2]
- Summer 2023, Unit 4, Q4(a)(ii) (1 mark): State the modes for the two sets of data. [1] Sheltered rocky shore mode = Exposed rocky shore mode = Two groups of A level students carried out the same type o
- Summer 2023, Unit 4, Q4(b)(i) (1 mark): State the null hypothesis for this experiment. [1]
- Summer 2023, Unit 4, Q4(b)(ii) (1 mark): State the degrees of freedom which should be used. [1] Table 4.4 shows the critical values for a two-tailed test. Table 4.4 Probability Degrees of 0.1 0.05 0.01
- Summer 2023, Unit 4, Q4(b)(iii) (3 marks): Use Table 4.4 to determine whether you would accept or reject the null hypothesis. Explain how you have come to this conclusion. [3]
- Summer 2023, Unit 4, Q4(c) (3 marks): Suggest one density-independent and two density-dependent factors which could account for the difference in shell length. [3] Density-independent factor Density
- Summer 2022, Unit 3, Q2(b)(i) (1 mark): Give the full name of the biological process involved in forest regeneration. [1]
- Summer 2022, Unit 3, Q2(b)(ii) (3 marks): Using relevant technical terms, describe and explain the process of forest regeneration. [3]
- Summer 2019, Unit 3, Q2(a)(i) (1 mark): Give one reason why not all of the solar energy falling on the producers is used to form biomass. [1]
- Summer 2019, Unit 3, Q2(a)(ii) (2 marks): Using the information given in the diagram, calculate the percentage of energy from the Sun that is fixed by photosynthesis. [2] Percentage of energy = %
- Summer 2019, Unit 3, Q5(a)(i) (2 marks): State the type of competition occurring in this area and what the mature adults could be competing for. [2]
- Summer 2019, Unit 3, Q5(a)(ii) (1 mark): Scientists removed Chthamalus from the upper area continually for several weeks and observed that Semibalanus did not colonise this area. Suggest a possible exp
- Summer 2019, Unit 3, Q5(a)(iii) (2 marks): Scientists then removed Semibalanus from the lower area continually for several weeks and observed that Chthamalus were found in this cleared area. Give an expl
- Summer 2019, Unit 3, Q5(b)(i) (4 marks): Describe the method by which reliable data would have been collected. [4]
- Summer 2018, Unit 3, Q3(a)(i) (4 marks): The main source of carbon for these leaves is from the air inside the pod, not the atmosphere. Describe how carbon inside the pod is made available for use by t
- Summer 2018, Unit 3, Q3(a)(ii) (3 marks): Describe how nitrogen is made available for use by these leaves. [3]
- Summer 2018, Unit 3, Q5(a) (2 marks): Explain why the dry mass was lower in Area 2 [2]
- Summer 2018, Unit 3, Q5(b) (2 marks): Using the information from Areas 1 and 3, calculate the net primary productivity of the grassland. Give your answer to 2 decimal places. [2] Net primary product
- Summer 2018, Unit 3, Q5(c) (2 marks): Suggest why this method cannot be used to calculate the net primary productivity of tropical rainforest. [2]
- Summer 2018, Unit 3, Q5(d) (2 marks): To find the dry mass the ecologists dried the grass samples in an oven at 65 °C. Describe how the ecologists would be confident that all the water had been remo
- Summer 2018, Unit 3, Q8 (9 marks): The photograph below shows a group of young male cheetahs eating a wildebeest. A team of scientists from the Mara Cheetah Project estimated that the adult popul
- Summer 2018, Unit 4, Q2(d)(i) (2 marks): Another species of grass, common bent (Agrostis tenuis), is also copper tolerant and is found growing in polluted mine sites together with sweet vernal grass. T
- Summer 2018, Unit 4, Q2(d)(ii) (1 mark): State and explain whether high copper concentrations act in a density dependent or density independent way. [1]
- Summer 2018, Unit 4, Q7(b)(v) (1 mark): Explain why a standard deviation is used for the BMD scan. [1]
- Summer 2017, Unit 3, Q6(a)(i) (3 marks): Describe how and explain why the sites are selected at random. [3] The table below shows the mean number of each species in a 1m2 area after five years. Mean nu
- Summer 2017, Unit 3, Q6(a)(ii) (3 marks): In the first year the scientists only found four different species in the area. Identify the type of succession that has taken place in the five years of the st
- Summer 2017, Unit 3, Q6(a)(iii) (2 marks): Suggest what would happen to the number of animal species in this area. Explain your answer. [2]
- Summer 2017, Unit 3, Q6(b)(i) (3 marks): Explain why they are able to survive in soils with low nitrogen levels. [3]
- Summer 2017, Unit 3, Q6(b)(ii) (3 marks): Rhizobium contain the enzyme nitrogenase which is responsible for fixing atmospheric nitrogen. This enzyme is inhibited if oxygen levels are high. The root nodu
- Summer 2017, Unit 3, Q6(c)(i) (1 mark): Explain why bog is described as the climax community. [1]
- Summer 2017, Unit 3, Q6(c)(ii) (2 marks): Explain why trees are unable to survive in waterlogged soils. [2] The photograph shows a plant found on the bog called sundew (Drosera rotundifolia). This is an
- Summer 2017, Unit 3, Q6(d) (3 marks): Suggest why insectivorous plants such as sundew rely on catching prey. [3]
Questions, mark schemes and examiner’s reports are © WJEC CBAC Ltd, from their published past papers. Plumi isn’t affiliated with any exam board. Want whole papers? Every WJEC A-Level Biology paper.
Rather write your answers by hand on iPad? Plumi marks them against the same mark schemes.