 plumi
Rate equations: AQA A‑Level Chemistry questions
Every AQA A-Level Chemistry exam question on 3.1.9 Rate equations, 2016–2025, with its mark scheme and examiner’s report.
Find questions2,301
Calculations
Q09.3
The whole paper ↗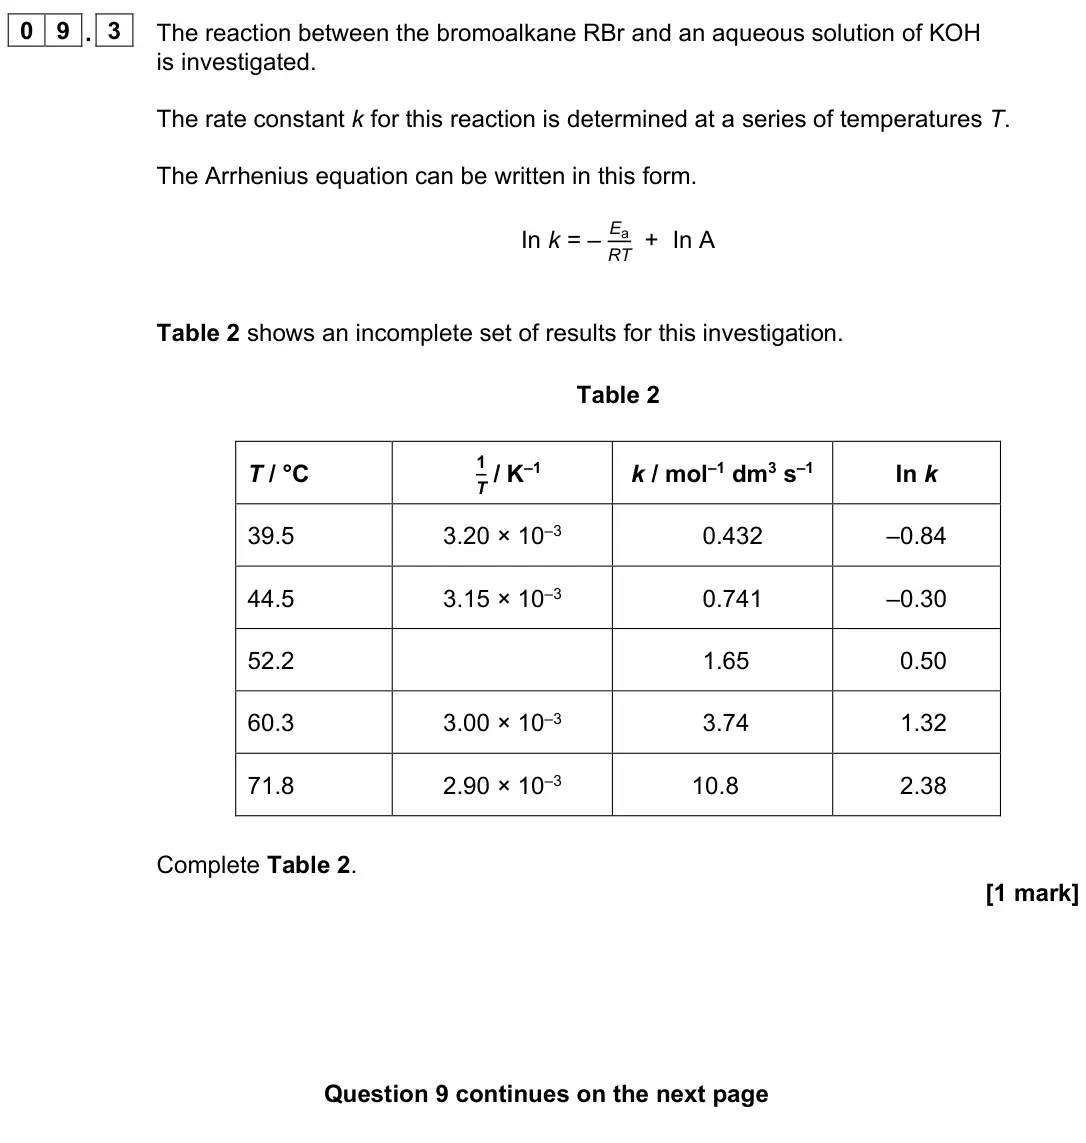
Q09.4
The whole paper ↗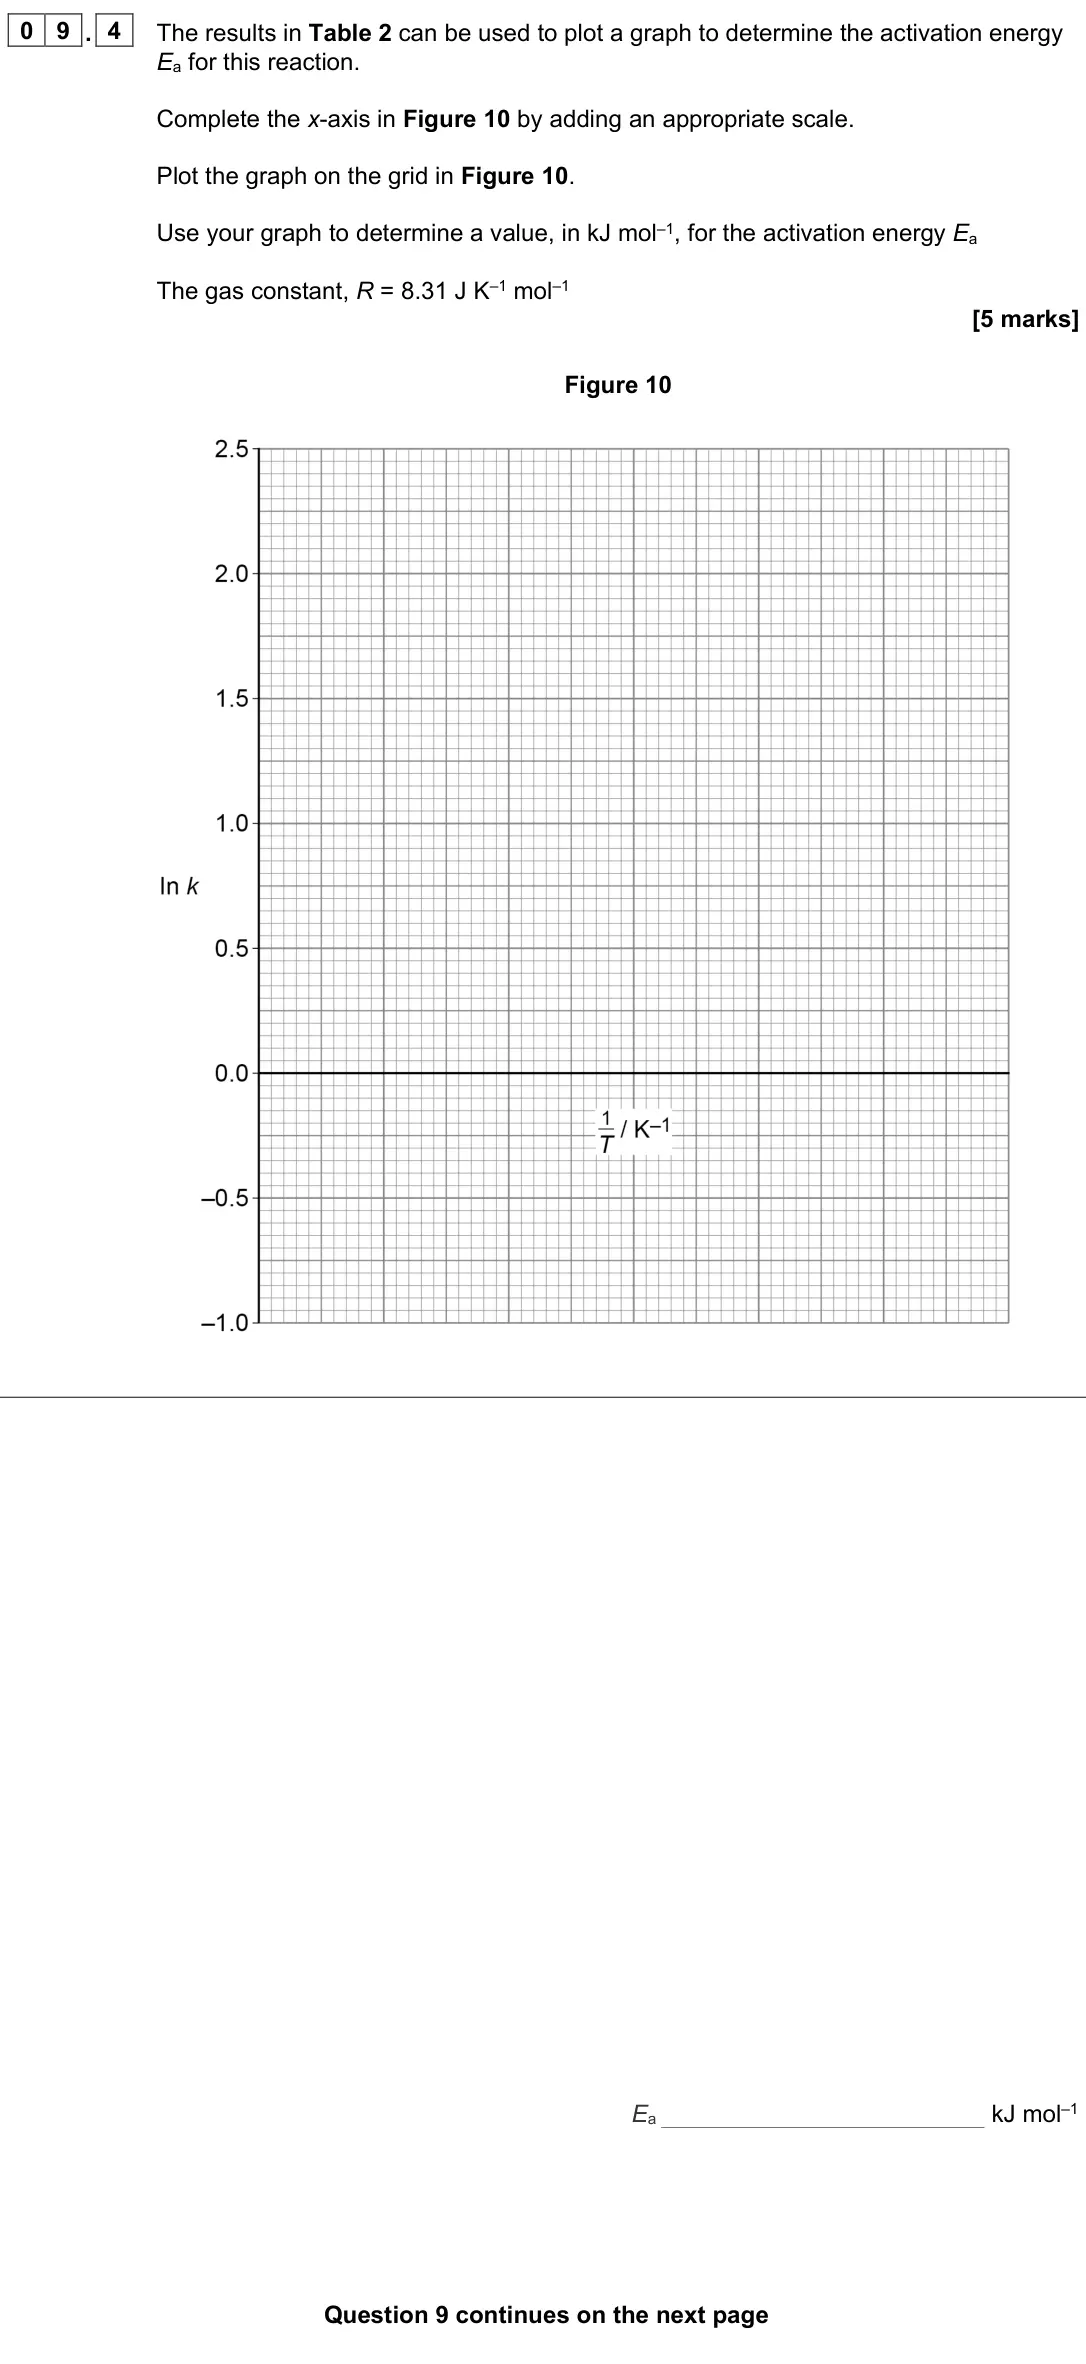
Q09.5
The whole paper ↗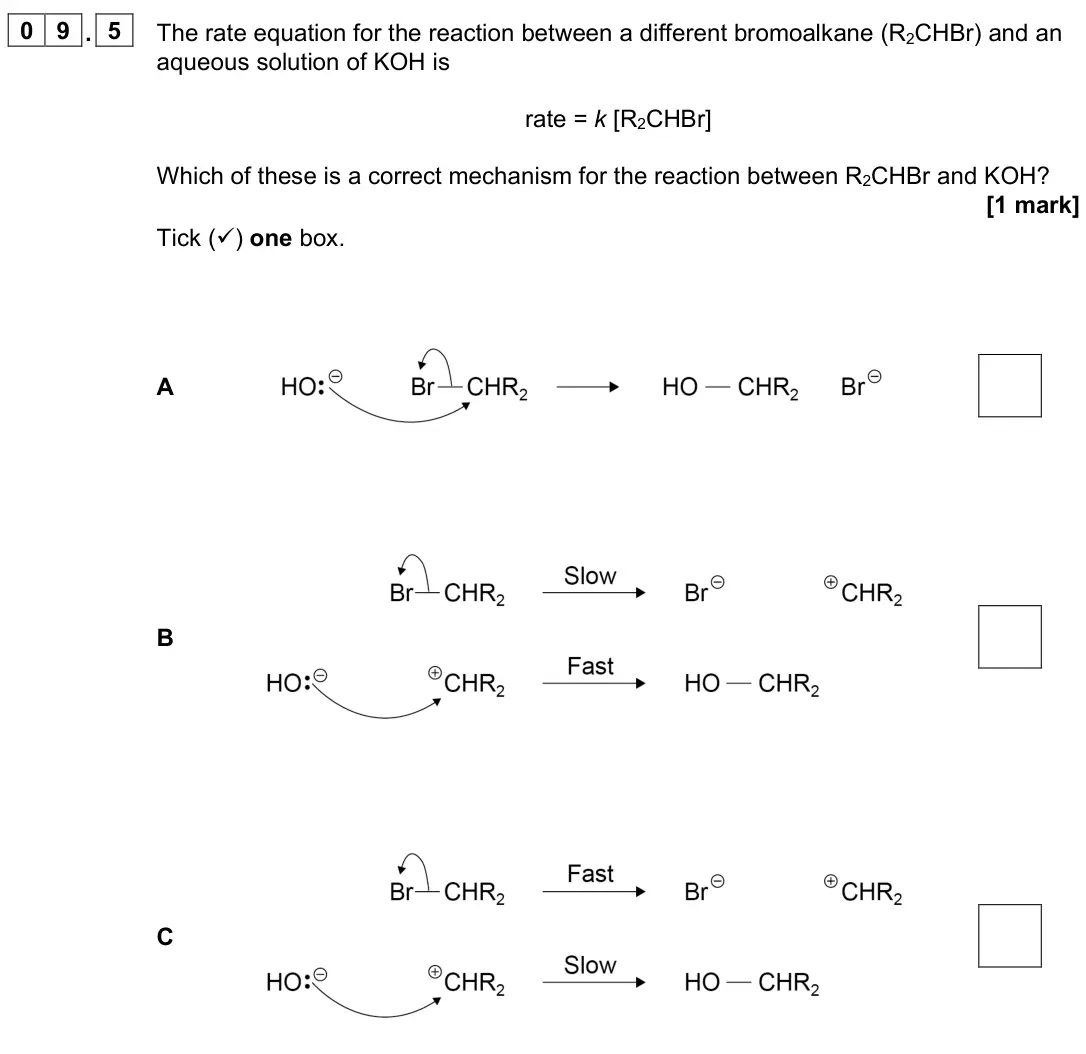
Q02.1
The whole paper ↗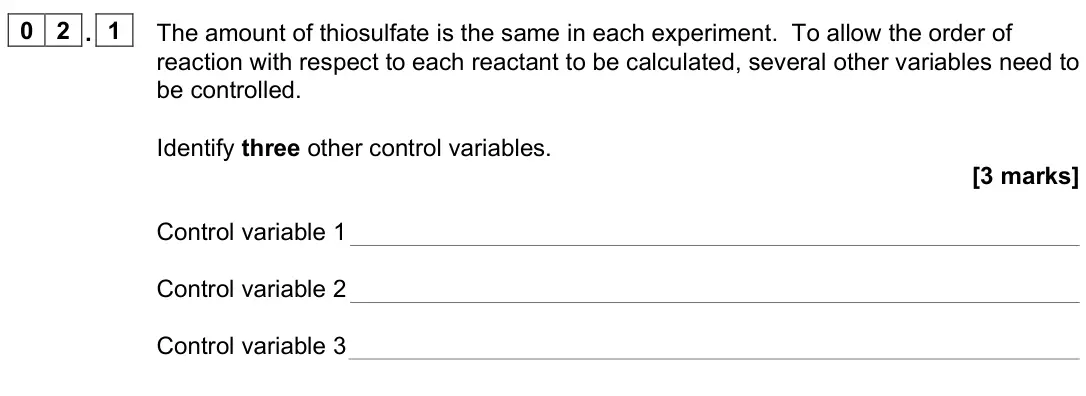
Q02.2
The whole paper ↗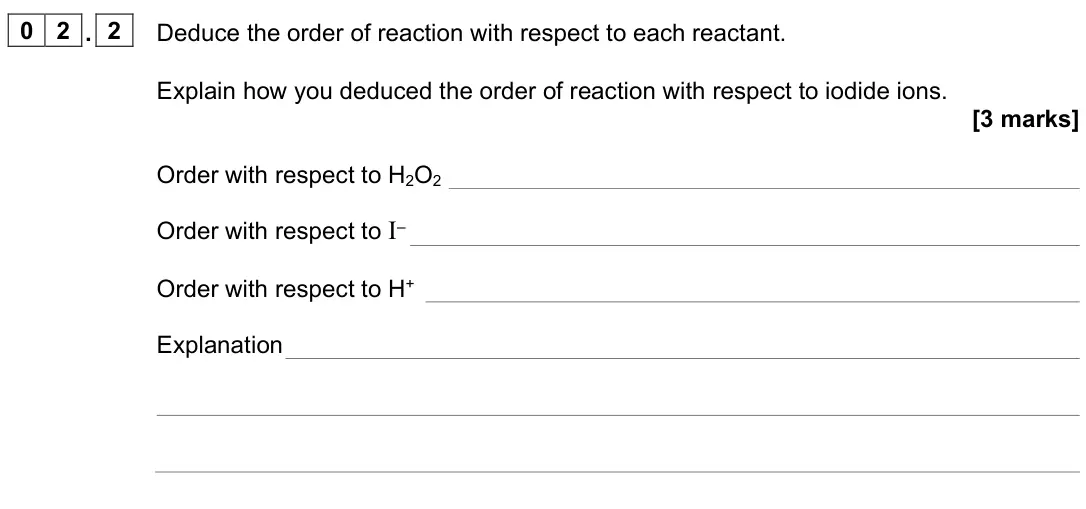
Q02.3
The whole paper ↗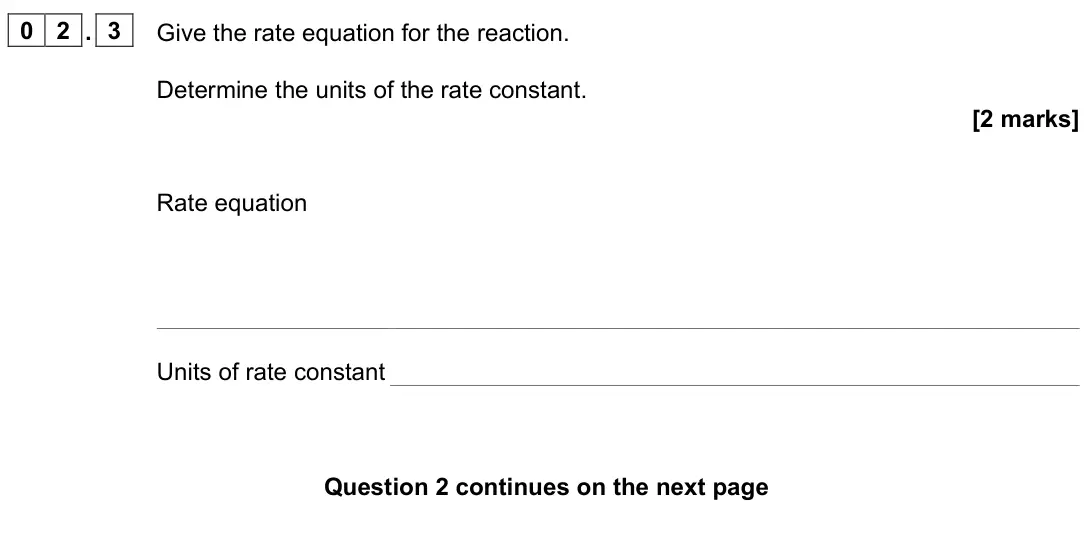
Q02.4
The whole paper ↗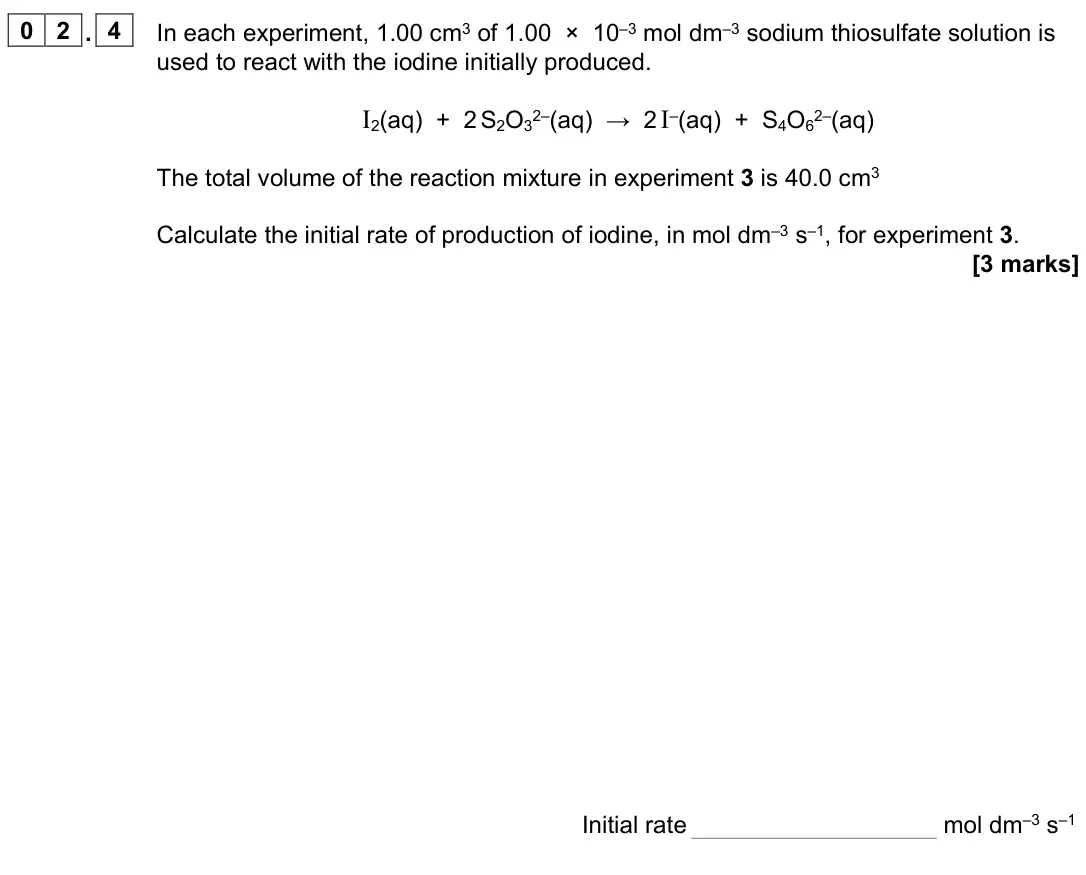
Q02.5
The whole paper ↗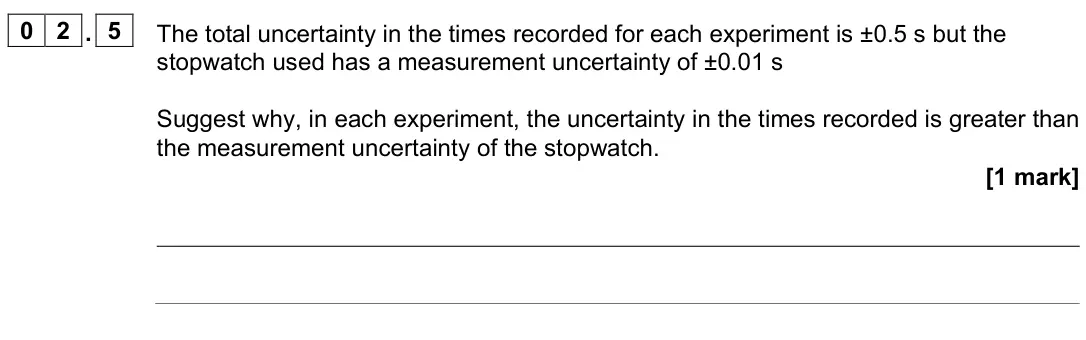
Q02.6
The whole paper ↗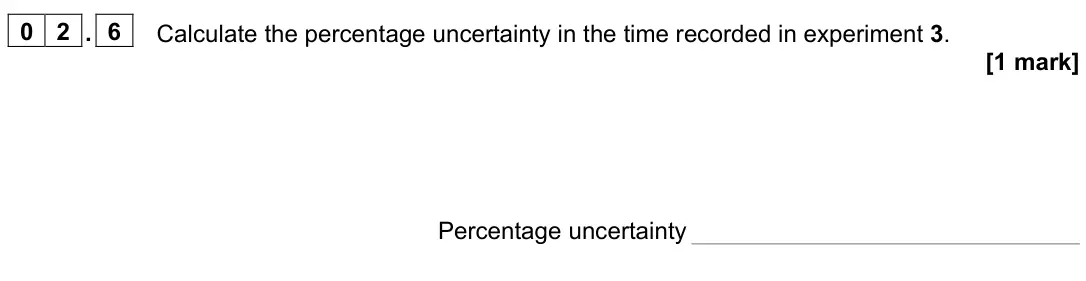
Q02.7
The whole paper ↗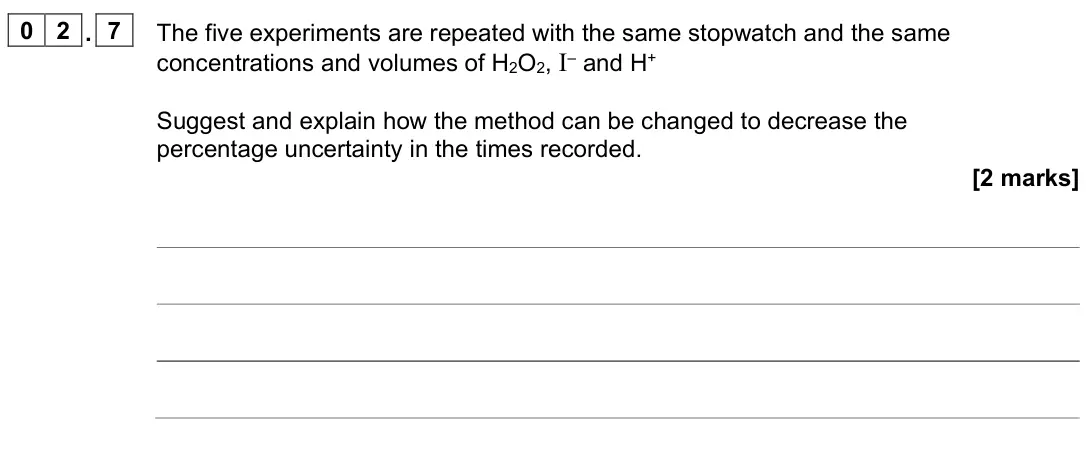
Q01.1
The whole paper ↗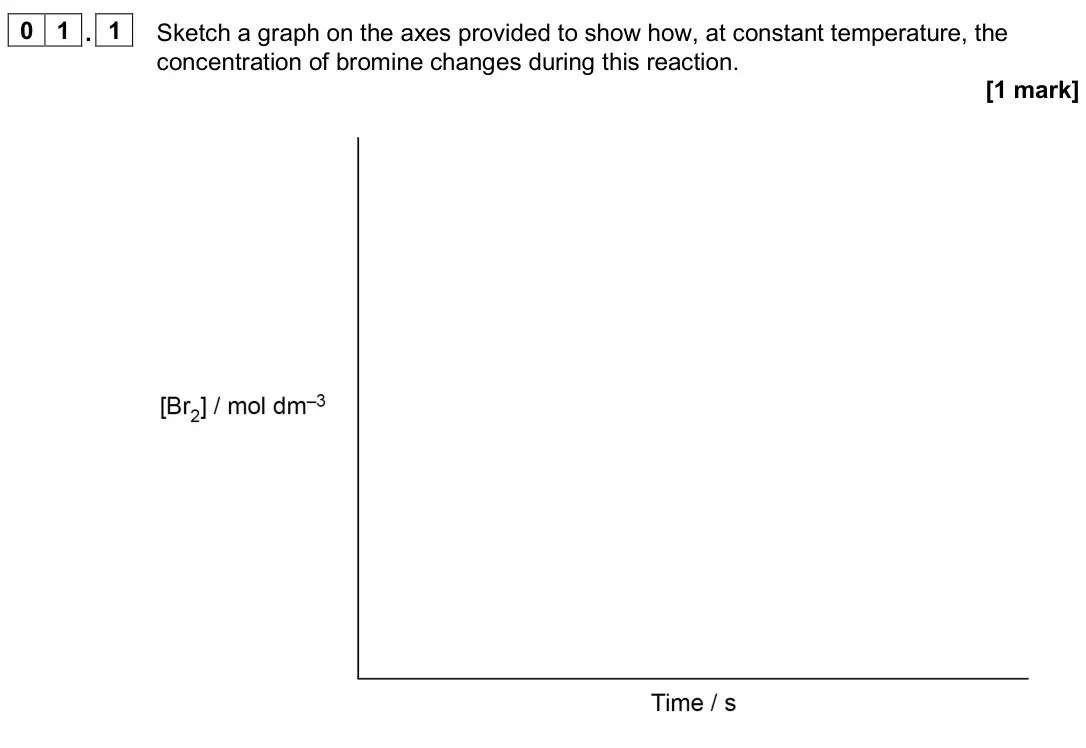
Q01.2
The whole paper ↗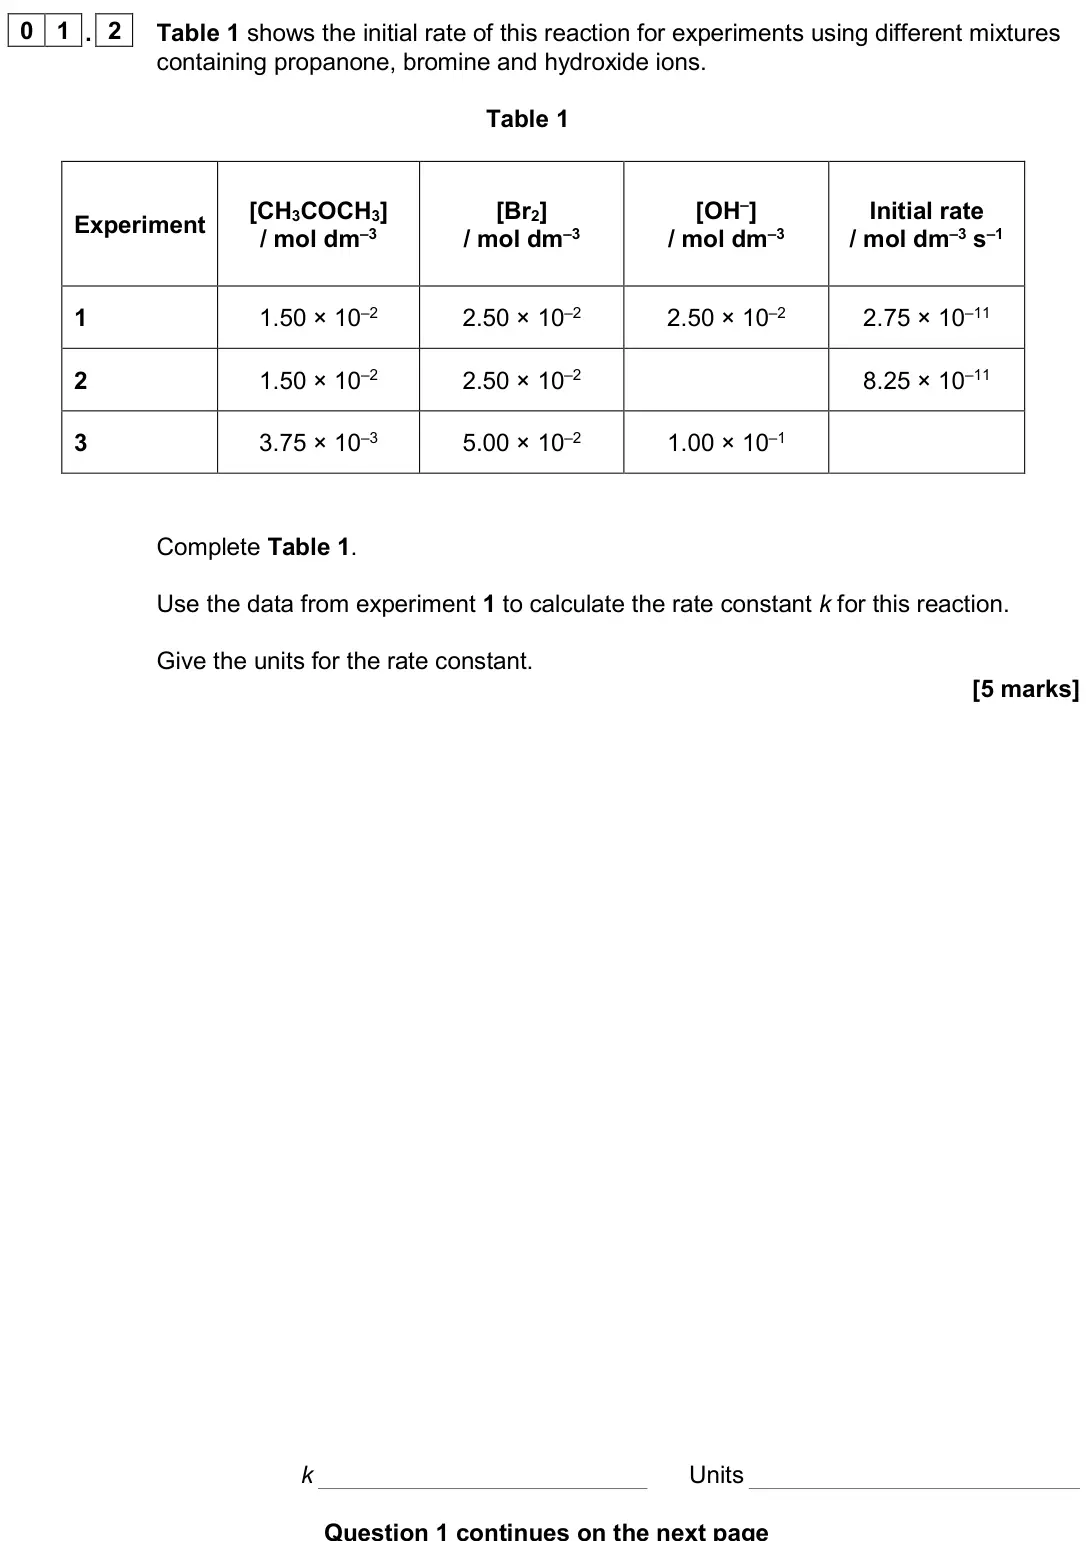
Q01.3
The whole paper ↗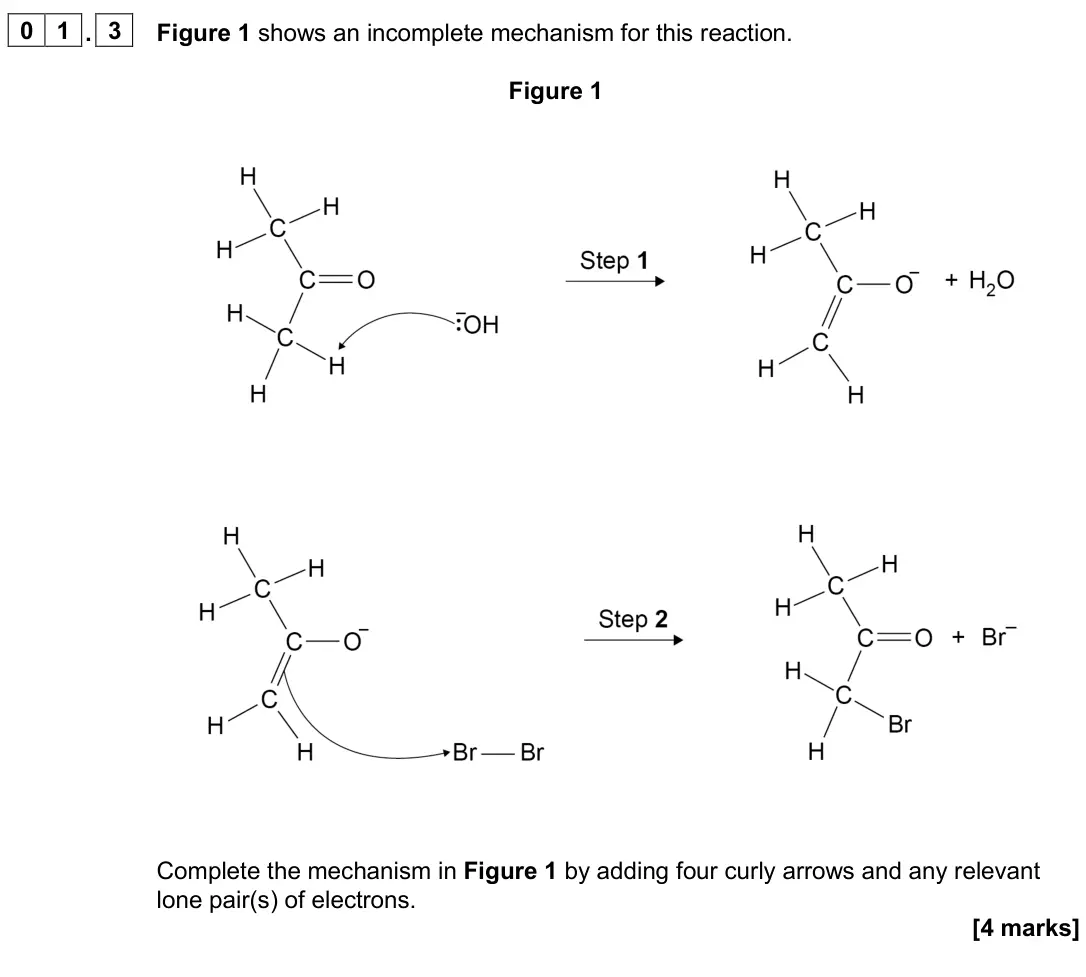
Q01.4
The whole paper ↗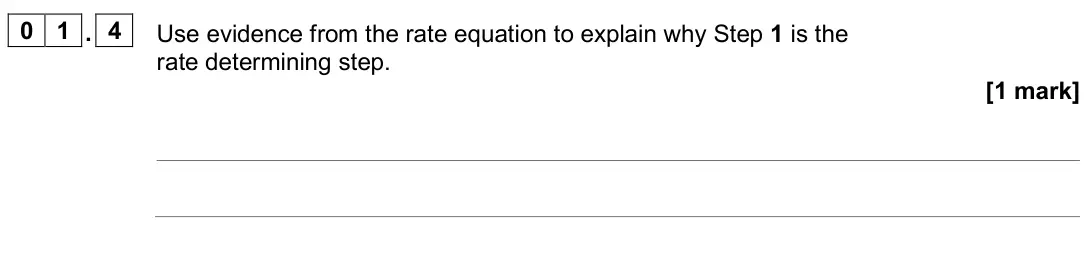
Q02.2
The whole paper ↗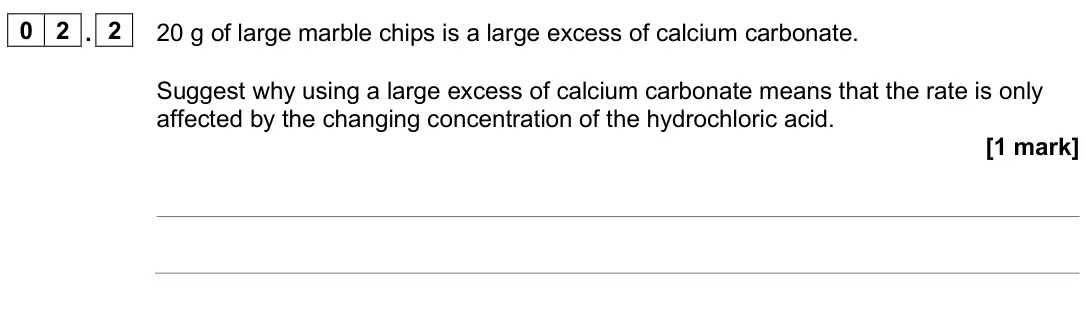
Q02.3
The whole paper ↗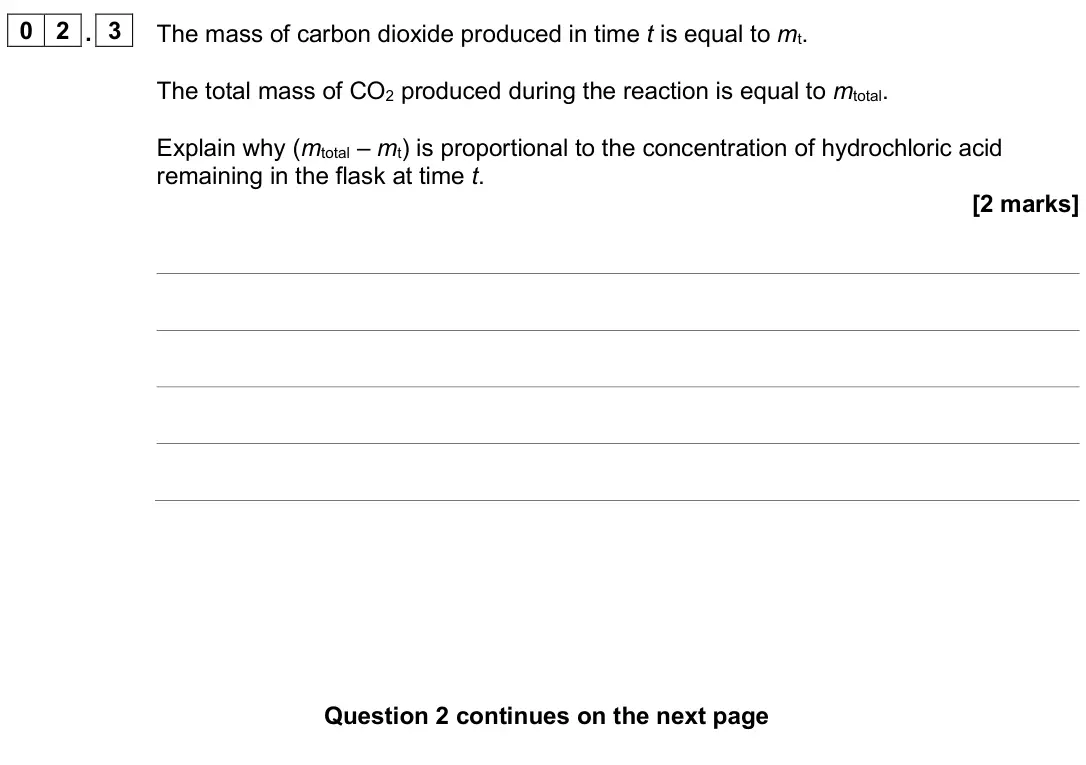
Q02.4
The whole paper ↗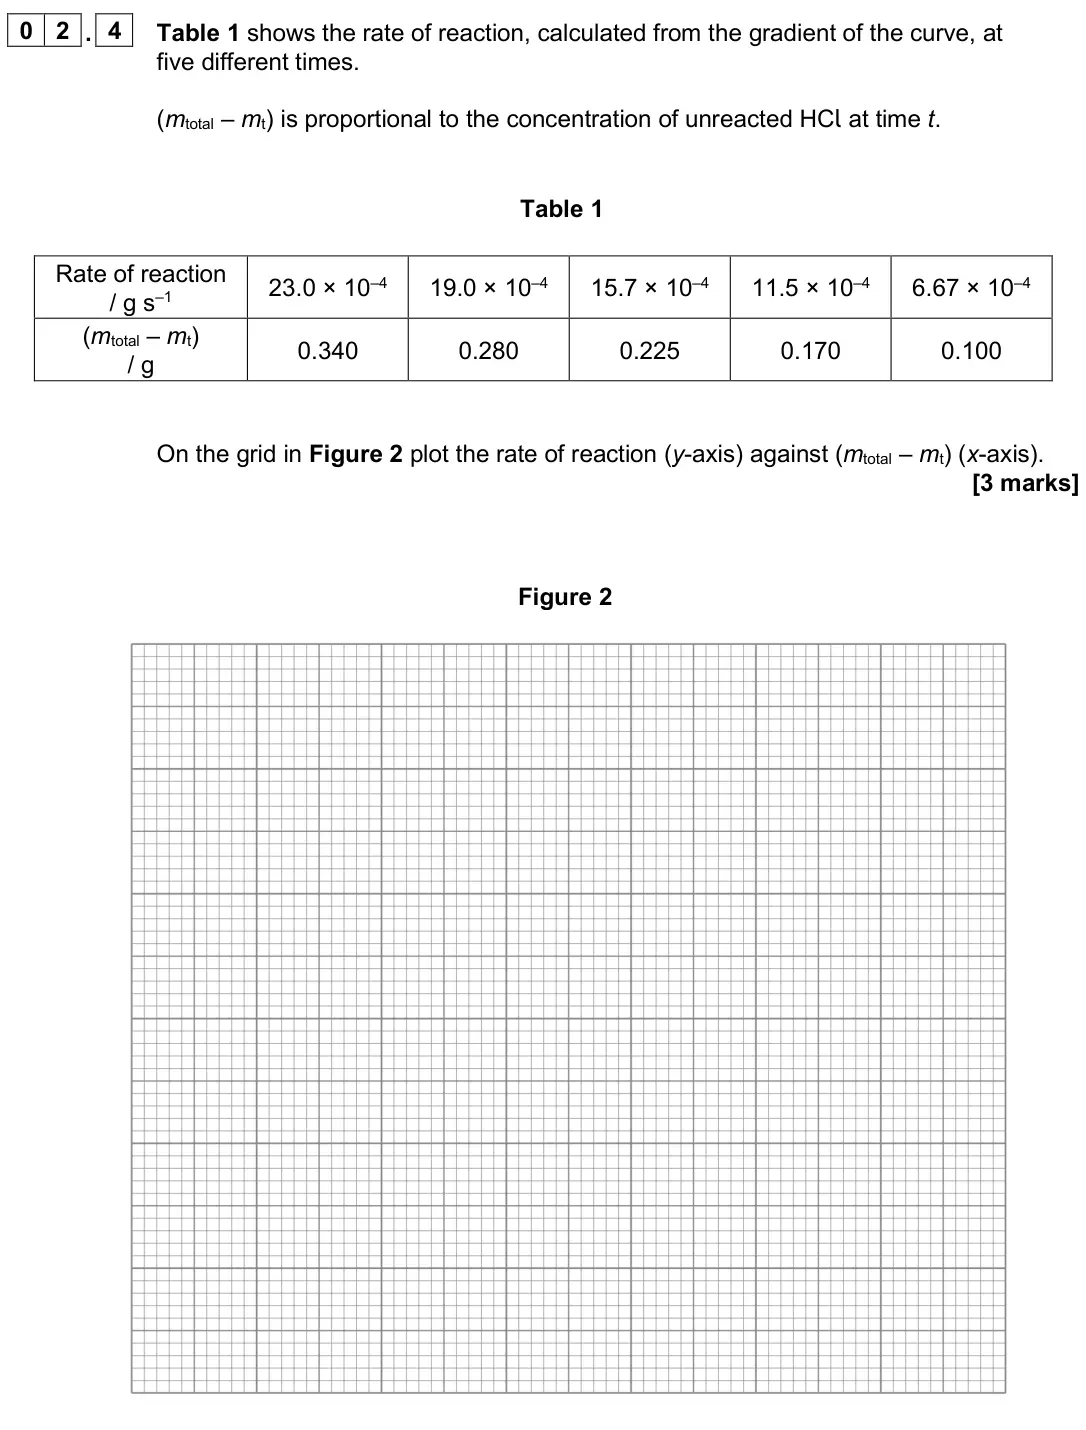
Q02.5
The whole paper ↗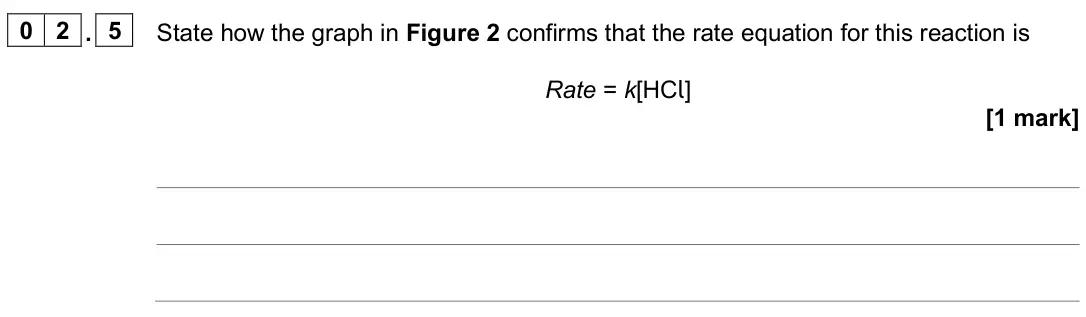
Q03.1
The whole paper ↗
Q03.2
The whole paper ↗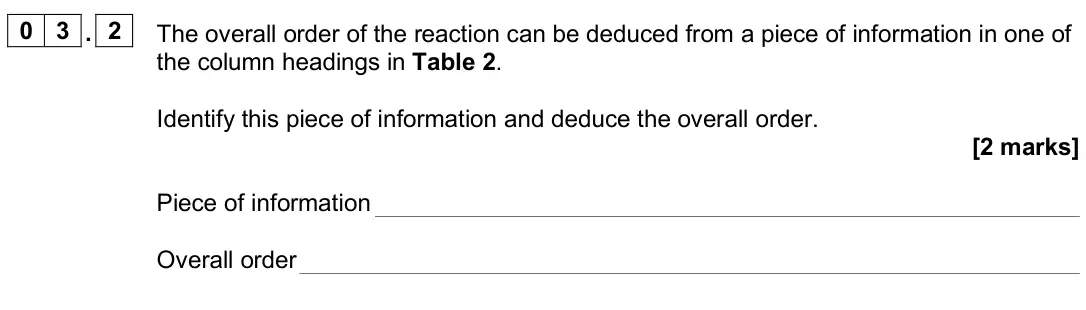
All 81 questions on Rate equations, as a list
- June 2025, Paper 2, Q09.3 (1 mark): The reaction between the bromoalkane RBr and an aqueous solution of KOH is investigated. The rate constant k for this reaction is determined at a series of temp
- June 2025, Paper 2, Q09.4 (5 marks): The results in Table 2 can be used to plot a graph to determine the activation energy Ea for this reaction. Complete the x-axis in Figure 10 by adding an approp
- June 2025, Paper 2, Q09.5 (1 mark): The rate equation for the reaction between a different bromoalkane (R2CHBr) and an aqueous solution of KOH is rate = k [R2CHBr] Which of these is a correct mech
- June 2025, Paper 3, Q02.1 (3 marks): The amount of thiosulfate is the same in each experiment. To allow the order of reaction with respect to each reactant to be calculated, several other variables
- June 2025, Paper 3, Q02.2 (3 marks): Deduce the order of reaction with respect to each reactant. Explain how you deduced the order of reaction with respect to iodide ions. [3 marks] Order with resp
- June 2025, Paper 3, Q02.3 (2 marks): Give the rate equation for the reaction. Determine the units of the rate constant. [2 marks] Rate equation Units of rate constant
- June 2025, Paper 3, Q02.4 (3 marks): In each experiment, 1.00 cm3 of 1.00 × 10⁻³ mol dm–3 sodium thiosulfate solution is used to react with the iodine initially produced. I2(aq) + 2 S2O32–(aq) → 2
- June 2025, Paper 3, Q02.5 (1 mark): The total uncertainty in the times recorded for each experiment is ±0.5 s but the stopwatch used has a measurement uncertainty of ±0.01 s Suggest why, in each e
- June 2025, Paper 3, Q02.6 (1 mark): Calculate the percentage uncertainty in the time recorded in experiment 3. [1 mark] Percentage uncertainty
- June 2025, Paper 3, Q02.7 (2 marks): The five experiments are repeated with the same stopwatch and the same concentrations and volumes of H2O2, I– and H+ Suggest and explain how the method can be c
- June 2024, Paper 2, Q01.1 (1 mark): Sketch a graph on the axes provided to show how, at constant temperature, the concentration of bromine changes during this reaction. [1 mark]
- June 2024, Paper 2, Q01.2 (5 marks): Table 1 shows the initial rate of this reaction for experiments using different mixtures containing propanone, bromine and hydroxide ions. Table 1 Experiment [C
- June 2024, Paper 2, Q01.3 (4 marks): Figure 1 shows an incomplete mechanism for this reaction. Figure 1 Complete the mechanism in Figure 1 by adding four curly arrows and any relevant lone pair(s)
- June 2024, Paper 2, Q01.4 (1 mark): Use evidence from the rate equation to explain why Step 1 is the rate determining step. [1 mark]
- June 2024, Paper 3, Q02.2 (1 mark): 20 g of large marble chips is a large excess of calcium carbonate. Suggest why using a large excess of calcium carbonate means that the rate is only affected by
- June 2024, Paper 3, Q02.3 (2 marks): The mass of carbon dioxide produced in time t is equal to mt. The total mass of CO2 produced during the reaction is equal to mtotal. Explain why (mtotal – mt) i
- June 2024, Paper 3, Q02.4 (3 marks): Table 1 shows the rate of reaction, calculated from the gradient of the curve, at five different times. (mtotal – mt) is proportional to the concentration of un
- June 2024, Paper 3, Q02.5 (1 mark): State how the graph in Figure 2 confirms that the rate equation for this reaction is Rate = k[HCl] [1 mark]
- June 2024, Paper 3, Q03.1 (1 mark): Complete Table 2 with the missing values at 573 K [1 mark]
- June 2024, Paper 3, Q03.2 (2 marks): The overall order of the reaction can be deduced from a piece of information in one of the column headings in Table 2. Identify this piece of information and de
- June 2024, Paper 3, Q03.3 (2 marks): The Arrhenius equation can be written in the form shown. In k = In A – Ea RT On the grid in Figure 3 plot a graph of ln k against 1 T [2 marks] Figure 3
- June 2024, Paper 3, Q03.4 (3 marks): Use your graph from Question 03.3 to calculate a value for Ea, in kJ mol–1, for the thermal decomposition of but-3-en-1-ol. The gas constant, R = 8.31 J K–1 mol
- June 2023, Paper 2, Q02.1 (3 marks): Complete Table 1 by calculating the missing values. [3 marks]
- June 2023, Paper 2, Q02.2 (2 marks): A suggested mechanism for the reaction is shown. Step 1 B + H+ → BH+ Step 2 BH+ + B → B2H+ Step 3 B2H+ + A → C + D Deduce the rate-determining step for this rea
- June 2023, Paper 2, Q09.3 (3 marks): For a chemical reaction the relationship between the rate constant, k, and the temperature, T, is shown by the Arrhenius equation. k = Ae −Ea RT For the decompo
- June 2022, Paper 2, Q01.2 (3 marks): The rate equation for the reaction is rate = k[CH3CH2COCH3][H+] Table 1 shows the initial concentrations used in an experiment. Table 1 CH3CH2COCH3 I2 H+ Initia
- June 2022, Paper 2, Q01.3 (1 mark): Calculate the initial rate of reaction when all of the initial concentrations are halved. [1 mark] Initial rate of reaction mol dm−3 s−1
- June 2022, Paper 2, Q01.4 (1 mark): An experiment was done to measure the time, t, taken for a solution of iodine to react completely when added to an excess of an acidified solution of butanone.
- June 2022, Paper 2, Q01.7 (5 marks): For a different reaction, Table 2 shows the value of the rate constant at different temperatures. Table 2 Experiment Temperature / K Rate constant / s−1 1 T1 =
- June 2022, Paper 3, Q04.2 (2 marks): The graph in Figure 1 shows how the concentration of hydrogen peroxide changes with time in this experiment. Figure 1 Tangents to the curve in Figure 1 can be u
- June 2022, Paper 3, Q04.3 (2 marks): The concentration of hydrogen peroxide solution at time t during the experiment can be calculated using this expression. [ ] [ ] max 2 2 2 2 initial max H O H O
- June 2022, Paper 3, Q04.4 (2 marks): Plot the data from Table 5 on the grid in Figure 2. Draw a line of best fit. [2 marks] Figure 2
- June 2022, Paper 3, Q04.5 (2 marks): Use Figure 2 to determine the order of reaction with respect to H2O2 State how the graph shows this order. [2 marks] Order How the graph shows this order
- November 2021, Paper 2, Q10.1 (2 marks): Suggest why the 1.0 cm3 portions of the reaction mixture are added to an excess of NaHCO3 solution. [2 marks]
- November 2021, Paper 2, Q10.2 (2 marks): Suggest why the order of this reaction with respect to propanone can be ignored in this experiment. [2 marks]
- November 2021, Paper 2, Q10.3 (3 marks): Use the results in Table 5 to draw a graph of volume of sodium thiosulfate solution against time. Draw a line of best fit. [3 marks]
- November 2021, Paper 2, Q10.4 (2 marks): Explain how the graph shows that the reaction is zero-order with respect to iodine in the reaction between propanone and iodine. [2 marks]
- November 2021, Paper 2, Q10.5 (3 marks): The Arrhenius equation can be written as In k = −Ea RT + In A Figure 8 shows a graph of ln k against 1 T for the reaction 2 HI(g) → H2(g) + I2(g) Figure 8 Use F
- November 2020, Paper 2, Q01.1 (3 marks): Use the graph in Figure 1 to determine the initial rate of reaction for this experiment. State its units. Show your working on the graph. [3 marks] Rate Units
- November 2020, Paper 2, Q01.2 (2 marks): Another student reacted different initial concentrations of phosphinate ions with an excess of hydroxide ions. The student measured the time (t) taken to collec
- November 2020, Paper 2, Q01.3 (1 mark): Complete the diagram in Figure 2 to show how the hydrogen gas could be collected and measured in the experiments in Questions 01.1 and 01.2. [1 mark] Figure 2 T
- November 2020, Paper 2, Q01.4 (1 mark): Deduce the overall effect on the rate of reaction when the concentrations of both L and M are halved. [1 mark]
- November 2020, Paper 2, Q01.5 (3 marks): The rate of reaction is 0.0250 mol dm–3 s–1 when the concentration of L is 0.0155 mol dm–3 Calculate the concentration of M if the rate constant is 21.3 mol–2 d
- November 2020, Paper 2, Q01.6 (1 mark): Define the term overall order of reaction. [1 mark]
- November 2020, Paper 3, Q04.4 (3 marks): During the experiment the concentration of cisplatin is measured at one-minute intervals. Explain how graphical methods can be used to process the measured resu
- November 2020, Paper 3, Q04.5 (2 marks): Complete Table 1. [2 marks]
- November 2020, Paper 3, Q04.6 (5 marks): The Arrhenius equation can be written in the form In k = –Ea RT + In A Use the data in Table 1 to plot a graph of ln k against 1 T on the grid in Figure 2. Calc
- November 2020, Paper 3, Q12 (1 mark): The rate expression for the reaction between X and Y is rate = k [X]2 [Y] Which statement is correct? [1 mark] A The rate constant has units mol−1 dm3 s−1 B The
- November 2020, Paper 3, Q33 (1 mark): What are the units of the rate constant for a third order reaction? [1 mark] A mol dm–3 s–1 B mol–1 dm3 s–1 C mol2 dm–6 s–1 D mol–2 dm6 s–1
- June 2019, Paper 2, Q04.1 (1 mark): Complete Table 2 to show the initial rate of reaction of P in each experiment. [1 mark] Table 2 Experiment Initial rate / mol dm 3 s 1 1 1.6 × 10⁻⁴ 2 3
- June 2019, Paper 2, Q04.2 (2 marks): Determine the order of reaction with respect to P and the order of reaction with respect to Q. [2 marks] Order with respect to P Order with respect to Q
- June 2019, Paper 2, Q04.3 (3 marks): A reaction between substances R and S was second order with respect to R and second order with respect to S. At a given temperature, the initial rate of reactio
- June 2019, Paper 2, Q05 (4 marks): The rate constant, k, for a reaction varies with temperature as shown by the equation k = Ae–EaIRT For this reaction, at 25 °C, k = 3.46 × 10⁻⁸ s−1 The activati
- June 2019, Paper 3, Q10 (1 mark): The results of an investigation of the reaction between P and Q are shown in this table. Experiment Initial [P] / mol dm–3 Initial [Q] / mol dm–3 Initial rate /
- June 2018, Paper 2, Q05.1 (3 marks): A series of experiments was carried out at a given temperature. The results were used to deduce the rate equation for the reaction. rate = k [BrO3 −][Br −][H+]2
- June 2018, Paper 2, Q05.2 (3 marks): Complete Table 2. [3 marks] Space for working
- June 2018, Paper 2, Q05.3 (2 marks): A second series of experiments was carried out to investigate how the rate of the reaction varies with temperature. The results were used to obtain a value for
- June 2018, Paper 2, Q05.4 (6 marks): The Arrhenius equation can be written as In this experiment, the rate constant, k, is directly proportional to t 1 Therefore where C1 and C2 are constants. Use
- June 2018, Paper 3, Q01.1 (2 marks): Explain why the use of a large excess of H2O2 and I– means that the rate of reaction at a fixed temperature depends only on the concentration of H+(aq). [2 mark
- June 2018, Paper 3, Q01.2 (2 marks): Samples of the reaction mixture are removed at timed intervals and titrated with alkali to determine the concentration of H+(aq). State and explain what must be
- June 2018, Paper 3, Q01.3 (2 marks): A graph of the results is shown in Figure 1. Figure 1 Explain how the graph shows that the order with respect to H+(aq) is zero. [2 marks]
- June 2018, Paper 3, Q01.4 (3 marks): Use the graph in Figure 1 to calculate the value of k1 Give the units of k1 [3 marks] k1 Units
- June 2018, Paper 3, Q01.5 (1 mark): A second reaction mixture is made at the same temperature. The initial concentrations of H+(aq) and I–(aq) in this mixture are both 0.500 mol dm–3 There is a la
- June 2018, Paper 3, Q01.6 (1 mark): Draw a line of best fit on the grid in Figure 2. [1 mark]
- June 2018, Paper 3, Q01.7 (2 marks): Calculate the rate of reaction when [H+] = 0.35 mol dm–3 Show your working using a suitable construction on the graph in Figure 2. [2 marks] Rate mol dm–3 s–1
- June 2018, Paper 3, Q01.8 (6 marks): A general equation for a reaction is shown. A(aq) + B(aq) + C(aq) → D(aq) + E(aq) In aqueous solution, A, B, C and D are all colourless but E is dark blue. A re
- June 2018, Paper 3, Q12 (1 mark): Solutions of two compounds, W and X, react together in the presence of a soluble catalyst, Y, as shown in the equation 2W + X → Z When the concentrations of W,
- June 2018, Paper 3, Q13 (1 mark): A series of experiments was carried out to find the order of reaction with respect to reactant X. In these experiments, only the concentration of X was changed.
- June 2017, Paper 2, Q02.1 (1 mark): Draw a tangent to the curve at t = 0 [1 mark
- June 2017, Paper 2, Q02.2 (1 mark): Use this tangent to deduce the initial rate of the reaction. [1 mark Initial rate mol dm−3s−1
- June 2017, Paper 2, Q02.3 (2 marks): The experiment was repeated at the same temperature and with the same initial concentration of B but with a different initial concentration of A. The new initia
- June 2017, Paper 2, Q03.1 (3 marks): Calculate a value for the rate constant at this temperature and give its units. [3 marks Rate constant Units
- June 2017, Paper 2, Q03.2 (4 marks): An equation that relates the rate constant, k, to the activation energy, Ea, and the temperature, T, is ln k = RT Ea − + ln A Use this equation and your answer
- June 2017, Paper 3, Q27 (1 mark): The rate equation for the acid-catalysed reaction between iodine and propanone is: rate = k [H+] [C3H6O] The rate of reaction was measured for a mixture of iodi
- Specimen, Paper 2, Q01.1 (3 marks): 3
- Specimen, Paper 2, Q01.2 (3 marks): k = Units =
- Specimen, Paper 2, Q01.3 (1 mark): Initial rate = mol dm–3 s–1
- Specimen, Paper 2, Q01.5 (2 marks): Activation energy = 5 6 2 Butadiene dimerises according to the equation 2C4H6 C8H12 The kinetics of the dimerisation are studied and the graph of the concentrat
- Specimen, Paper 2, Q02.1 (1 mark): Draw a tangent to the curve when the concentration of butadiene is 0.0120 mol dm–3. [1 mark] 0 2 . 1
- Specimen, Paper 2, Q02.2 (5 marks): 8
- Specimen, Paper 3, Q10: The rate equation for the hydrogenation of ethene C2H4(g) + H2(g) C2H6(g) is Rate = k[C2H4][H2] At a fixed temperature, the reaction mixture is compressed to tr
Questions, mark schemes and examiner’s reports are © AQA, from their published past papers. Plumi isn’t affiliated with any exam board. Want whole papers? Every AQA A-Level Chemistry paper.
Rather write your answers by hand on iPad? Plumi marks them against the same mark schemes.