 plumi
Calculating uncertainties: OCR A‑Level Physics B questions
OCR A-Level Physics B past-paper questions on 2.0.8 Calculating uncertainties, 2016–2025, with mark schemes and examiner’s reports where available.
Paper
All papers
Exam
All years
Calculations
- Your answer
Q36(b)
The whole paper ↗Q1(a)(i)
The whole paper ↗
Q1(a)(ii)
The whole paper ↗Q2(a)(ii)
The whole paper ↗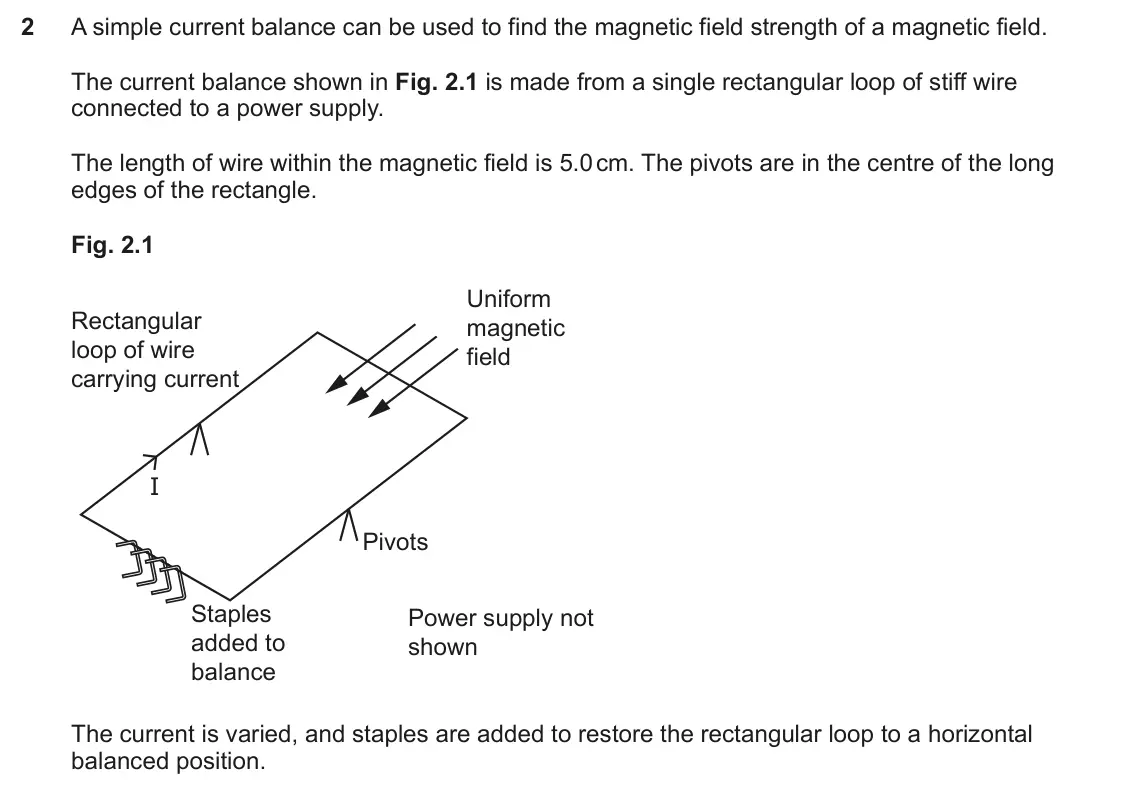
Q2(b)
The whole paper ↗Q4(b)
The whole paper ↗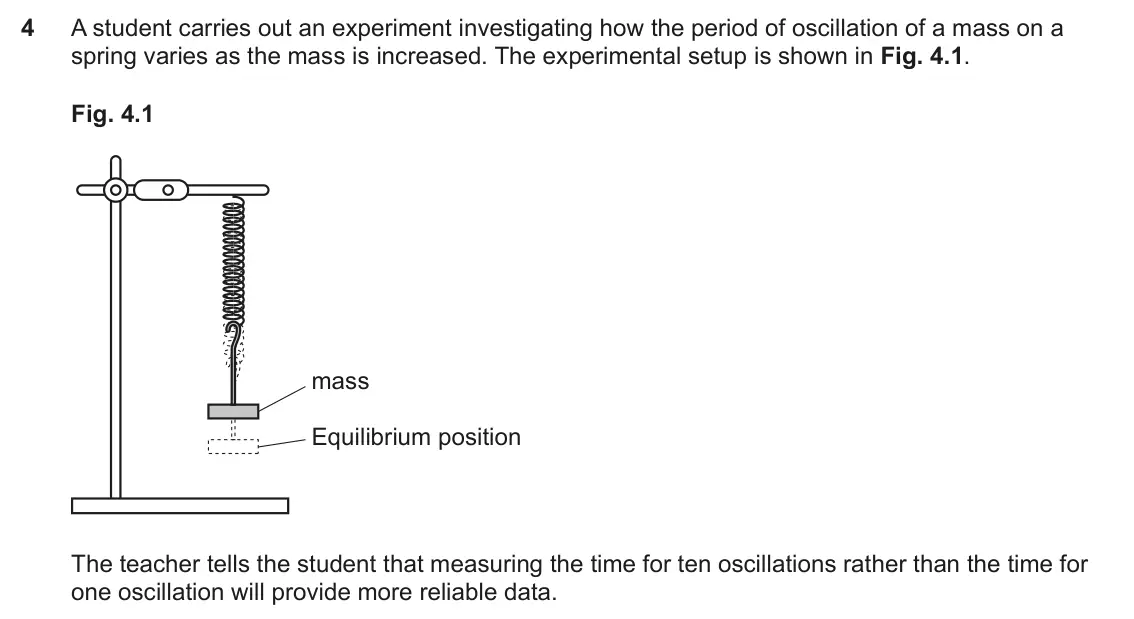
Q4(c)(ii)
The whole paper ↗Q25(c)(ii)
The whole paper ↗
Q25(d)
The whole paper ↗Q5(a)
The whole paper ↗- Your answer
Q38(b)(i)
The whole paper ↗Q2(c)
The whole paper ↗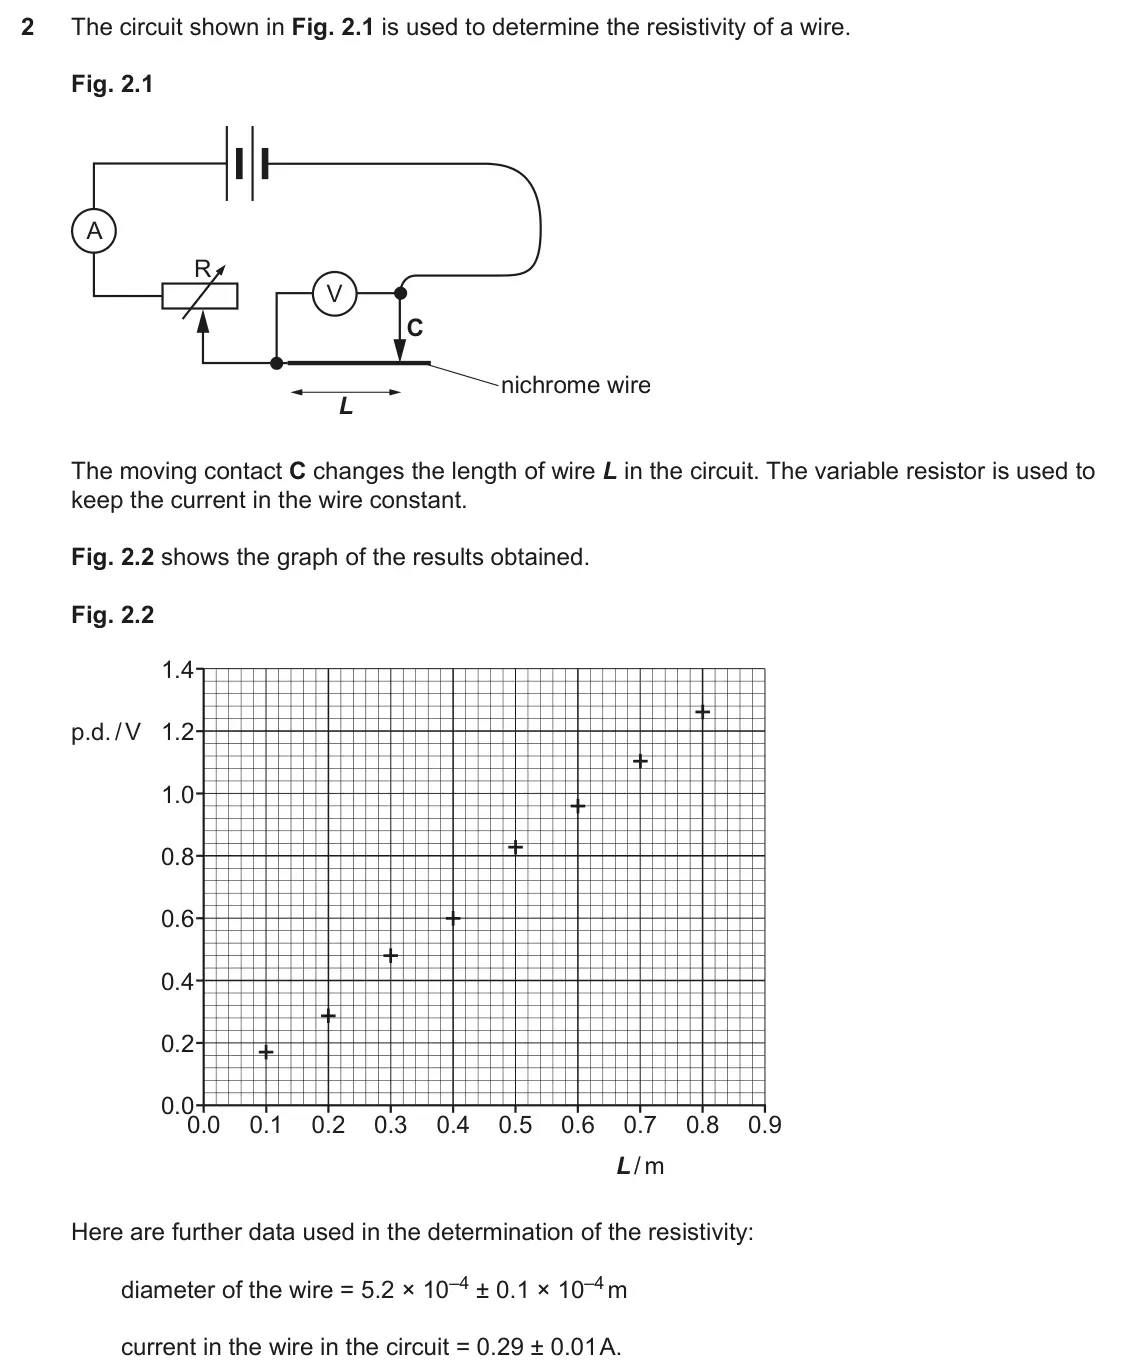
Q1(b)(ii)
The whole paper ↗
Q1(b)(iii)
The whole paper ↗Q1(c)(ii)
The whole paper ↗Q2(a)
The whole paper ↗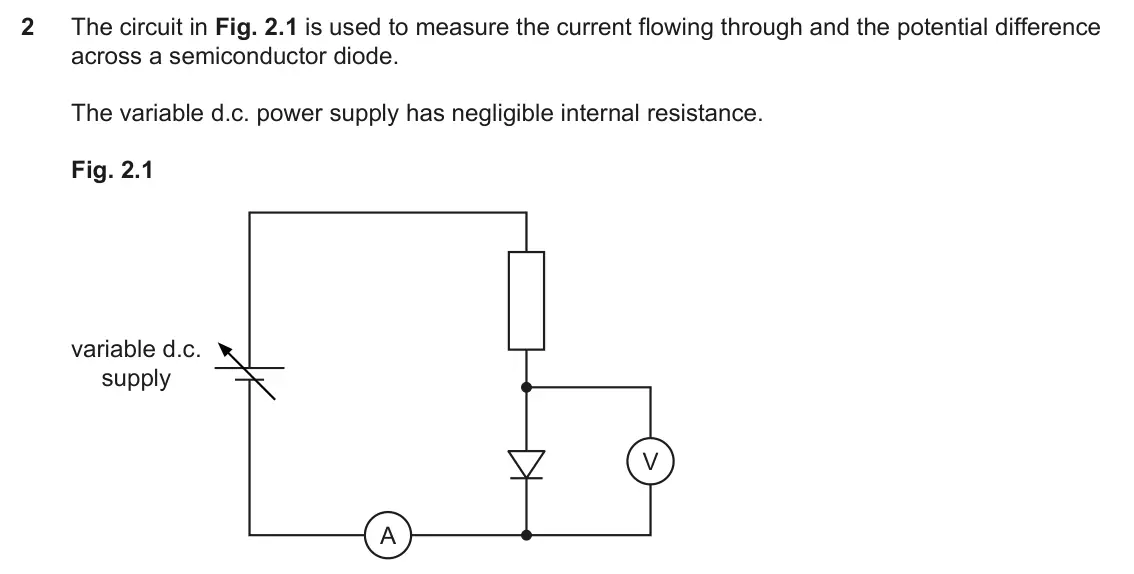
- Your answer
Q27(g)
The whole paper ↗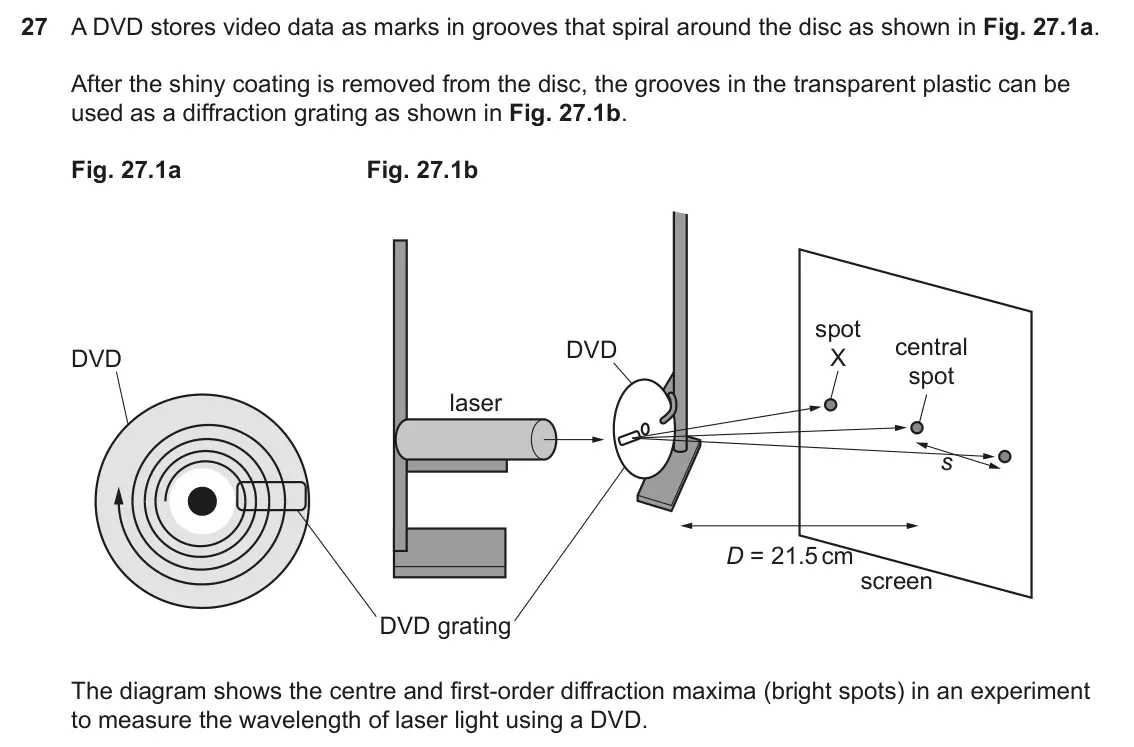
All 89 questions on Calculating uncertainties, as a list
- June 2025, Paper 1, Q2 (1 mark): A student measures the change in temperature of some water when it is heated for 10 seconds. The student’s results are: Starting temperature = (53.4 ± 0.2) °C F
- June 2025, Paper 1, Q36(b) (6 marks): (b)* A student carries out an experiment to determine the refractive index of a glass block using the apparatus shown in Fig. 36.2. Fig. 36.2 Laser (monochromat
- June 2025, Paper 3, Q1(a)(i) (1 mark): Determine the absolute uncertainty in the measurement of time. Absolute uncertainty = ± s [1]
- June 2025, Paper 3, Q1(a)(ii) (3 marks): Calculate the average velocity of the cupcake case. Include the uncertainty in your answer. Give your answer to an appropriate number of significant figures. Av
- June 2025, Paper 3, Q2(a)(ii) (2 marks): Estimate the absolute uncertainty in the value of mass of one staple obtained by your method in part (a)(i). Uncertainty = ± g [2]
- June 2025, Paper 3, Q2(b) (2 marks): The experiment is repeated several times for each value of current. With a current of 1.5 A, the number of staples needed to balance the wire horizontally was f
- June 2025, Paper 3, Q4(b) (2 marks): One pair of data points is shown below. Time for ten oscillations = 10.4 s ± 0.5 s Mass = 0.50 kg ± 0.01 kg The student decides to ignore the uncertainty in the
- June 2025, Paper 3, Q4(c)(ii) (3 marks): Calculate the uncertainty in the value of T 2 for the final data point and add these uncertainty bars to the graph. [3]
- June 2025, AS Paper 1, Q25(c)(ii) (2 marks): Calculate a mean value for the Planck constant. Planck constant = × 10–34 J s [2]
- June 2025, AS Paper 1, Q25(d) (2 marks): The class work out that their measurements produce an uncertainty in the value for the Planck constant of ±5%. Determine whether the class mean value for the Pl
- June 2025, AS Paper 2, Q5(a) (4 marks): A manufacturer produces fixed resistors, which it sells in boxes of ten. A technician checks the values of ten resistors in a box using the circuit shown in Fig
- June 2024, Paper 1, Q17 (1 mark): The density of a stone is determined by measuring its mass and volume, and using the equation density = mass ÷ volume. The mass of the stone measures 25.6 ± 0.2
- June 2024, Paper 1, Q38(b)(i) (2 marks): thermometer measures temperature to the nearest 1 °C. Use this information to calculate the percentage uncertainties in the measured volume and temperature at 3
- June 2024, Paper 2, Q2(c) (2 marks): Use the uncertainty in the diameter and current values to determine the uncertainty in your value for resistivity calculated above. Ignore any possible uncertai
- June 2024, Paper 3, Q1(b)(ii) (2 marks): Draw lines of both the maximum and minimum gradients through the data points and uncertainty bars on the graph. [2]
- June 2024, Paper 3, Q1(b)(iii) (5 marks): Calculate the mean rate of temperature rise in °C s–1 and its percentage uncertainty. Use the lines you drew for part (b)(ii). rate of temperature rise = °C s–1
- June 2024, Paper 3, Q1(c)(ii) (4 marks): The potential difference across the heater is set at 9.6 V ± 2%. The current is 3.76 A ± 0.9%. Using these values and the value calculated in part (b)(iii), det
- June 2024, Paper 3, Q2(a) (3 marks): Calculate the conductance of the semiconductor diode when the potential difference = 0.65 ± 0.02 V and the current = 7.5 ± 0.02 mA. Give the uncertainty in your
- June 2024, AS Paper 1, Q17 (1 mark): In an experiment to determine the acceleration due to gravity, g, a ball bearing takes time t to fall distance s. The percentage uncertainty in each measurement
- June 2024, AS Paper 1, Q27(g) (2 marks): The wavelength calculation uses the measurements of s, D and d. D was measured once using a metre ruler. Explain why taking more measurements of s will not redu
- June 2024, AS Paper 2, Q8(b)(i) (5 marks): Use data from Table 8.1 to calculate the value of the acceleration when the trolley mass is 0.800 kg. Include the uncertainty in your answer.
- June 2023, Paper 2, Q4(b)(ii) (3 marks): A student suggests that a more accurate determination of the velocity of sound could be made if the distance between several nodes was measured instead of the d
- June 2023, Paper 3, Q2(a)(i) (2 marks): Calculate the mean value of striking voltage and its absolute uncertainty. Mean striking voltage = ± V [2]
- June 2023, Paper 3, Q2(b)(i) (2 marks): Using the value for uncertainty found in (a)(i), add vertical error bars to all the plotted points and draw a steepest acceptable line through the error bars. [
- June 2023, Paper 3, Q2(b)(ii) (2 marks): Hence calculate the absolute uncertainty of the gradient value. Absolute uncertainty of gradient = ± V m [2]
- June 2023, Paper 3, Q2(c)(ii) (3 marks): The gradient of the line of best fit is 8.90 × 10⁻⁷ V m. Use this value to calculate a value of the Planck constant. Include a value for absolute uncertainty in
- June 2023, AS Paper 1, Q20 (1 mark): The best estimate of the uncertainty in power at 2500 r.p.m. is: A ±1 kW B ±2 kW C ±3 kW D ±6 kW Your answer [1]
- June 2023, AS Paper 2, Q5(b) (2 marks): The resistance of the resistor must be accurate to within ± 0.1 Ω. Calculate the maximum uncertainty ΔL which can be allowed in the length measurement. ΔL = m [
- June 2023, AS Paper 2, Q7(a)(i) (4 marks): Use data from Fig. 7.1 to make as accurate an estimate as possible of the frequency f of the musical note together with the uncertainty Δf of the value. Show yo
- June 2022, Paper 1, Q1 (1 mark): In an experiment to determine the focal length of a converging lens, a student sets up the apparatus shown in the diagram and observes a clear image on the scre
- June 2022, Paper 1, Q36(c)(iii) (2 marks): The student assumed a constant uncertainty in the sines of the angle. Suggest and explain why this is unlikely to be the case. [2]
- June 2022, Paper 1, Q36(c)(iv) (3 marks): The student calculated the value of the refractive index as 1.5. Use the graph to estimate a value for the uncertainty in the result. Explain your method. refra
- June 2022, Paper 3, Q2(a)(ii) (4 marks): Before setting up the apparatus, the student took measurements with vernier calipers of the internal diameter of the tube containing the gas. The student create
- June 2022, Paper 3, Q2(a)(iii) (2 marks): The height, h, of the column of air is measured using a standard laboratory metre rule. Estimate the absolute uncertainty in the measurement and justify your an
- June 2022, Paper 3, Q4(b)(i) (1 mark): The line of best fit has been drawn on Fig. 4.2. Draw another line within the error bars shown, which has the greatest difference in gradient to the first line.
- June 2022, Paper 3, Q4(b)(ii) (3 marks): The gradient of the line of best fit in Fig. 4.2 is 10 100 NM–1. Use this to calculate a value for the Young modulus of the wire. Use the line you have drawn to
- June 2022, Paper 3, Q4(c)(ii) (2 marks): Suggest how the student could use multiple measurements to find the uncertainty of the diameter of the wire. [2]
- June 2022, Paper 3, Q4(c)(iii) (3 marks): The student measures the diameter of another wire to be 0.35 ± 0.02 mm. Calculate the cross‑sectional area of the wire along with the absolute uncertainty. Area
- June 2022, AS Paper 1, Q20 (1 mark): A student makes two measurements to determine the speed of a trolley rolling down a ramp. Measurement Measuring device Value Uncertainty Length of ramp metre ru
- November 2021, Paper 1, Q3 (1 mark): Using the information in the box, which is the best estimate of the gradient of the graph, together with its uncertainty? 3.8 ± 0.7 cm N–1 A 3.8 ± 1.4 cm N–1 B
- November 2021, Paper 3, Q1(a)(iv) (4 marks): Use the gradient to calculate the value for the acceleration of free fall. Include the uncertainty in your answer. acceleration of free fall = ± m s–2 [4]
- November 2021, Paper 3, Q2(b)(ii) (3 marks): Estimate the uncertainty in the measurement of the distance between the slits and the screen and hence calculate the absolute uncertainty in the calculated valu
- November 2021, AS Paper 1, Q18 (1 mark): The conductance G of a volume V of conducting putty rolled into a cylinder of length l is G = V ρl 2 Which combination of measurement precision will give the mo
- November 2021, AS Paper 1, Q19 (1 mark): An engineer is estimating the load on a steel beam. There are 80 bricks on the beam. Each brick has mass 2.5 ± 0.1 kg. The true load on the beam most likely lie
- November 2021, AS Paper 2, Q1(a) (4 marks): Ignoring the value of 0.34 mm, obtain values for the diameter d and its uncertainty, Δd. Show your working and give both values to an appropriate number of sign
- November 2021, AS Paper 2, Q8(c)(iv) (4 marks): Draw appropriate straight lines on the graph and use these to find the value of the best- fit gradient and its uncertainty. From these values, obtain the speed
- November 2020, Paper 2, Q3(b)(iv) (3 marks): The gradient of the ‘steepest-possible’ line is 1.74 × 10⁻⁶ V m. Use this to calculate an estimate of the uncertainty of the value for the Planck constant in (b
- November 2020, Paper 3, Q1(b)(ii) (4 marks): The following readings were obtained: potential difference V = 10.5 ± 0.2 V current I = 2.3 ± 0.2 A. Calculate the power supplied to the heater per unit mass of
- November 2020, Paper 3, Q3(b)(i) (4 marks): The gradient of the line is 83 m s–1. Calculate the speed of sound in air. Calculate the percentage uncertainty in your result by taking a ‘worst-fit’ line from
- November 2020, AS Paper 1, Q20 (1 mark): A student calculates the resistivity of a material using the formula ρ = R πr 2 L The values of R, L and r are all measured with a percentage uncertainty of 1%.
- November 2020, AS Paper 1, Q27(a) (1 mark): Complete the table with the missing mean value. [1]
- November 2020, AS Paper 2, Q8(a) (3 marks): Sam uses a micrometer to make a number of measurements of the diameter of the wire at different points along its length. She records her readings in this dot-pl
- November 2020, AS Paper 2, Q8(c)(ii) (3 marks): Sam decides that the uncertainties in m are far less than those in x, and plots the data as shown opposite. m ⎛ ⎞ Use the graph to find ⎝ ⎠ and its uncertainty.
- June 2019, Paper 1, Q14 (1 mark): The resistance R of an unknown resistor is found by measuring the potential difference V across the resistor and the current I through it, using the equation R
- June 2019, Paper 3, Q1(a)(ii) (3 marks): The absolute uncertainty in the measurement of each angle is ± 4°. Complete the table below with maximum and minimum values of the measured angles, and hence de
- June 2019, Paper 3, Q2(c) (2 marks): The student is considering the uncertainty in her value for g. She thinks that data collected for the shorter pendulums have greater percentage uncertainty than
- June 2019, Paper 3, Q4(c)(i) (2 marks): Fifteen apparently identical thermometers are available. Describe how the student can determine the uncertainty in the reading of the temperature by using all t
- June 2019, Paper 3, Q4(c)(ii) (6 marks): Fig. 4.2 shows the graph of the data collected, including the uncertainty in the pressure readings. 120 110 100 pressure / kPa 90 80 70 60 250 270 290 310 330 3
- June 2019, AS Paper 1, Q6 (1 mark): A student measures the potential difference across a wire = 1.05 V (±0.01 V) and the current through the wire = 0.34 A (±0.01 A). The percentage uncertainty in
- June 2019, AS Paper 2, Q8(b) (2 marks): Lizzie uses the arrangement in Fig. 8.2 to measure object (u) and image (v) distances. As an object, she marks a black letter X on a thin sheet of paper. The im
- June 2019, AS Paper 2, Q8(d) (3 marks): In her experiment, Lizzie obtains the following set of values of v and Δv for each chosen value of u. Complete the last two columns and plot the missing data on
- June 2019, AS Paper 2, Q8(e) (6 marks): Lizzie has bought a new lens for her camera. It is marked with the focal length 50 mm (Fig. 8.1). She wants to measure its focal length as accurately as possibl
- June 2018, Paper 1, Q38(b) (3 marks): Draw a line of best fit on the graph and measure its gradient with an uncertainty estimate. gradient = ± [3]
- June 2018, Paper 1, Q38(c) (3 marks): Use the gradient to estimate an average wavelength for the light together with an uncertainty estimate. Make your method clear. wavelength = ± m [3]
- June 2018, Paper 2, Q1(b)(ii) (2 marks): The highest p.d. recorded by the voltmeter is 3.00 ± 0.01 V. Calculate the maximum value of the resistance of the LDR at this point. Assume that there is no unc
- June 2018, Paper 3, Q1(a)(ii) (3 marks): Calculate the cross sectional area A of the wire and the uncertainty. A = ± m2 [3]
- June 2018, Paper 3, Q4(a)(i) (3 marks): Use the information in the dot-plot to find the mean D. Use the spread to determine the percentage uncertainty. mean D = ………………………… mm ± ……………… % [3]
- June 2018, Paper 3, Q4(a)(ii) (3 marks): Calculate the cross sectional area A of the wire and include the uncertainty. A ………………………… ± ……………… m2 [3]
- June 2018, Paper 3, Q4(c) (6 marks): This question is about an experiment to determine the Young modulus of a copper wire. The diameter D of the wire was measured using a micrometer screw gauge in
- June 2018, AS Paper 1, Q29(d) (4 marks): The readings of p.d. for Fig. 29.2 were taken with a digital voltmeter. Five consecutive values were recorded at each temperature. The calculated mean output p.
- June 2018, AS Paper 2, Q8(a)(i) (3 marks): For this LED, Alice and Bob obtain the following data for the first-order maximum. reading 1 reading 2 reading 3 y1 / cm 5.9 6.2 6.1 y2 / cm 6.1 5.9 6.3 Use the
- June 2017, Paper 1, Q37(a) (2 marks): Fig. 37.2 shows the graph of velocity against time obtained by analysing the video recording. This method has an uncertainty of about ± 3% for velocity measurem
- June 2017, Paper 2, Q9(a)(i) (1 mark): State the spread of the distance values. spread = ± m [1]
- June 2017, Paper 2, Q9(a)(ii) (2 marks): A student suggests that the uncertainty in the distance values can be ignored when calculating the minimum angle that can be resolved because of the uncertainty
- June 2017, Paper 2, Q9(a)(iii) (3 marks): Calculate a value for the minimum angle that can be resolved. Include an estimate of the uncertainty in your value. Explain how you estimated the uncertainty. m
- June 2017, Paper 3, Q3(b)(i) (2 marks): Complete the table by calculating the mean change in balance reading and the corresponding values of force F for the last two current values. g = 9.8 N kg−1 [2]
- June 2017, Paper 3, Q3(b)(ii) (2 marks): Use the table to determine the uncertainty in F. Explain your reasoning. [2]
- June 2017, Paper 3, Q4(a)(ii) (1 mark): Ignoring the two potential outliers, calculate the range of the typical values on the dot‑plot. range = m [1]
- June 2017, Paper 3, Q4(a)(iii) (2 marks): Calculate the mean of the values within the range calculated in (a)(ii). Mark this on the dot‑plot above. mean = m [2]
- June 2017, Paper 3, Q4(c)(ii) (4 marks): Use the uncertainty bars on Fig. 4.6 to determine the maximum and minimum values for the power of the lens. Use these values to determine the percentage uncerta
- June 2017, AS Paper 1, Q16 (1 mark): The length of a square paving stone is 0.500 ± 0.002 m. The percentage uncertainty in this measurement is 0.4%. The area of the paving slab is 0.250 m2. What is
- June 2017, AS Paper 1, Q28(c) (4 marks): The student measured the frequency of the sound wave at 560 ± 30 Hz. The uncertainties in the distances from each speaker to position C are ± 0.02 m. Calculate
- June 2017, AS Paper 2, Q8(a)(ii) (3 marks): The time recorded by the data-logger when a trolley passes the light gate is 0.1453 s. Calculate the mean speed of the trolley and its uncertainty. Give both va
- June 2016, AS Paper 1, Q29(a)(i) (2 marks): The single 1.6 s reading was treated as an outlier. Calculate the mean time of drop for the remaining data and estimate the uncertainty. mean time of drop = ± s
- June 2016, AS Paper 1, Q29(a)(iii) (3 marks): The vertical distance is measured as 1.85 ± 0.02 m due to the uncertainty in the release position. Calculate your best estimate for the terminal velocity of the
- June 2016, AS Paper 2, Q6(a) (3 marks): Anna correctly records the values of u and v and their uncertainties for s = 0.24 m as follows. u / m s–1 v / m s–1 s / m 0.24 1.40 ± 0.04 2.61 ± 0.03 Table 6.3
- June 2016, AS Paper 2, Q6(c)(i) (2 marks): Use the data from Table 6.3 to show that the uncertainty in v2 – u2 is 0.3 m2 s–2 when s = 0.24 m. [2]
- June 2016, AS Paper 2, Q6(c)(ii) (2 marks): Anna decides to use this value of uncertainty for each uncertainty bar in her graph of v2 – u2 against s. Suggest why this may not be accurate when s is much gr
- June 2016, AS Paper 2, Q6(d) (3 marks): Anna repeats her measurements for five further values of s and plots the graph of Fig. 6.4. Draw suitable lines on the graph and use them to determine the value
Questions, mark schemes and examiner’s reports are © OCR, from their published past papers. Plumi isn’t affiliated with any exam board. Want whole papers? OCR A-Level Physics B past papers.
The Plumi iPad app also offers exam-style questions with AI feedback on your handwritten working.