 plumi
Plotting data and uncertainty bars: OCR A‑Level Physics B questions
OCR A-Level Physics B past-paper questions on 2.0.7 Plotting data and uncertainty bars, 2016–2025, with mark schemes and examiner’s reports where available.
Paper
All papers
Exam
All years
Calculations
Q3(c)
The whole paper ↗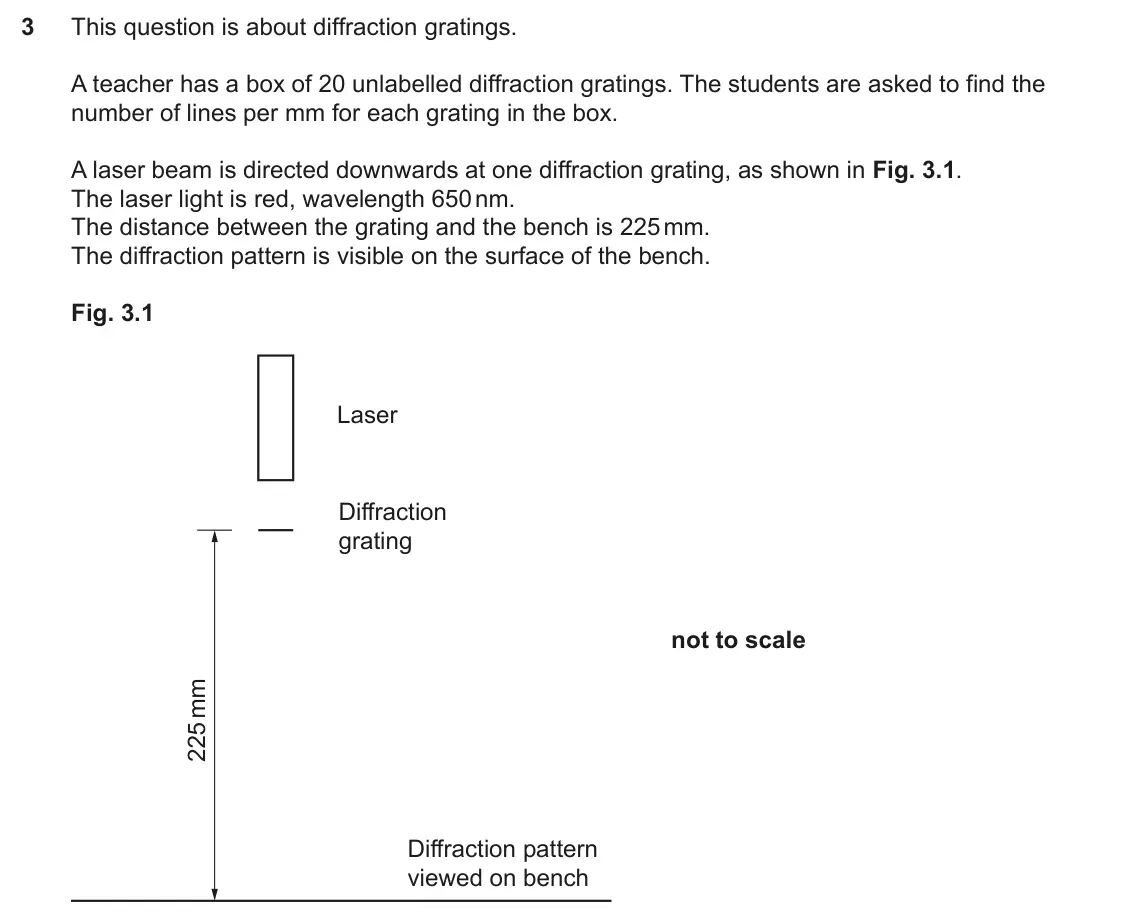
Q4(c)(ii)
The whole paper ↗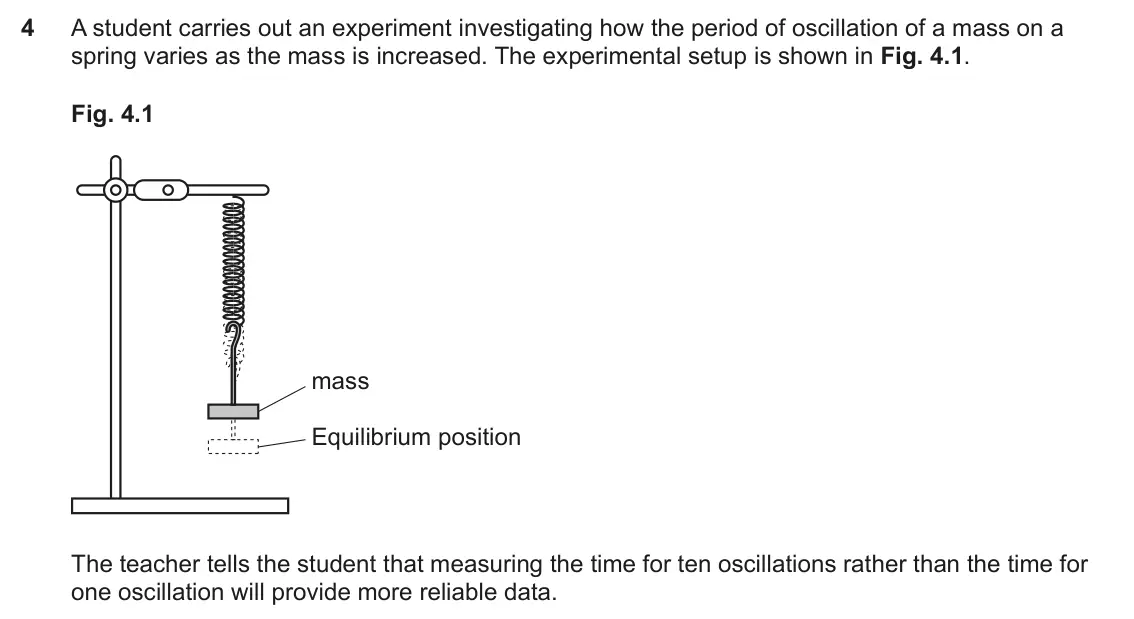
Q5(a)
The whole paper ↗Q7(a)
The whole paper ↗
Q1(b)(i)
The whole paper ↗
Q1(b)(ii)
The whole paper ↗Q27(c)
The whole paper ↗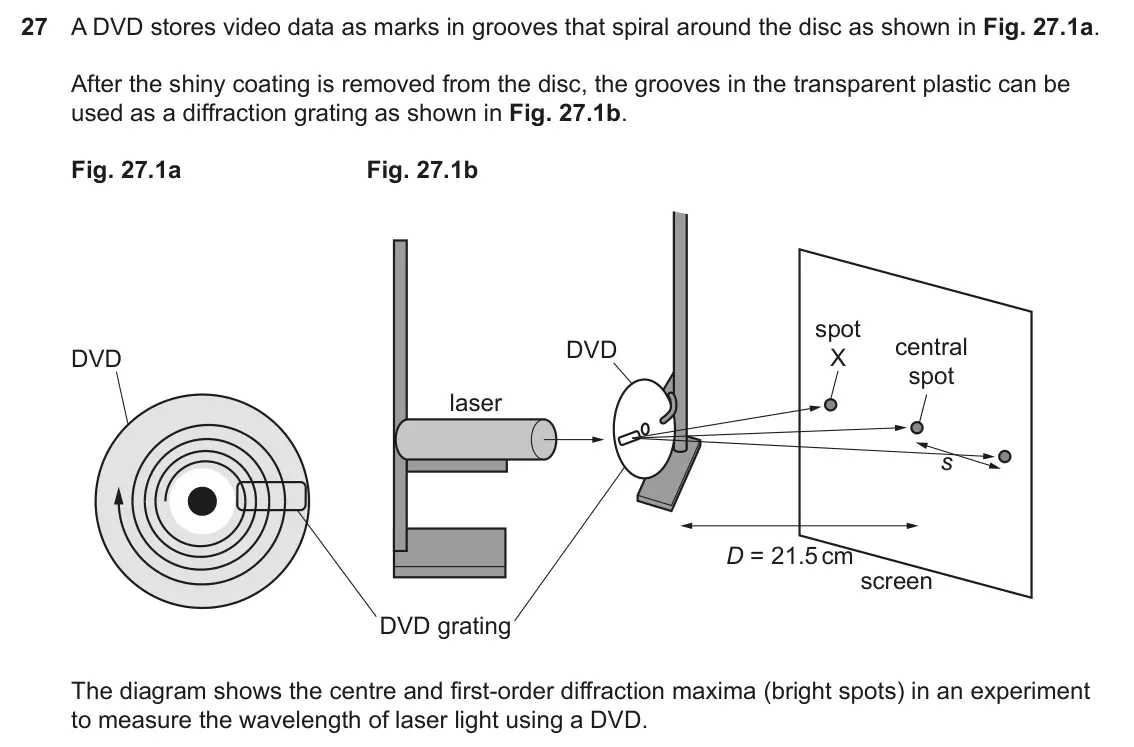
Q8(b)(ii)
The whole paper ↗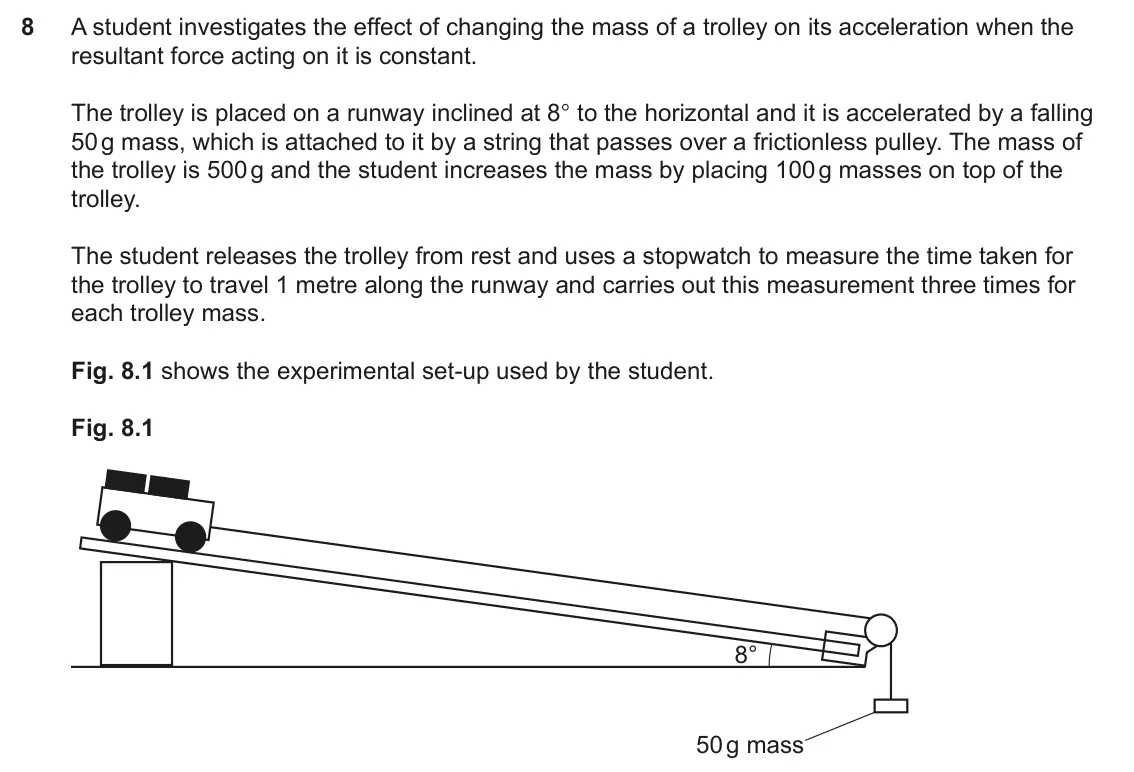
- Your answer
Q2(b)(i)
The whole paper ↗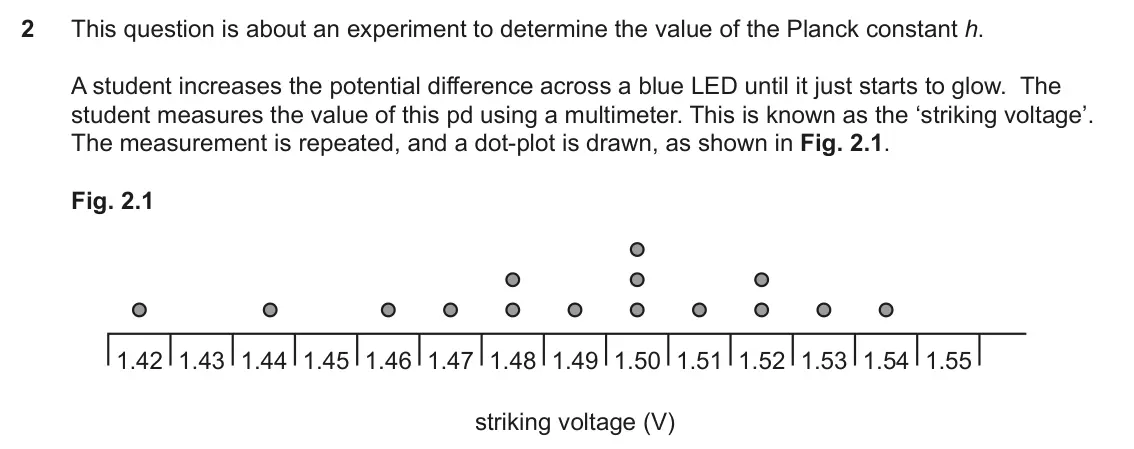
Q8(c)
The whole paper ↗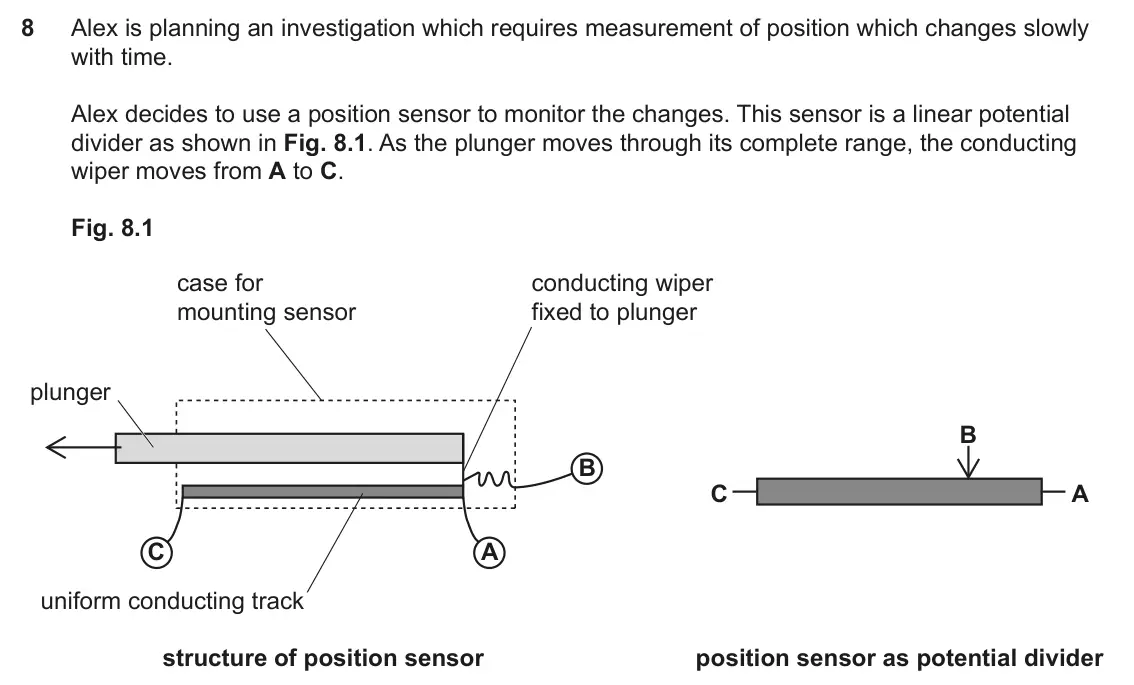
Q2(a)(ii)
The whole paper ↗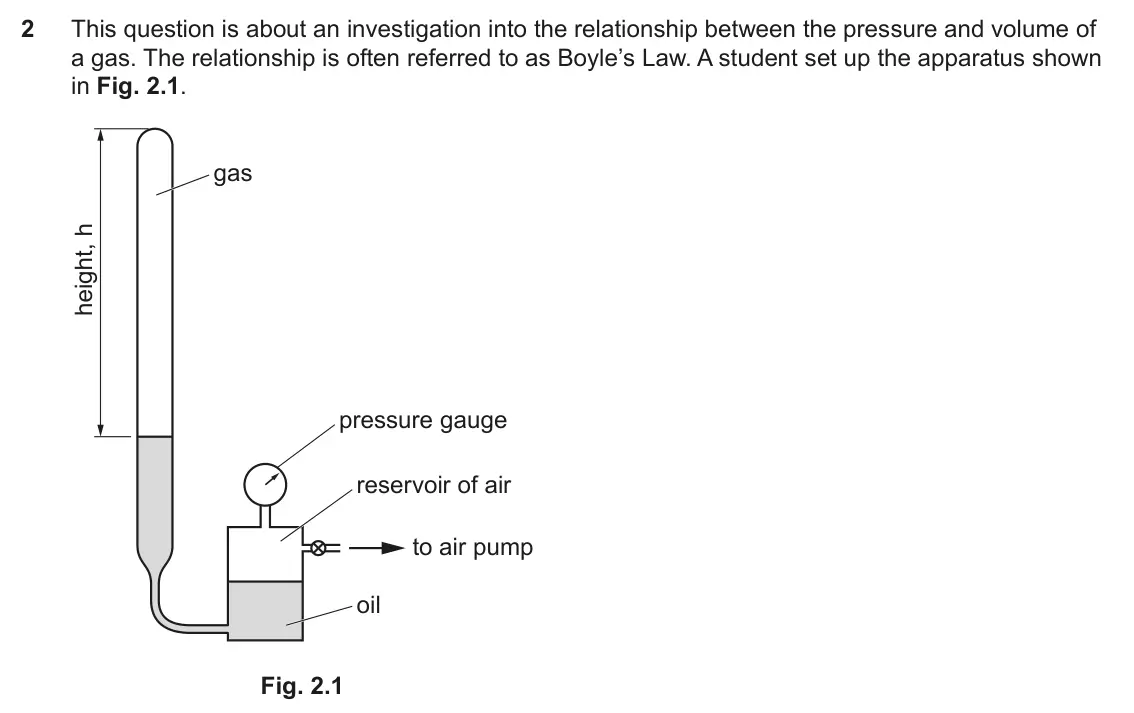
Q8(a)
The whole paper ↗
- Your answer
Q1(a)(ii)
The whole paper ↗
Q1(a)
The whole paper ↗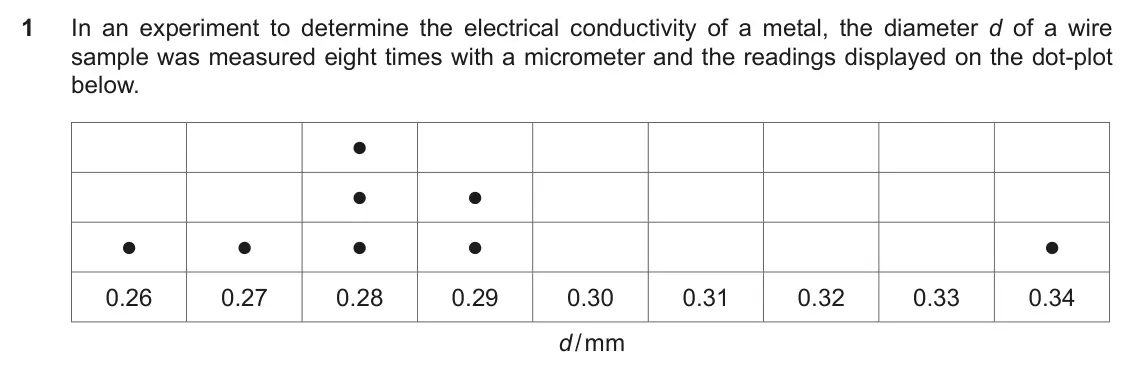
Q1(b)
The whole paper ↗Q8(c)(iii)
The whole paper ↗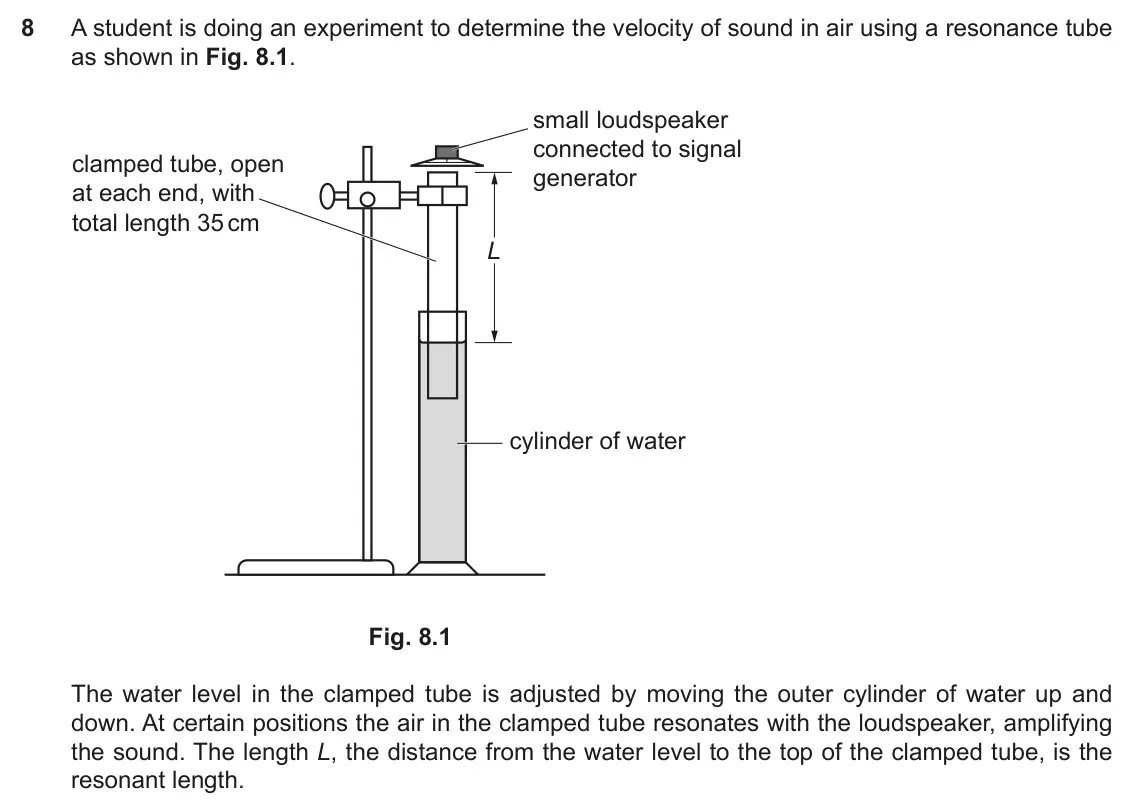
Q26(f)
The whole paper ↗
Q8(a)
The whole paper ↗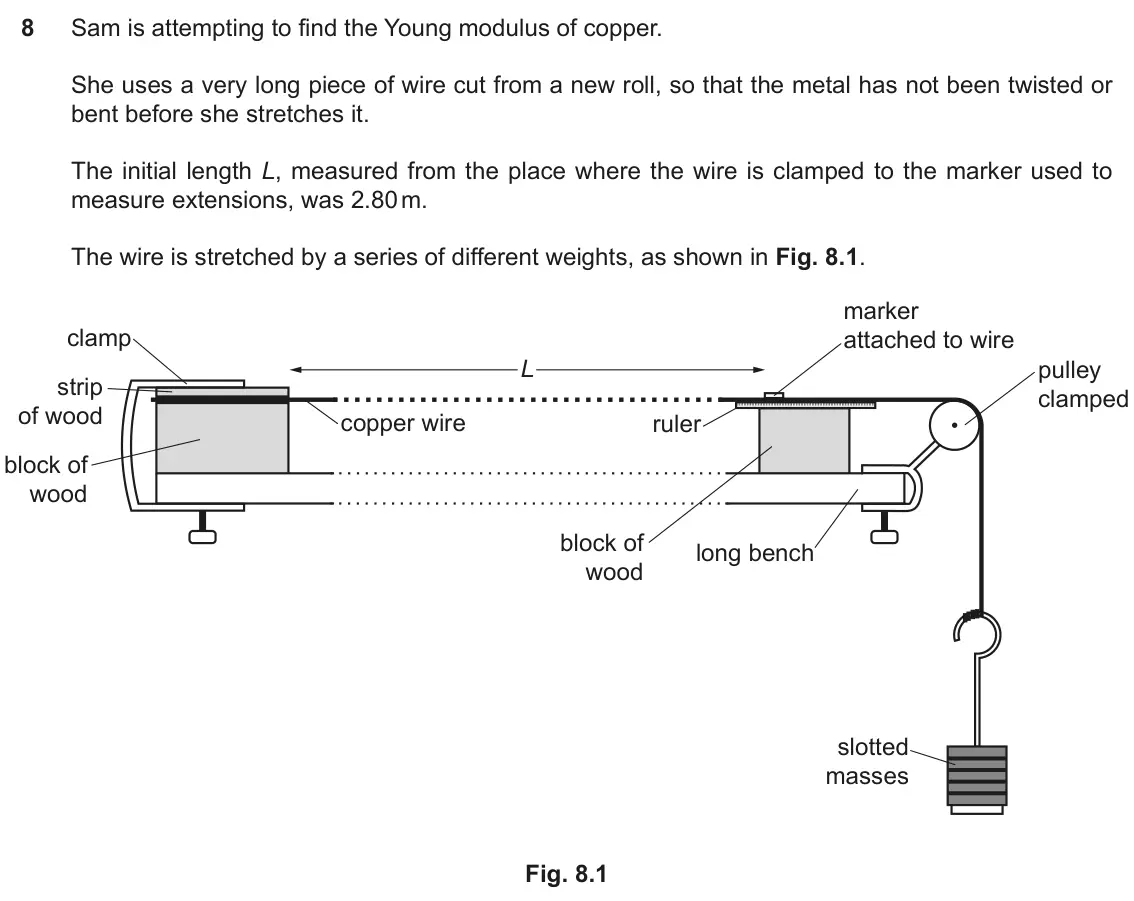
All 36 questions on Plotting data and uncertainty bars, as a list
- June 2025, Paper 3, Q3(c) (3 marks): Table 3.1 shows the values obtained from all 20 diffraction gratings. Table 3.1 Number of lines per mm 144 320 590 594 603 156 567 591 599 605 299 588 592 600 6
- June 2025, Paper 3, Q4(c)(ii) (3 marks): Calculate the uncertainty in the value of T 2 for the final data point and add these uncertainty bars to the graph. [3]
- June 2025, AS Paper 2, Q5(a) (4 marks): A manufacturer produces fixed resistors, which it sells in boxes of ten. A technician checks the values of ten resistors in a box using the circuit shown in Fig
- June 2024, Paper 2, Q7(a) (2 marks): Suggest why a logarithmic scale is used on the x-axis of the graph and why this choice of scale can make interpreting the data more difficult. [2]
- June 2024, Paper 3, Q1(b)(i) (1 mark): The absolute uncertainty in each temperature measurement is ± 1.0 °C. Draw vertical uncertainty bars on each plot. [1]
- June 2024, Paper 3, Q1(b)(ii) (2 marks): Draw lines of both the maximum and minimum gradients through the data points and uncertainty bars on the graph. [2]
- June 2024, AS Paper 1, Q27(c) (1 mark): Eight different students measured the distance, s, with a ruler and recorded the results in a dot-plot. • • • • • • • • distance, s / cm 43.0 43.2 43.3 44.1 The
- June 2024, AS Paper 2, Q8(b)(ii) (1 mark): Complete the graph and plot the point when the trolley mass is 0.800 kg on Fig. 8.2 and include the error bar for the acceleration calculated from (b)(i). [1]
- June 2023, Paper 1, Q1 (1 mark): The diagram shows a dot-plot of measurements of diameter at points along a wire. 0.06 0.07 0.08 0.09 0.10 0.11 0.12 0.13 0.14 diameter / mm Which of the followi
- June 2023, Paper 3, Q2(b)(i) (2 marks): Using the value for uncertainty found in (a)(i), add vertical error bars to all the plotted points and draw a steepest acceptable line through the error bars. [
- June 2023, AS Paper 2, Q8(c) (2 marks): Use data from the table in (b) to complete the graph of Fig. 8.2 below. Fig. 8.2 4.0 VAB/V 3.0 2.0 1.0 0.0 0 10 20 30 40 50 d/mm [2]
- June 2022, Paper 3, Q2(a)(ii) (4 marks): Before setting up the apparatus, the student took measurements with vernier calipers of the internal diameter of the tube containing the gas. The student create
- June 2022, AS Paper 2, Q8(a) (5 marks): Beth knows that, for small enough values of θ, the grating equation λ = d sin θ can be written λ = xd L which can be rearranged to x = ⎛⎞ λ d L. ⎝⎠ She measured
- November 2021, Paper 1, Q30 (1 mark): The graph shows how the half-life t1/2 of different beta-emitting radioactive nuclides varies with the energy E of the emitted beta-particles. 1014 t / s 1/2 10
- November 2021, Paper 3, Q1(a)(ii) (3 marks): Plot these two points to complete the graph of height against t2 in Fig. 1.1. Add horizontal error bars to all the plotted points. [3]
- November 2021, AS Paper 2, Q1(a) (4 marks): Ignoring the value of 0.34 mm, obtain values for the diameter d and its uncertainty, Δd. Show your working and give both values to an appropriate number of sign
- November 2021, AS Paper 2, Q1(b) (2 marks): Explain why it is appropriate to treat the reading of 0.34 mm as an outlier and suggest how the anomalous reading may have been obtained. [2]
- November 2021, AS Paper 2, Q8(c)(iii) (1 mark): Complete the table to the appropriate precision and plot the missing data on the graph opposite. [1]
- November 2020, AS Paper 1, Q26(f) (2 marks): Justify whether the results are consistent with a Brewster angle of 58°. [2]
- November 2020, AS Paper 2, Q8(a) (3 marks): Sam uses a micrometer to make a number of measurements of the diameter of the wire at different points along its length. She records her readings in this dot-pl
- June 2019, Paper 1, Q36(a)(i) (1 mark): State why a log – log scale has been used to represent the data. [1]
- June 2019, Paper 3, Q4(c)(ii) (6 marks): Fig. 4.2 shows the graph of the data collected, including the uncertainty in the pressure readings. 120 110 100 pressure / kPa 90 80 70 60 250 270 290 310 330 3
- June 2019, AS Paper 2, Q8(d) (3 marks): In her experiment, Lizzie obtains the following set of values of v and Δv for each chosen value of u. Complete the last two columns and plot the missing data on
- June 2018, Paper 1, Q38(a) (1 mark): Suggest a reason why only uncertainties in the fringe spacing are shown on the graph. [1]
- June 2018, Paper 3, Q4(a)(i) (3 marks): Use the information in the dot-plot to find the mean D. Use the spread to determine the percentage uncertainty. mean D = ………………………… mm ± ……………… % [3]
- June 2018, Paper 3, Q4(b)(i) (4 marks): On Fig. 4.2 1 complete vertical and horizontal error bars on each of the plots 2 label the regions of elastic and plastic deformation 3 draw a line of best fit
- June 2018, AS Paper 1, Q25(b) (1 mark): Using Fig. 25.2 determine the factor by which TEM resolution has improved between the years 1945 and 2010. factor = [1]
- June 2017, Paper 1, Q39(b)(i) (2 marks): Calculate the gradient of the sloping part of the log / log graph in Fig. 39.3. gradient = [2]
- June 2017, Paper 1, Q39(b)(ii) (4 marks): State whether the graph shows that the count rate C varies as C ∝ 2 R and explain which radiation(s) α, β or γ might be responsible for such a variation. [4]
- June 2017, Paper 3, Q1(c)(i) (3 marks): It is suggested that Vout varies linearly with T. By adding uncertainty bars to Fig. 1.3 use the graph to show that this is true over the temperature range test
- June 2017, Paper 3, Q4(a)(iii) (2 marks): Calculate the mean of the values within the range calculated in (a)(ii). Mark this on the dot‑plot above. mean = m [2]
- June 2017, Paper 3, Q4(a)(iv) (2 marks): The spread of data is given by; spread = ± ½ range. A measurement can be considered to be an outlier if it is more than twice the spread from the mean. State wh
- June 2016, AS Paper 1, Q29(a)(i) (2 marks): The single 1.6 s reading was treated as an outlier. Calculate the mean time of drop for the remaining data and estimate the uncertainty. mean time of drop = ± s
- June 2016, AS Paper 1, Q29(a)(ii) (1 mark): Explain why the 1.6 s reading was treated as an outlier. [1]
- June 2016, AS Paper 2, Q3(a) (2 marks): Fig. 3.2 is classified as a log-log graph because each scale division along both axes is a fixed factor larger than the preceding one (in this case, ten times).
- June 2016, AS Paper 2, Q6(c)(ii) (2 marks): Anna decides to use this value of uncertainty for each uncertainty bar in her graph of v2 – u2 against s. Suggest why this may not be accurate when s is much gr
Questions, mark schemes and examiner’s reports are © OCR, from their published past papers. Plumi isn’t affiliated with any exam board. Want whole papers? OCR A-Level Physics B past papers.
The Plumi iPad app also offers exam-style questions with AI feedback on your handwritten working.