Skip to content
Android waitlistTry on iPad
Get started

Weather and climate: CAIE IGCSE Geography questions

CAIE IGCSE Geography past-paper questions on Weather and climate, June 2024, June and November 2025, March 2026, a 9–1 variant, and the 2020 and 2027 specimens, with mark schemes and examiner’s reports where available.

Paper
All papers
Exam
All years
Calculations

Loading the full question list…

122 questions

  1. Q1

    March 2026 · Paper 4 (42)

    Sources (insert) ↗
    The whole paper ↗
    1
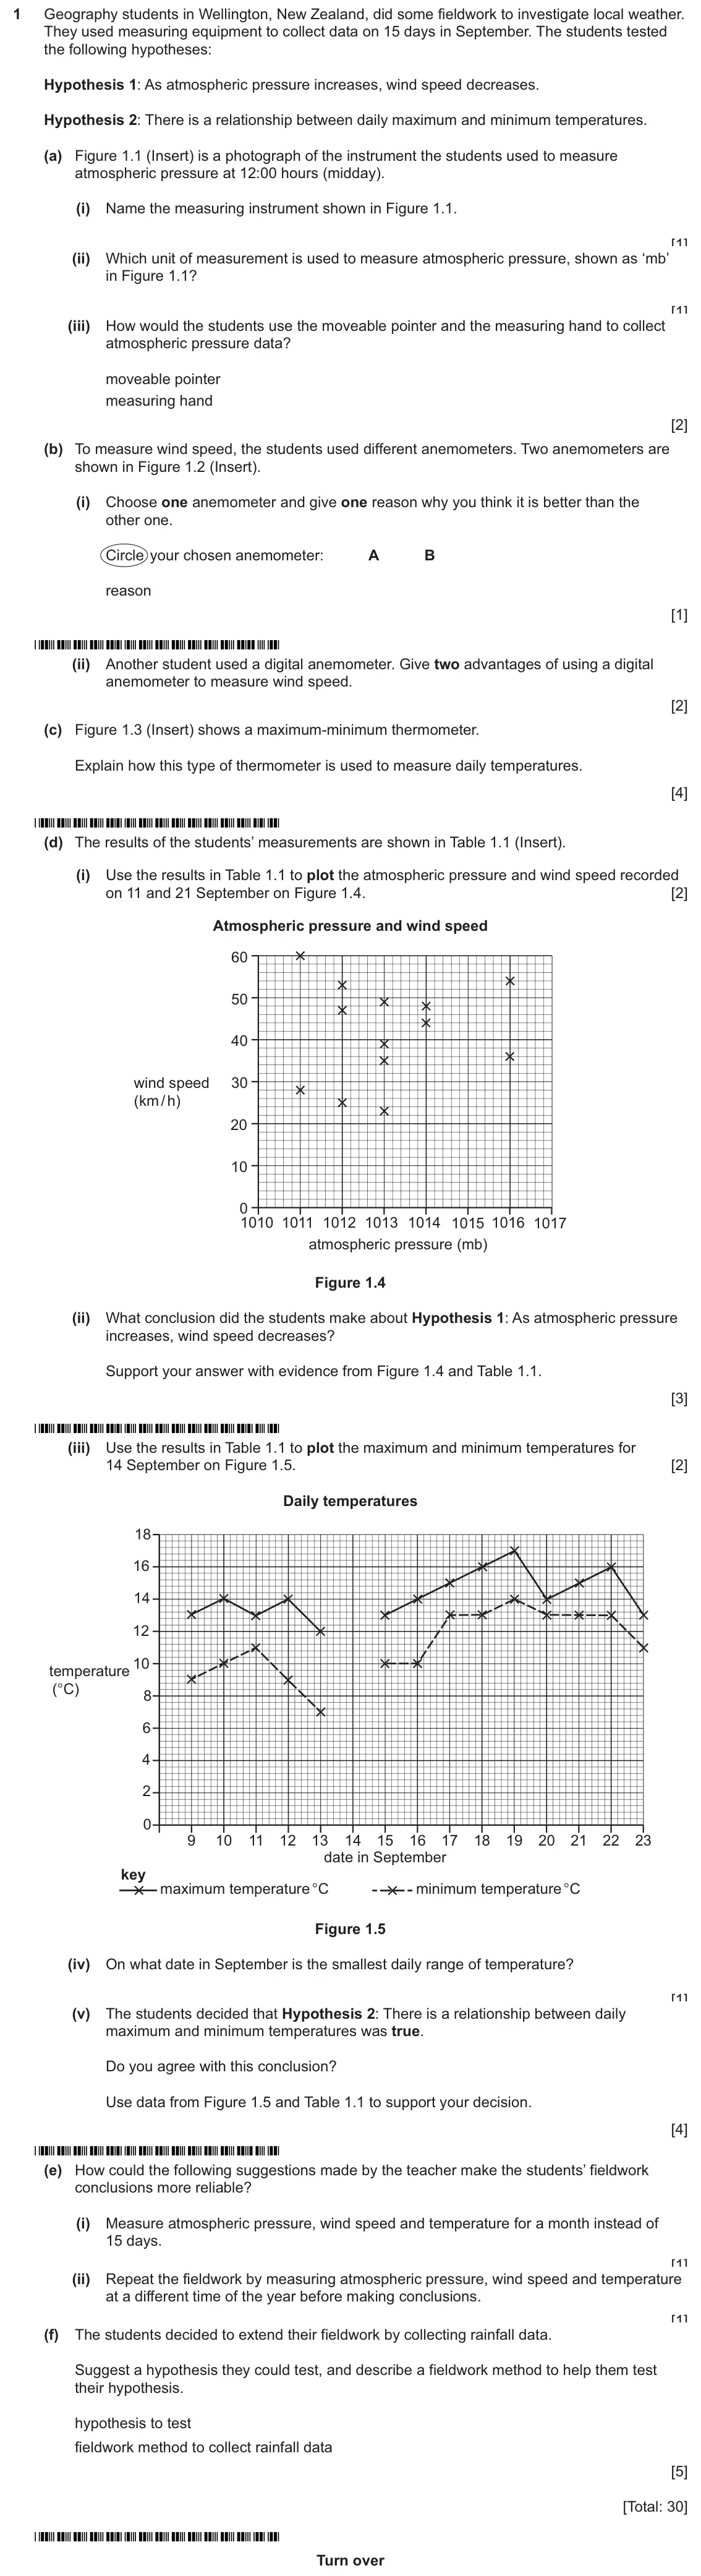
    Original question 1: Geography students in Wellington, New Zealand, did some fieldwork to investigate local weather. They used measuring equipment to collect data on 15 days in Sept

    Loading the question…

  2. Q2

    November 2025 · Paper 2 (21)

    Sources (insert) ↗
    The whole paper ↗
    2
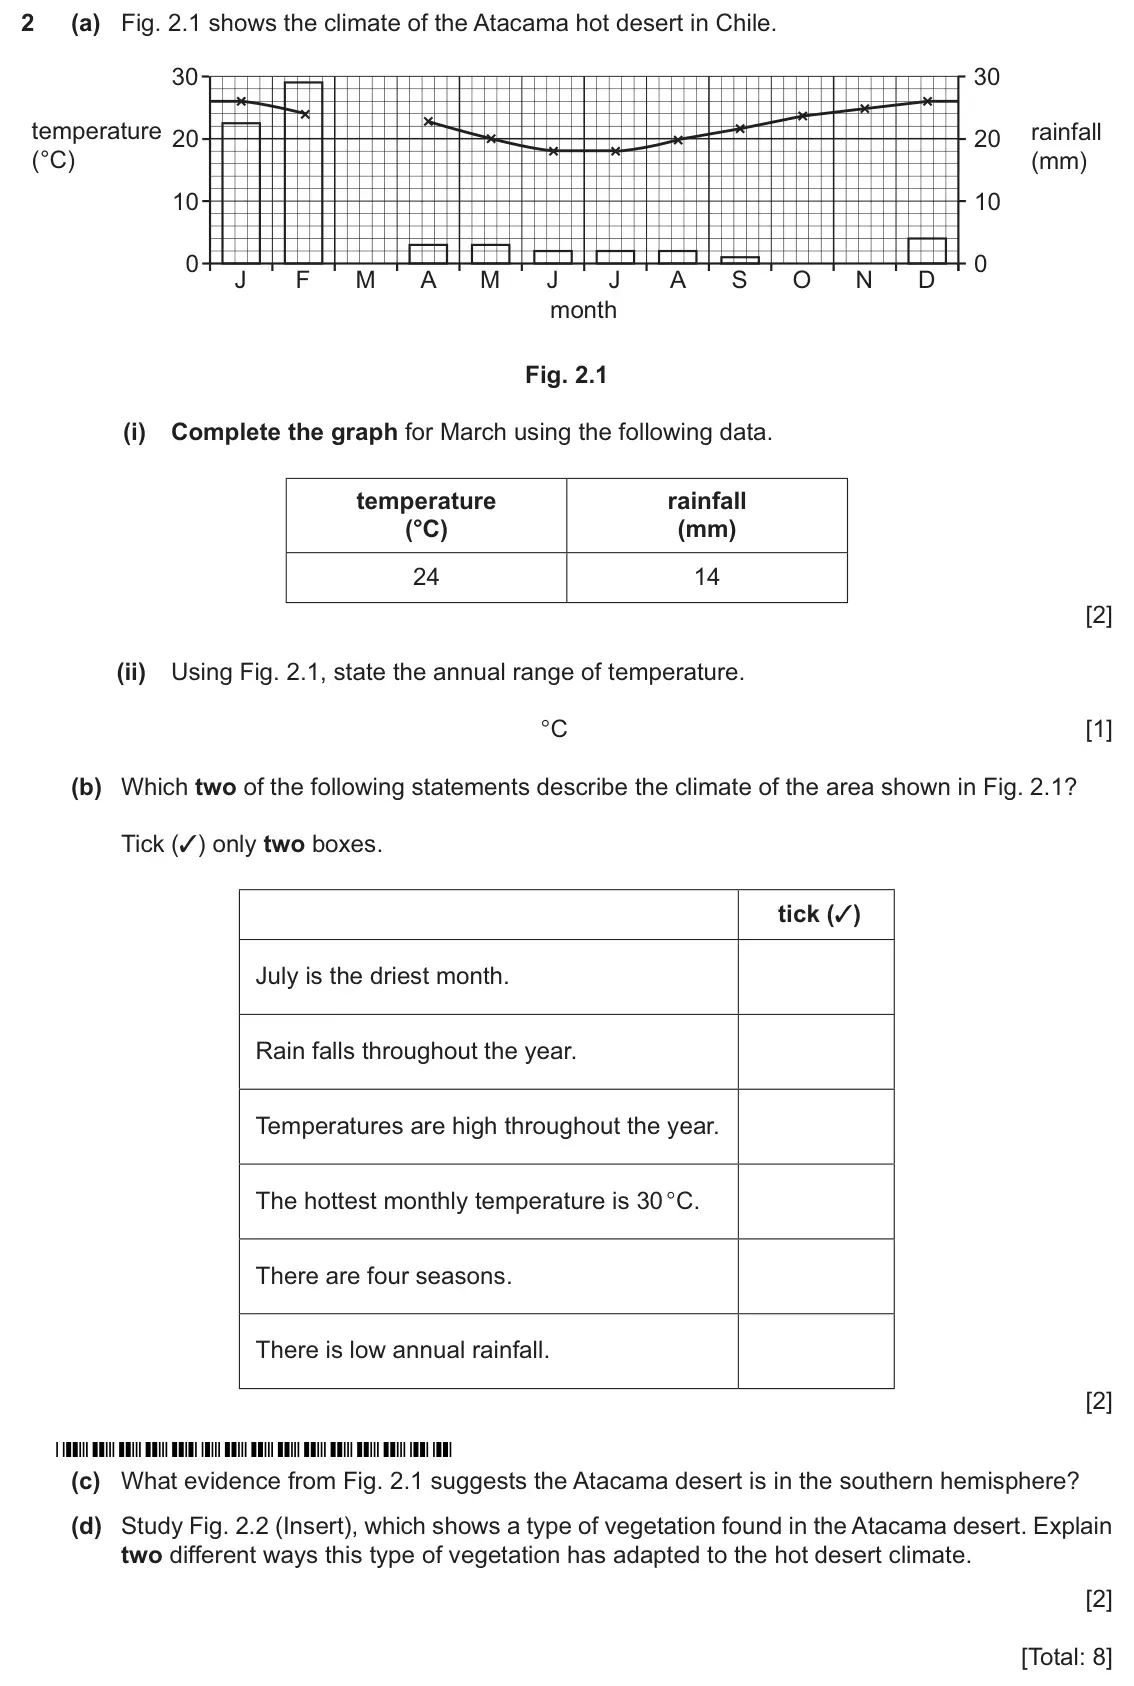
    Original question 2: (a) Fig. 2.1 shows the climate of the Atacama hot desert in Chile. 30 30 temperature rainfall 20 20 (°C) (mm) 10 10 0 0 J F M A M J J A S O N D month Fig. 2.1 (

    Loading the question…

  3. Q5

    November 2025 · Paper 2 (23)

    Sources (insert) ↗
    The whole paper ↗
    3
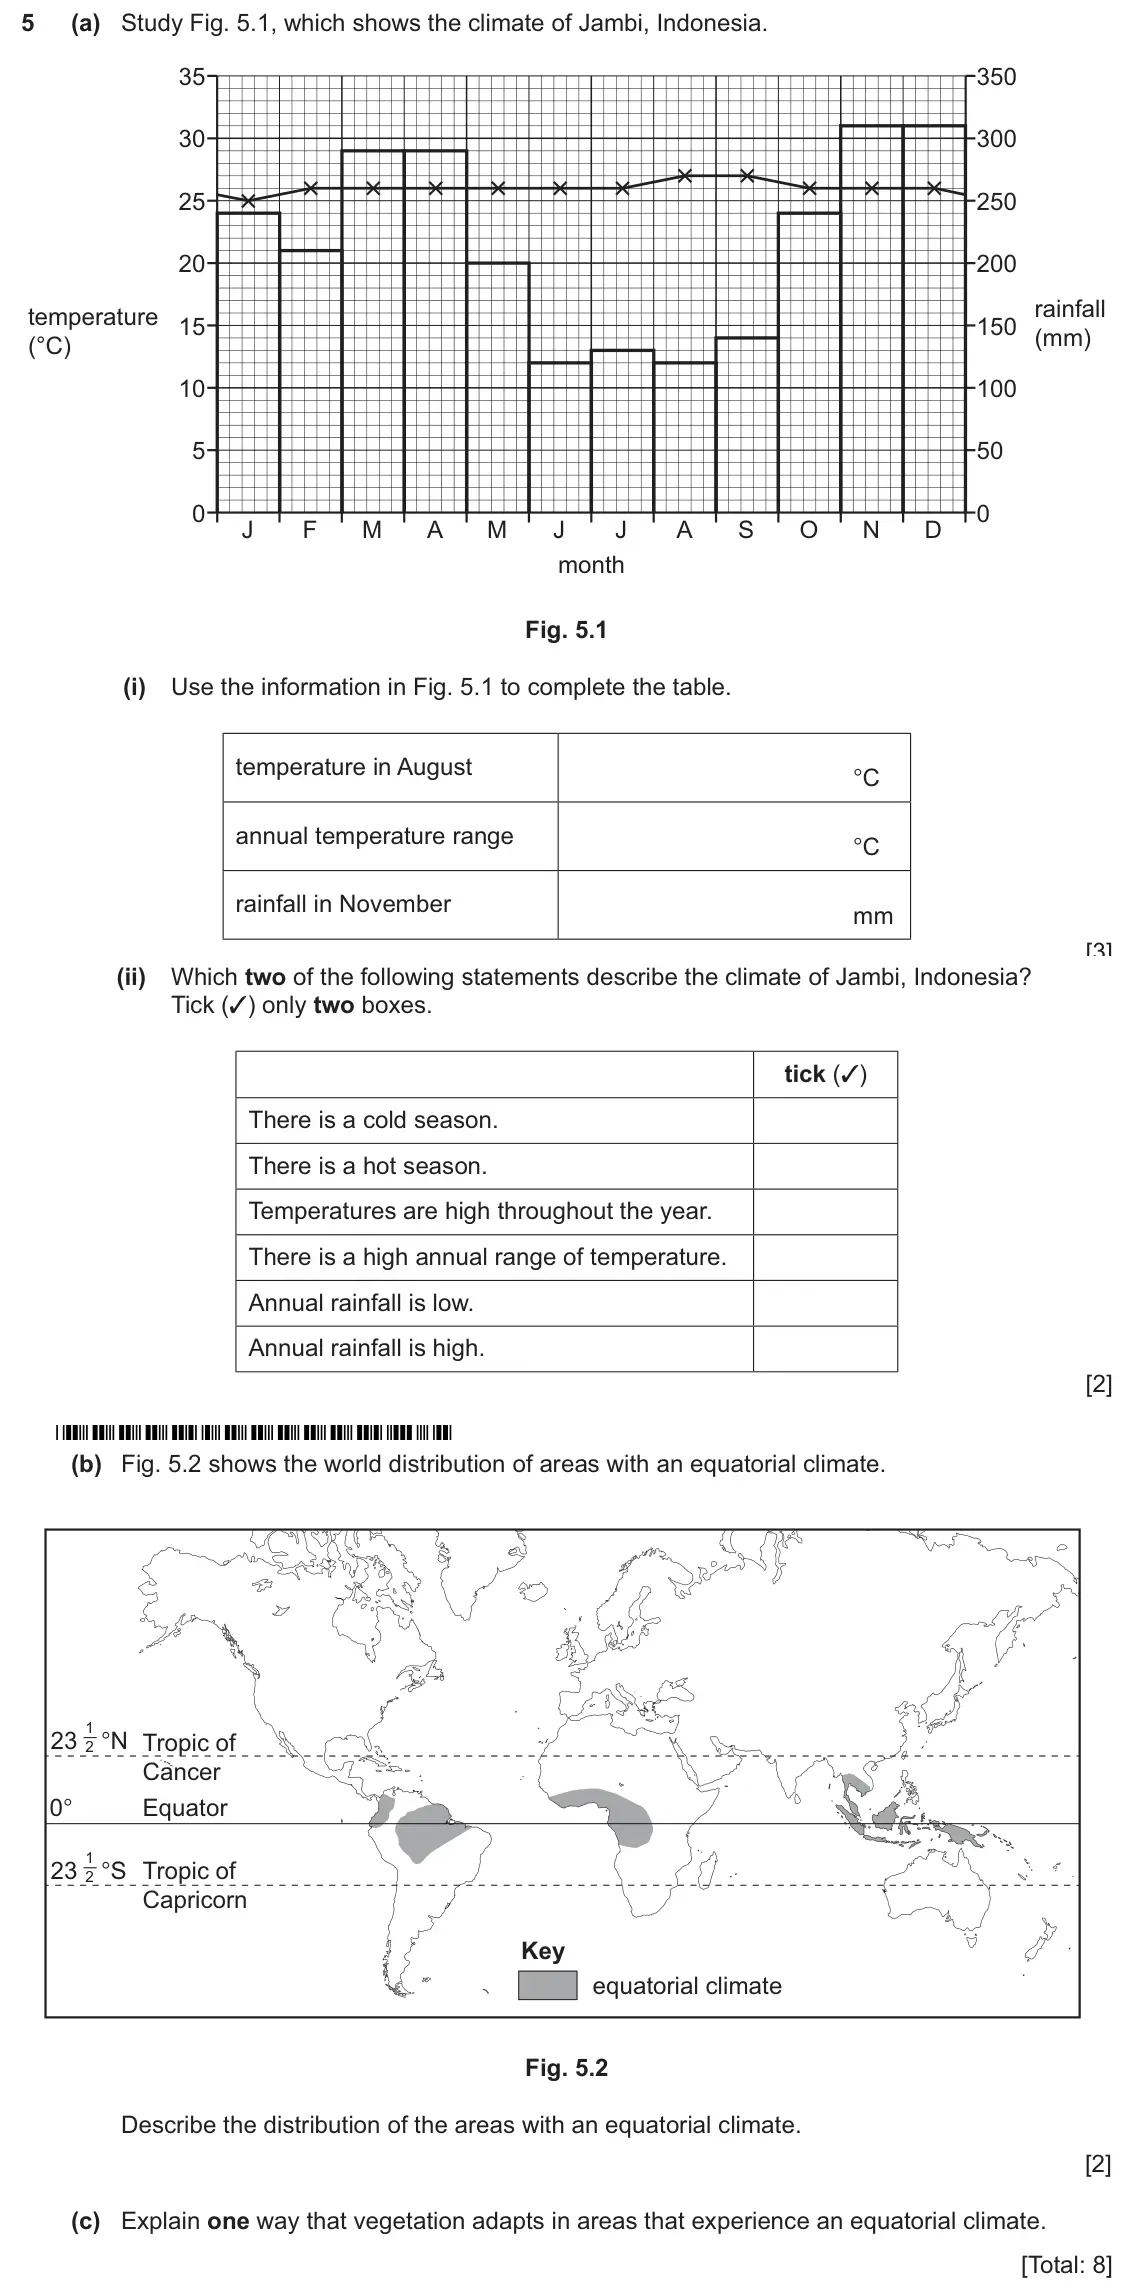
    Original question 5: (a) Study Fig. 5.1, which shows the climate of Jambi, Indonesia. 35 350 30 300 25 250 20 200 rainfall temperature 15 150 (mm) (°C) 10 100 5 50 0 0 J F M A M J J

    Loading the question…

  4. Q3

    June 2025 · Paper 1 (11)

    Sources (insert) ↗
    The whole paper ↗
    4
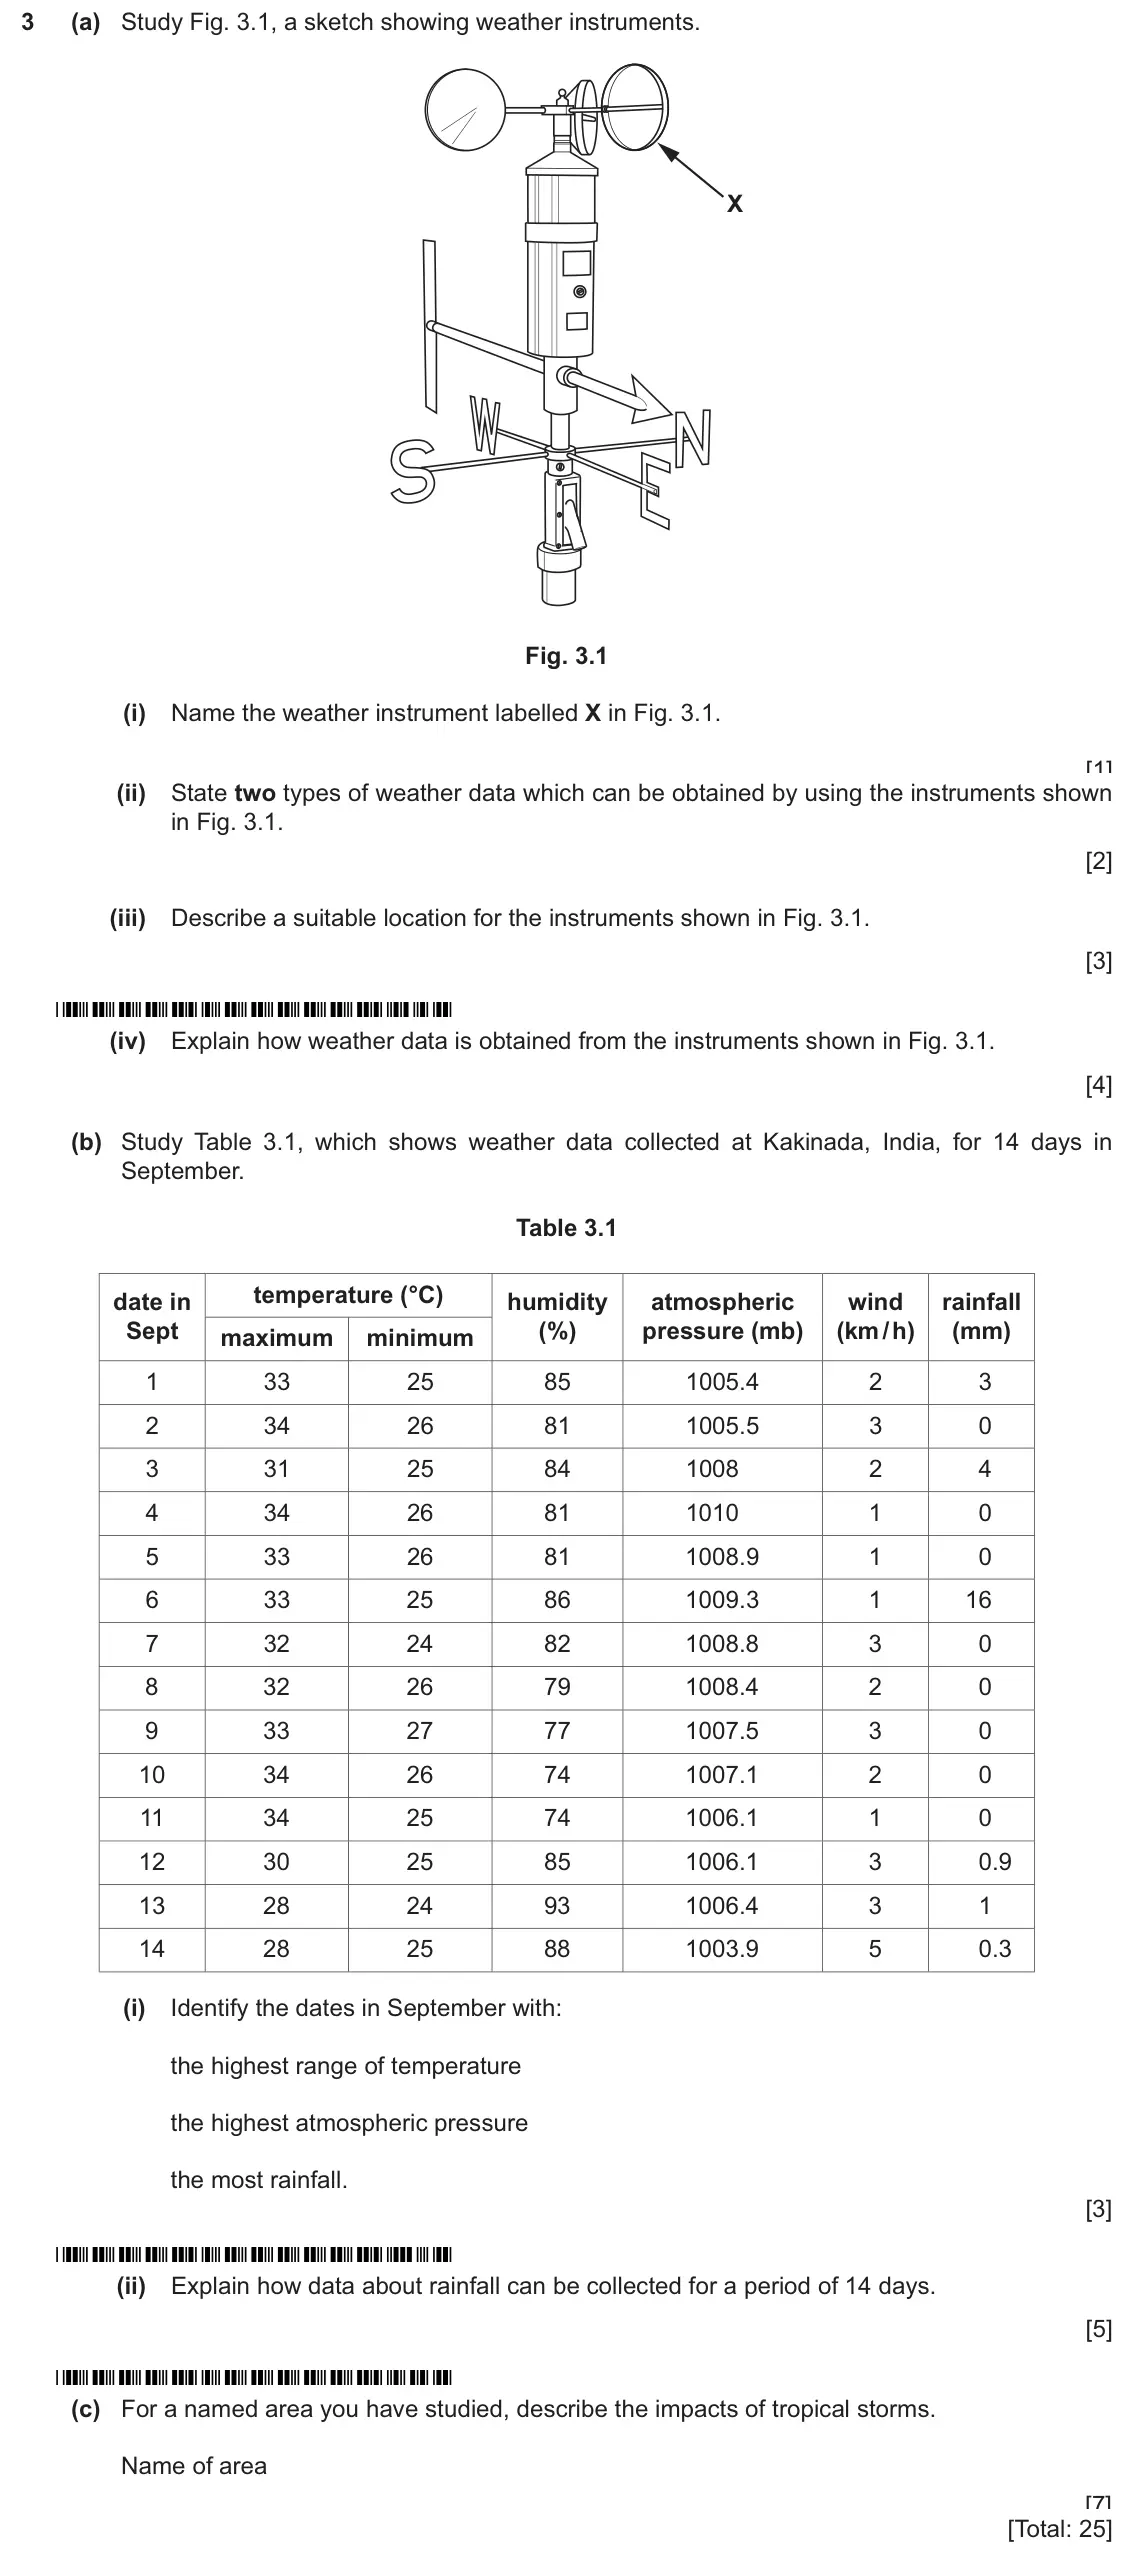
    Original question 3: (a) Study Fig. 3.1, a sketch showing weather instruments. X Fig. 3.1 (i) Name the weather instrument labelled X in Fig. 3.1. [1] (ii) State two types of weather

    Loading the question…

  5. Q4

    June 2025 · Paper 1 (13)

    Sources (insert) ↗
    The whole paper ↗
    5
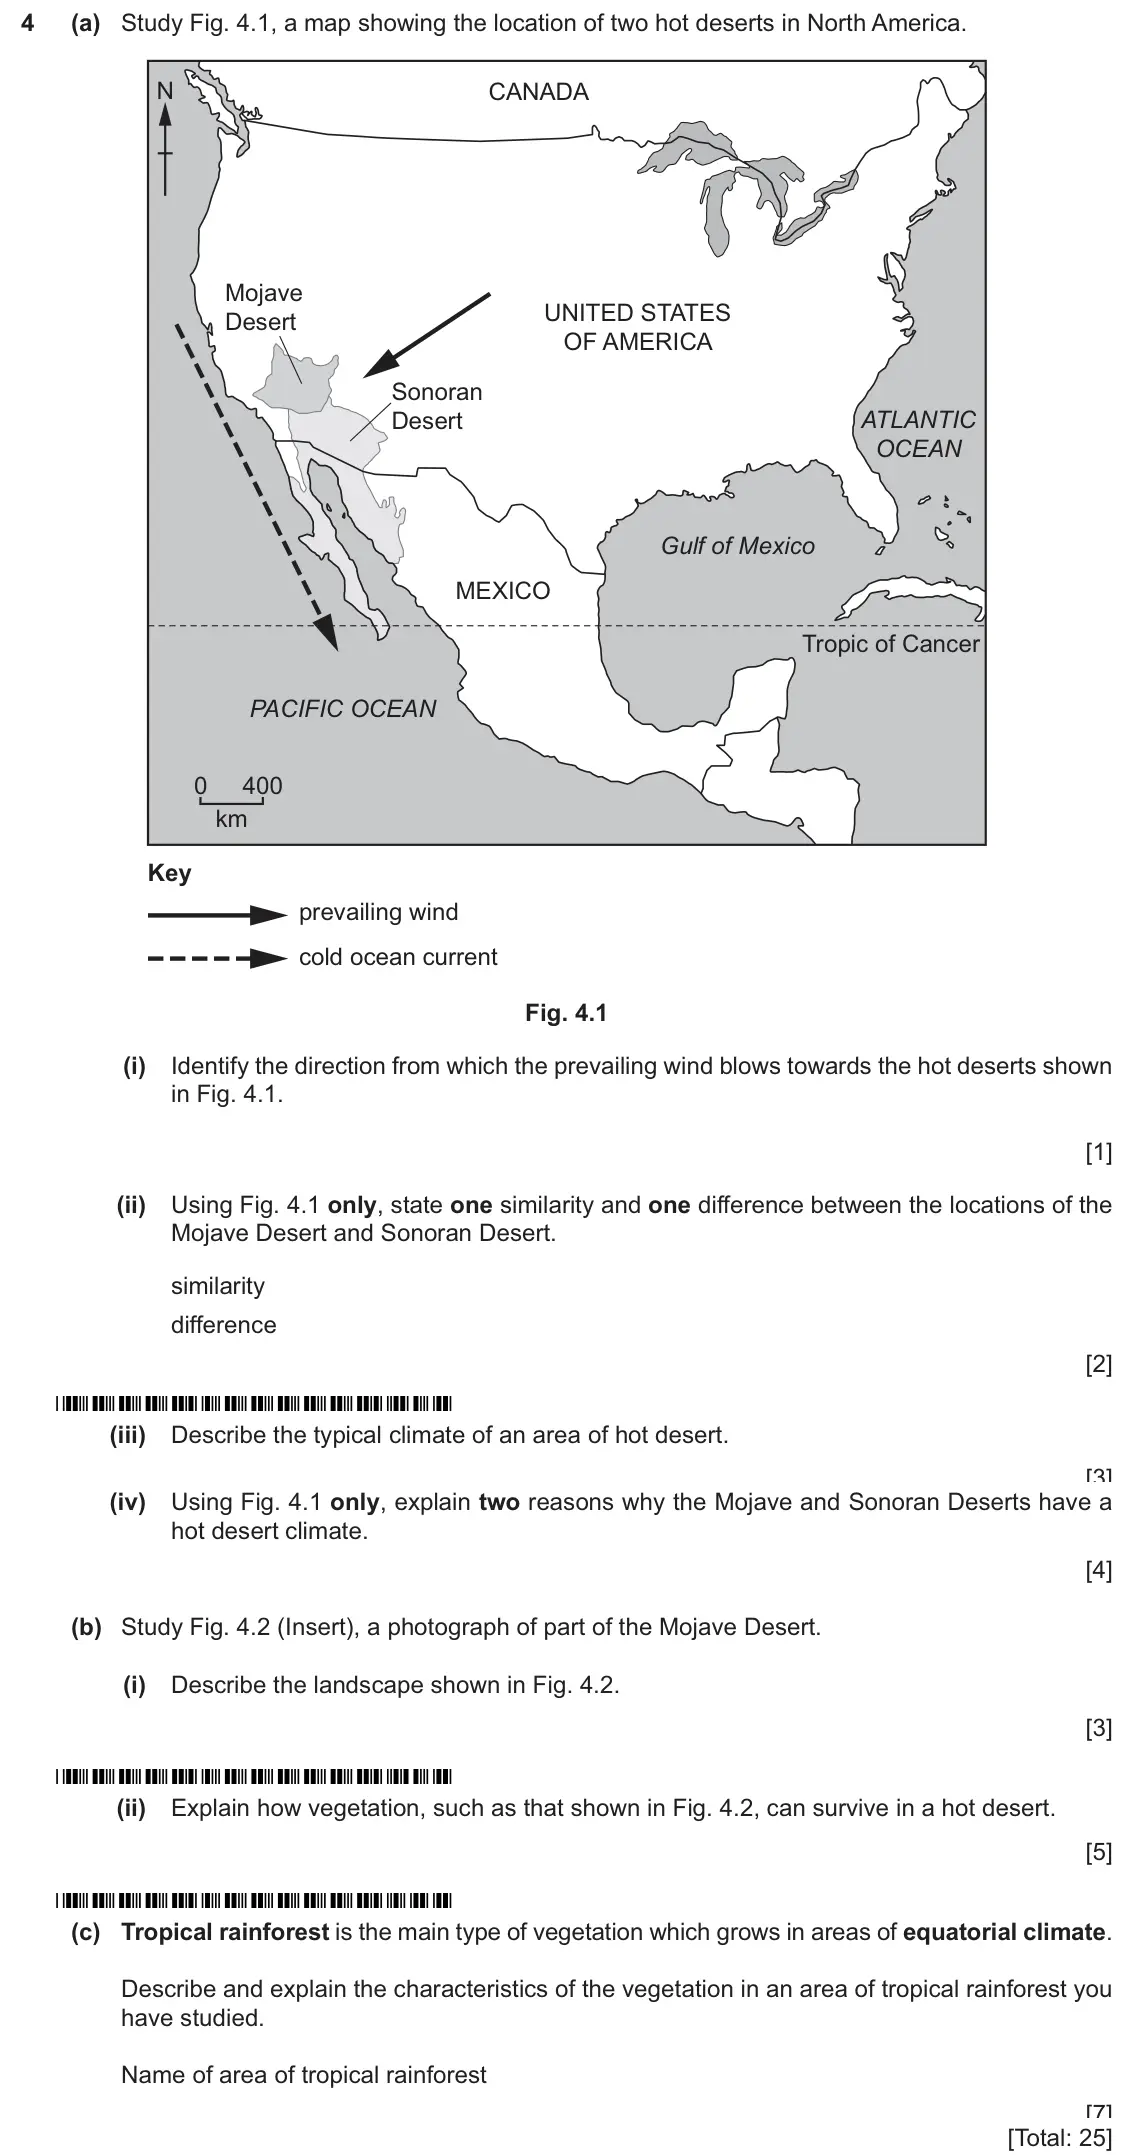
    Original question 4: (a) Study Fig. 4.1, a map showing the location of two hot deserts in North America. N CANADA Mojave UNITED STATES Desert OF AMERICA Sonoran Desert ATLANTIC OCEA

    Loading the question…

  6. Q5

    June 2025 · Paper 2 (21)

    Sources (insert) ↗
    The whole paper ↗
    6
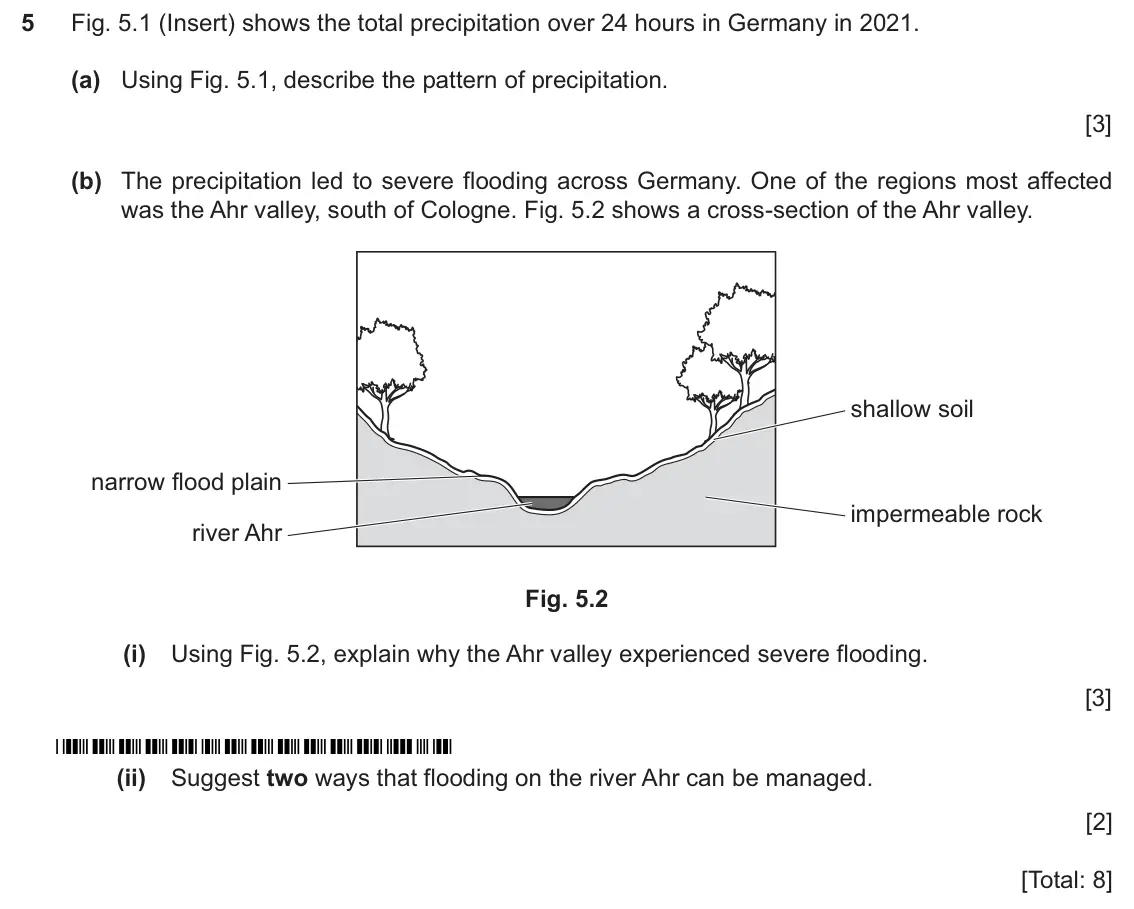
    Original question 5: Fig. 5.1 (Insert) shows the total precipitation over 24 hours in Germany in 2021. (a) Using Fig. 5.1, describe the pattern of precipitation. [3] (b) The precipi

    Loading the question…

  7. Q4

    June 2025 · Paper 2 (23)

    Sources (insert) ↗
    The whole paper ↗
    7
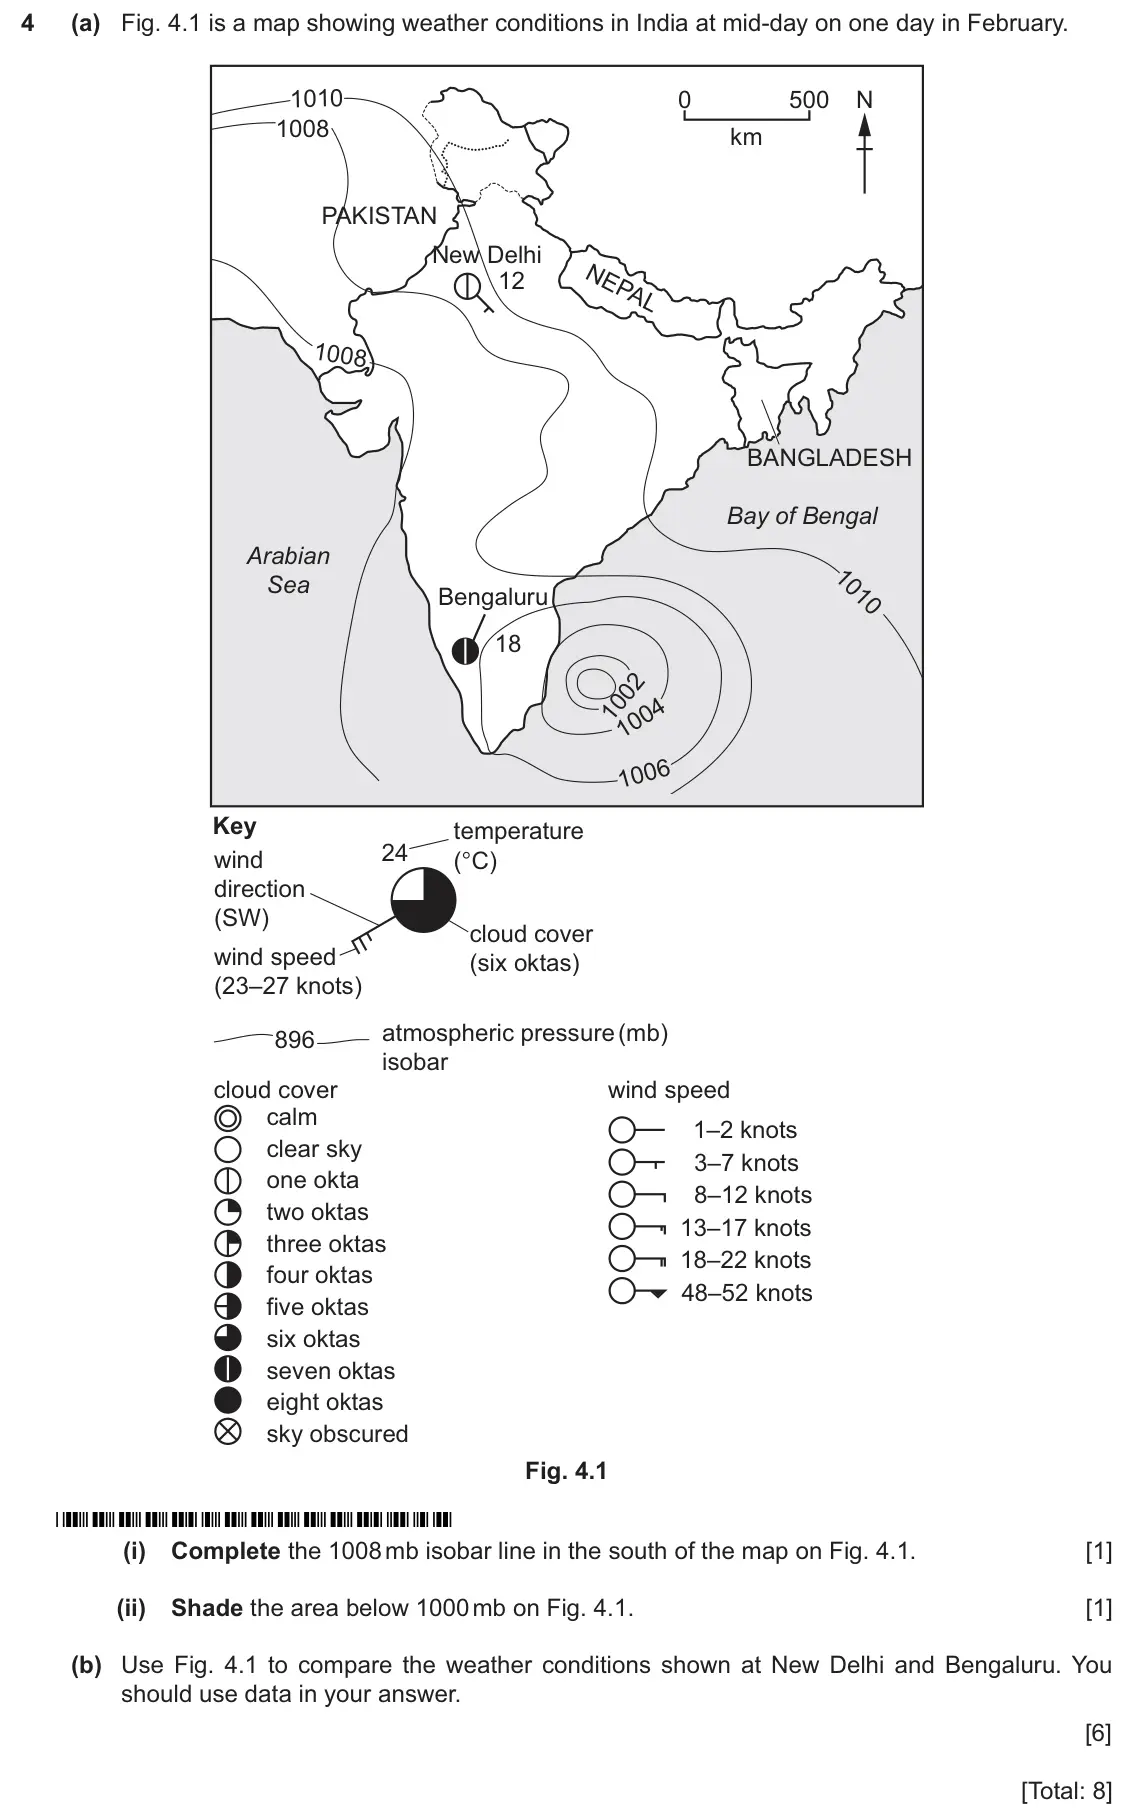
    Original question 4: (a) Fig. 4.1 is a map showing weather conditions in India at mid-day on one day in February. 1010 0 500 N 1008 km PAKISTAN New Delhi 12 1008 BANGLADESH Bay of B

    Loading the question…

  8. Q1

    June 2025 · Paper 4 (42)

    Sources (insert) ↗
    The whole paper ↗
    8
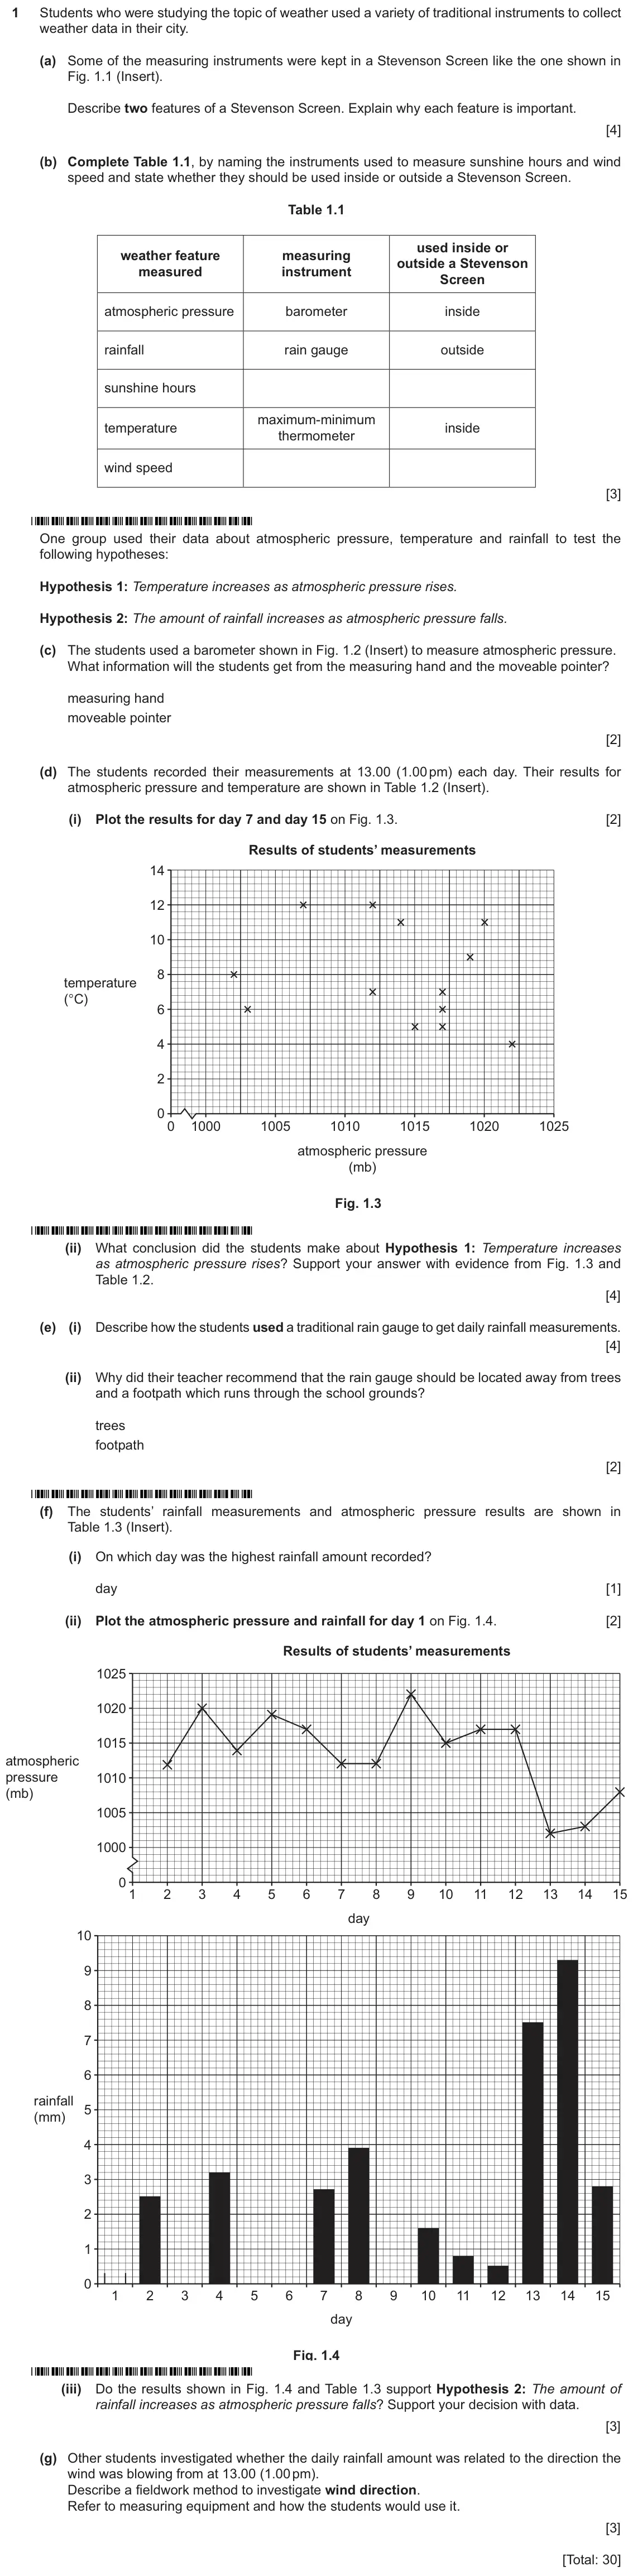
    Original question 1: Students who were studying the topic of weather used a variety of traditional instruments to collect weather data in their city. (a) Some of the measuring instr

    Loading the question…

  9. Q5

    June 2024 (9–1 variant) · Paper 2

    The whole paper ↗
    9
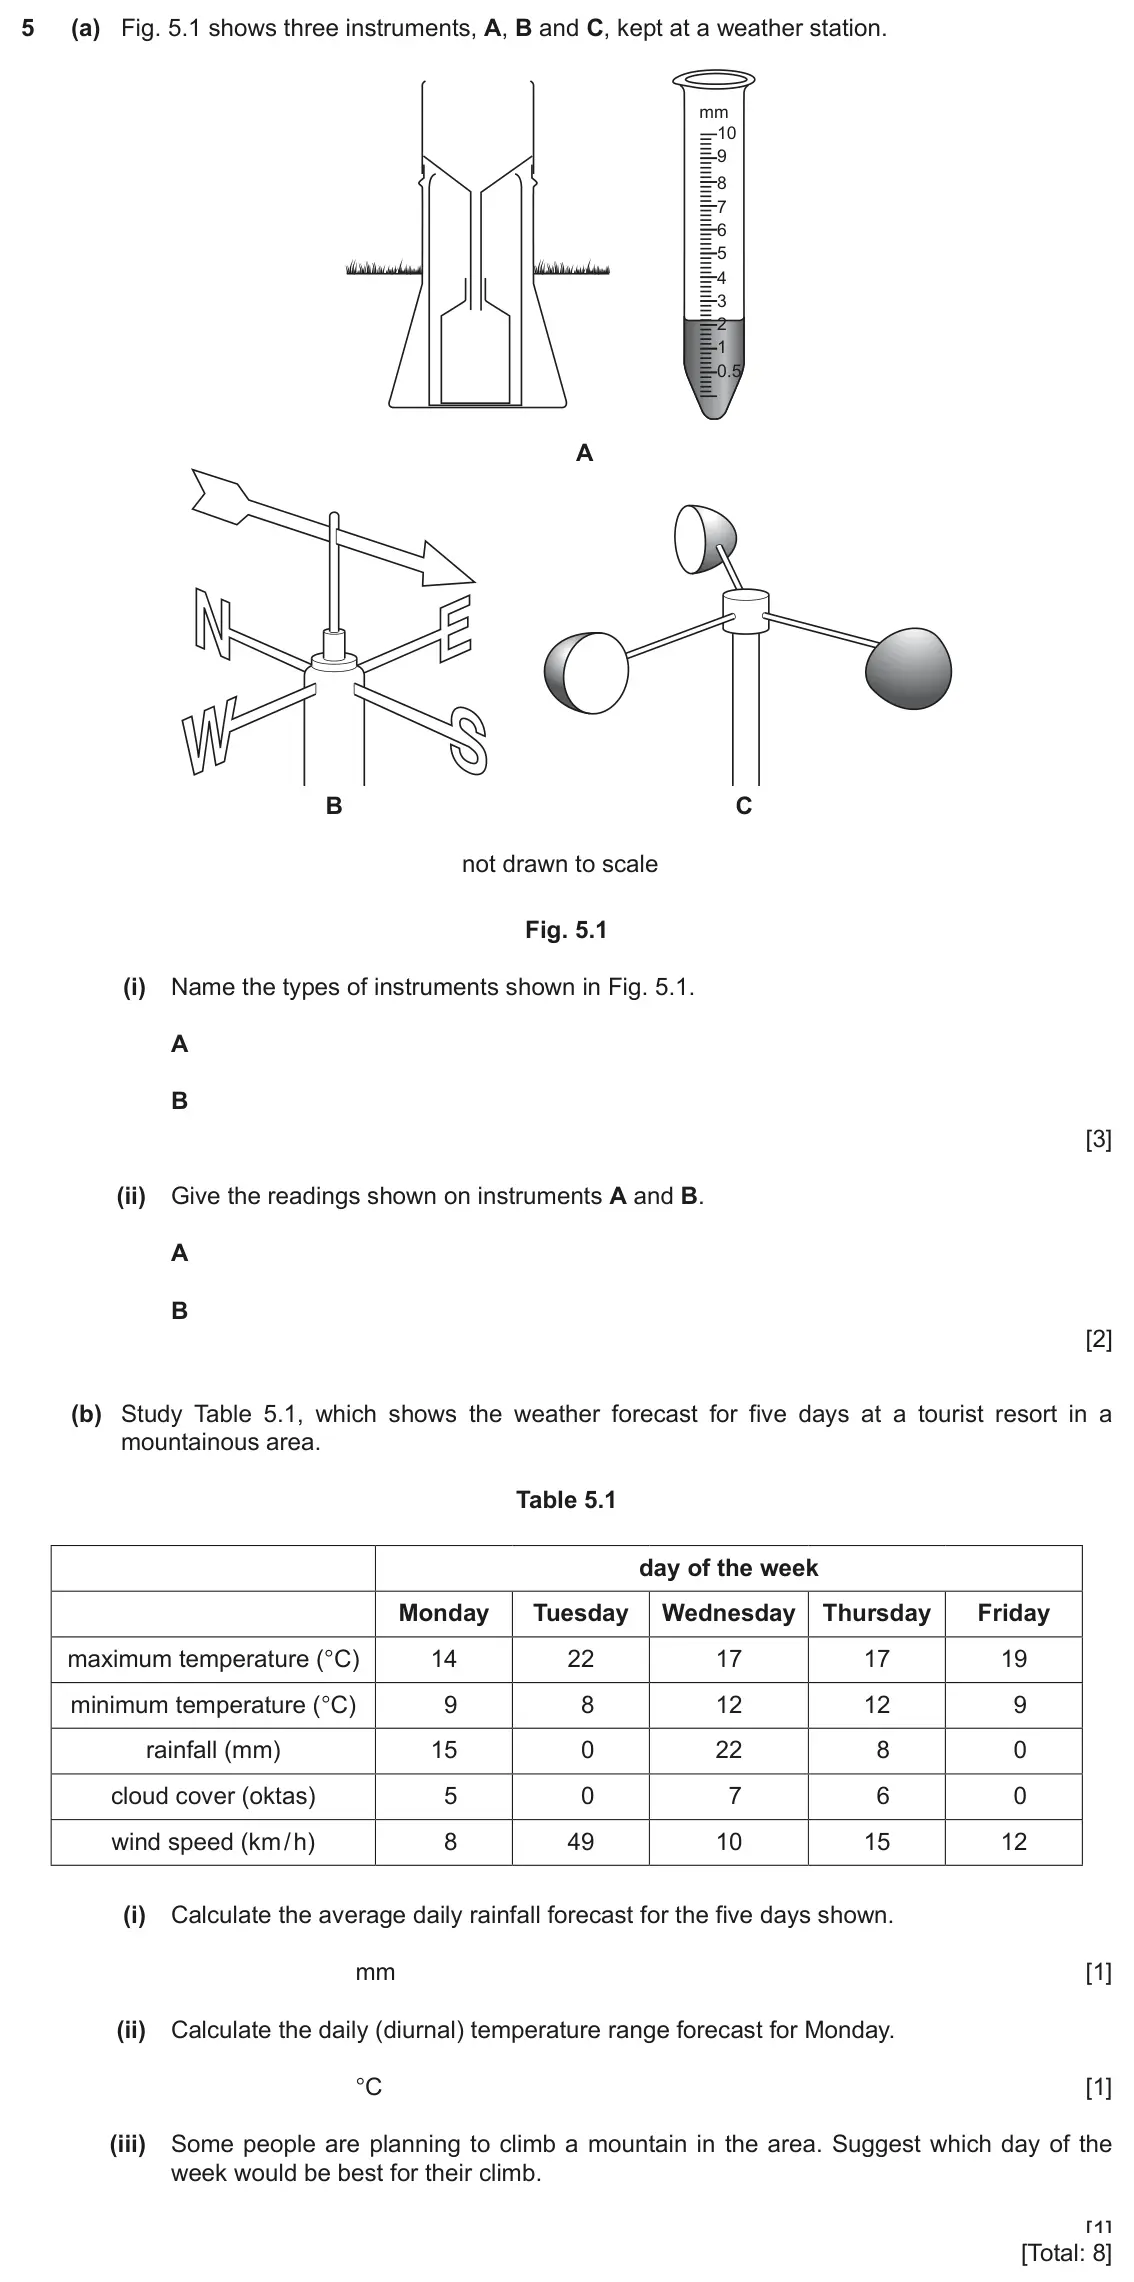
    Original question 5: (a) Fig. 5.1 shows three instruments, A, B and C, kept at a weather station. mm 10 9 8 7 6 5 4 3 2 1 0.5 A B C not drawn to scale Fig. 5.1 (i) Name the types of

    Loading the question…

  10. Q4

    2020 specimen · Paper 1

    Sources (insert) ↗
    The whole paper ↗
    10
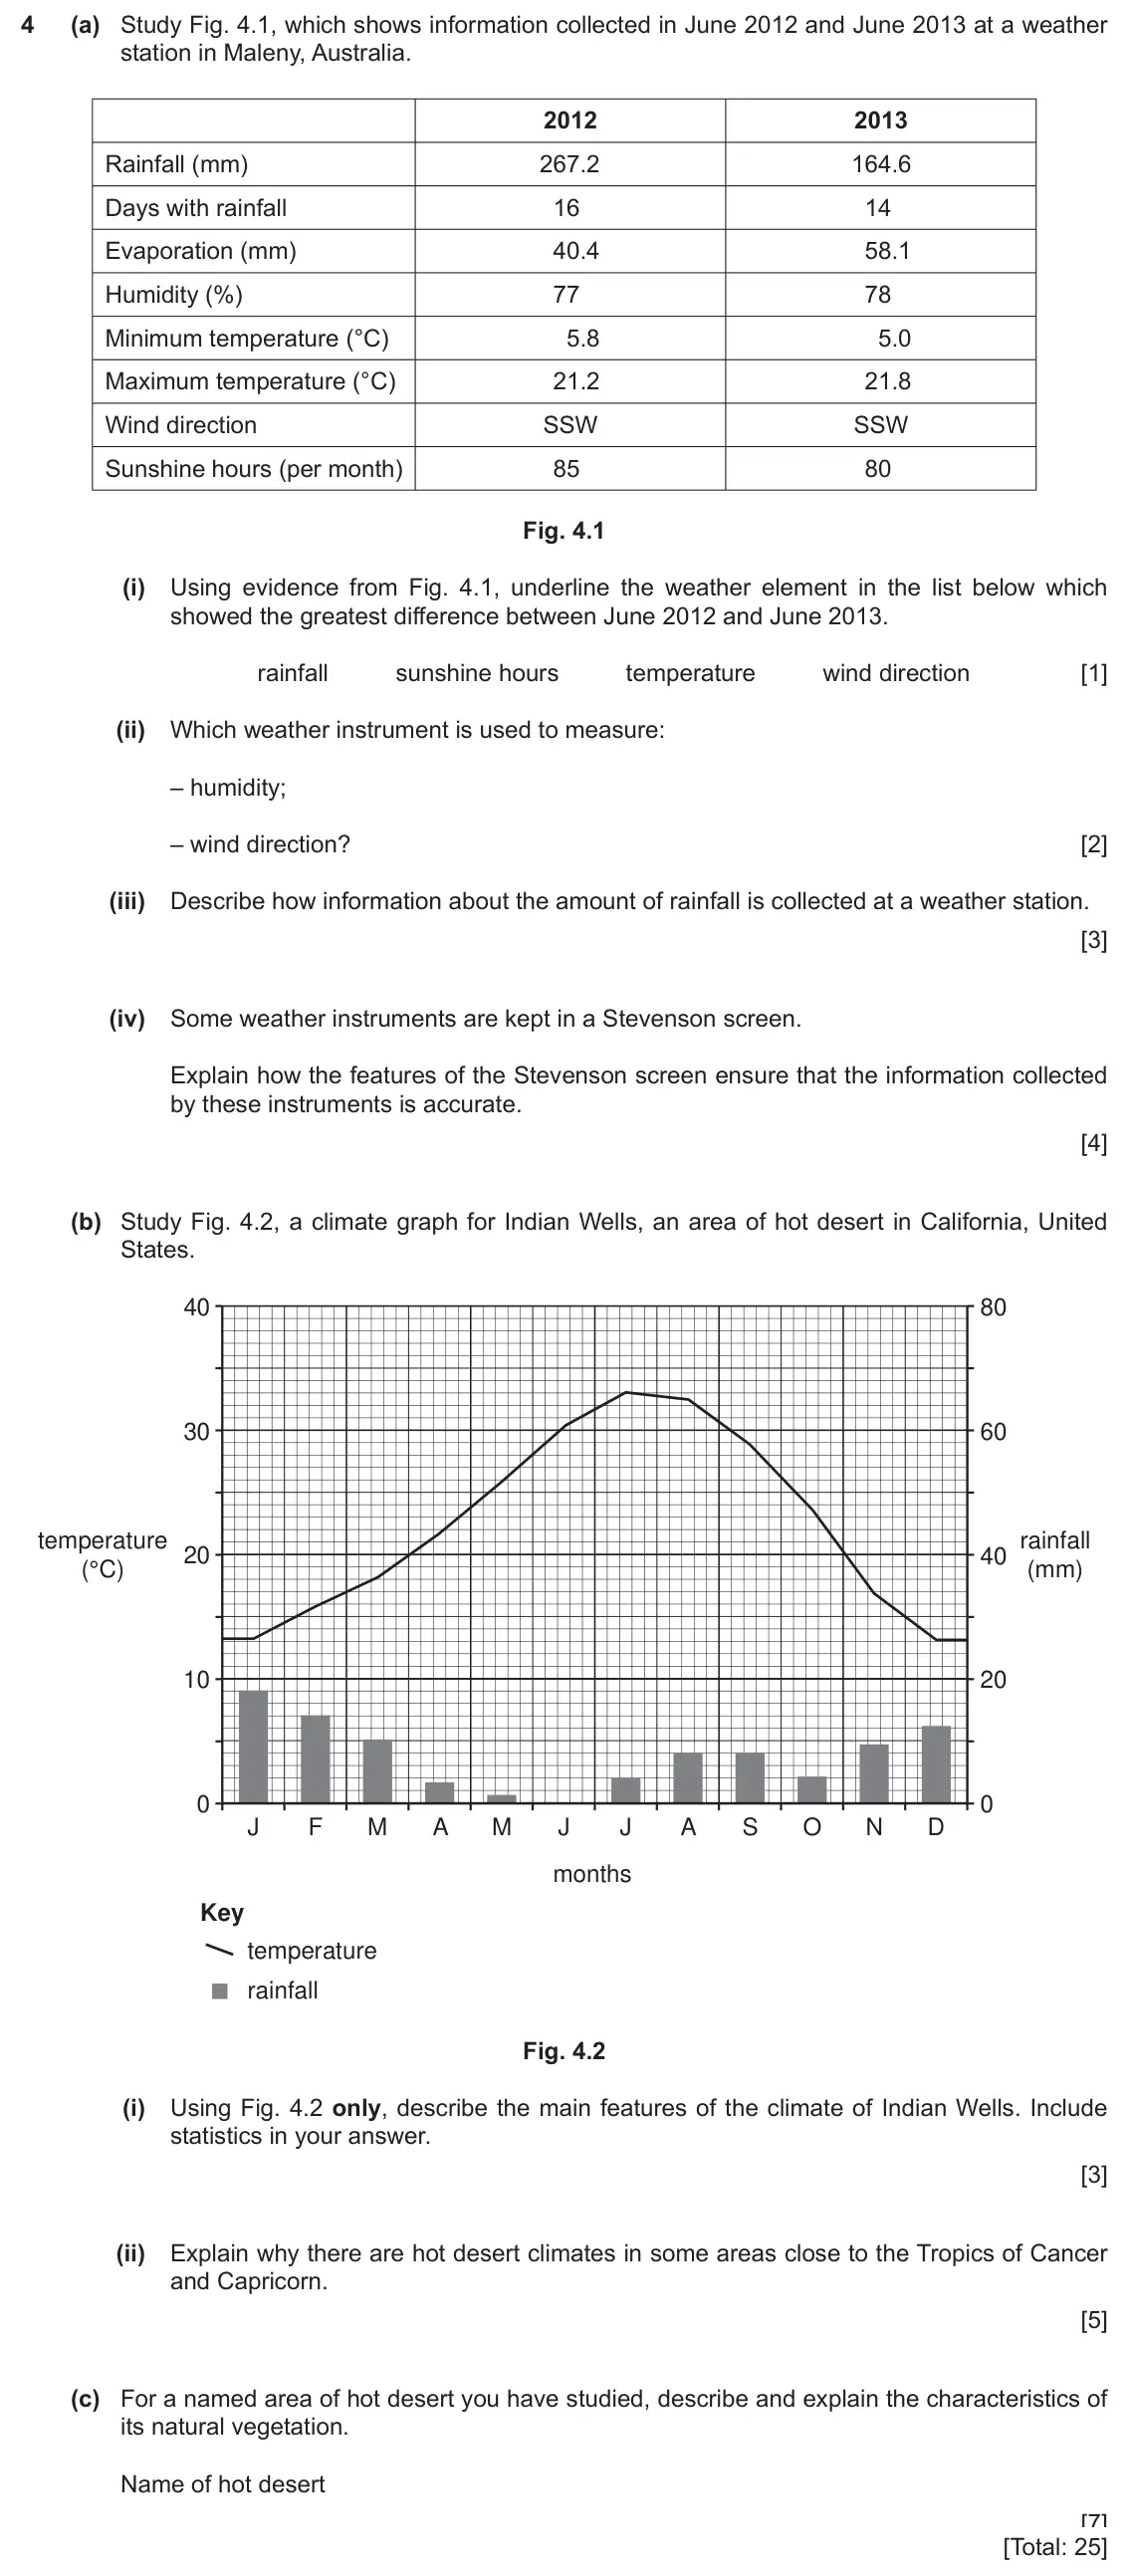
    Original question 4: (a) Study Fig. 4.1, which shows information collected in June 2012 and June 2013 at a weather station in Maleny, Australia. 2012 2013 Rainfall (mm) 267.2 164.6

    Loading the question…

  11. Q2

    2027 specimen · Paper 1

    Sources (insert) ↗
    The whole paper ↗
    11
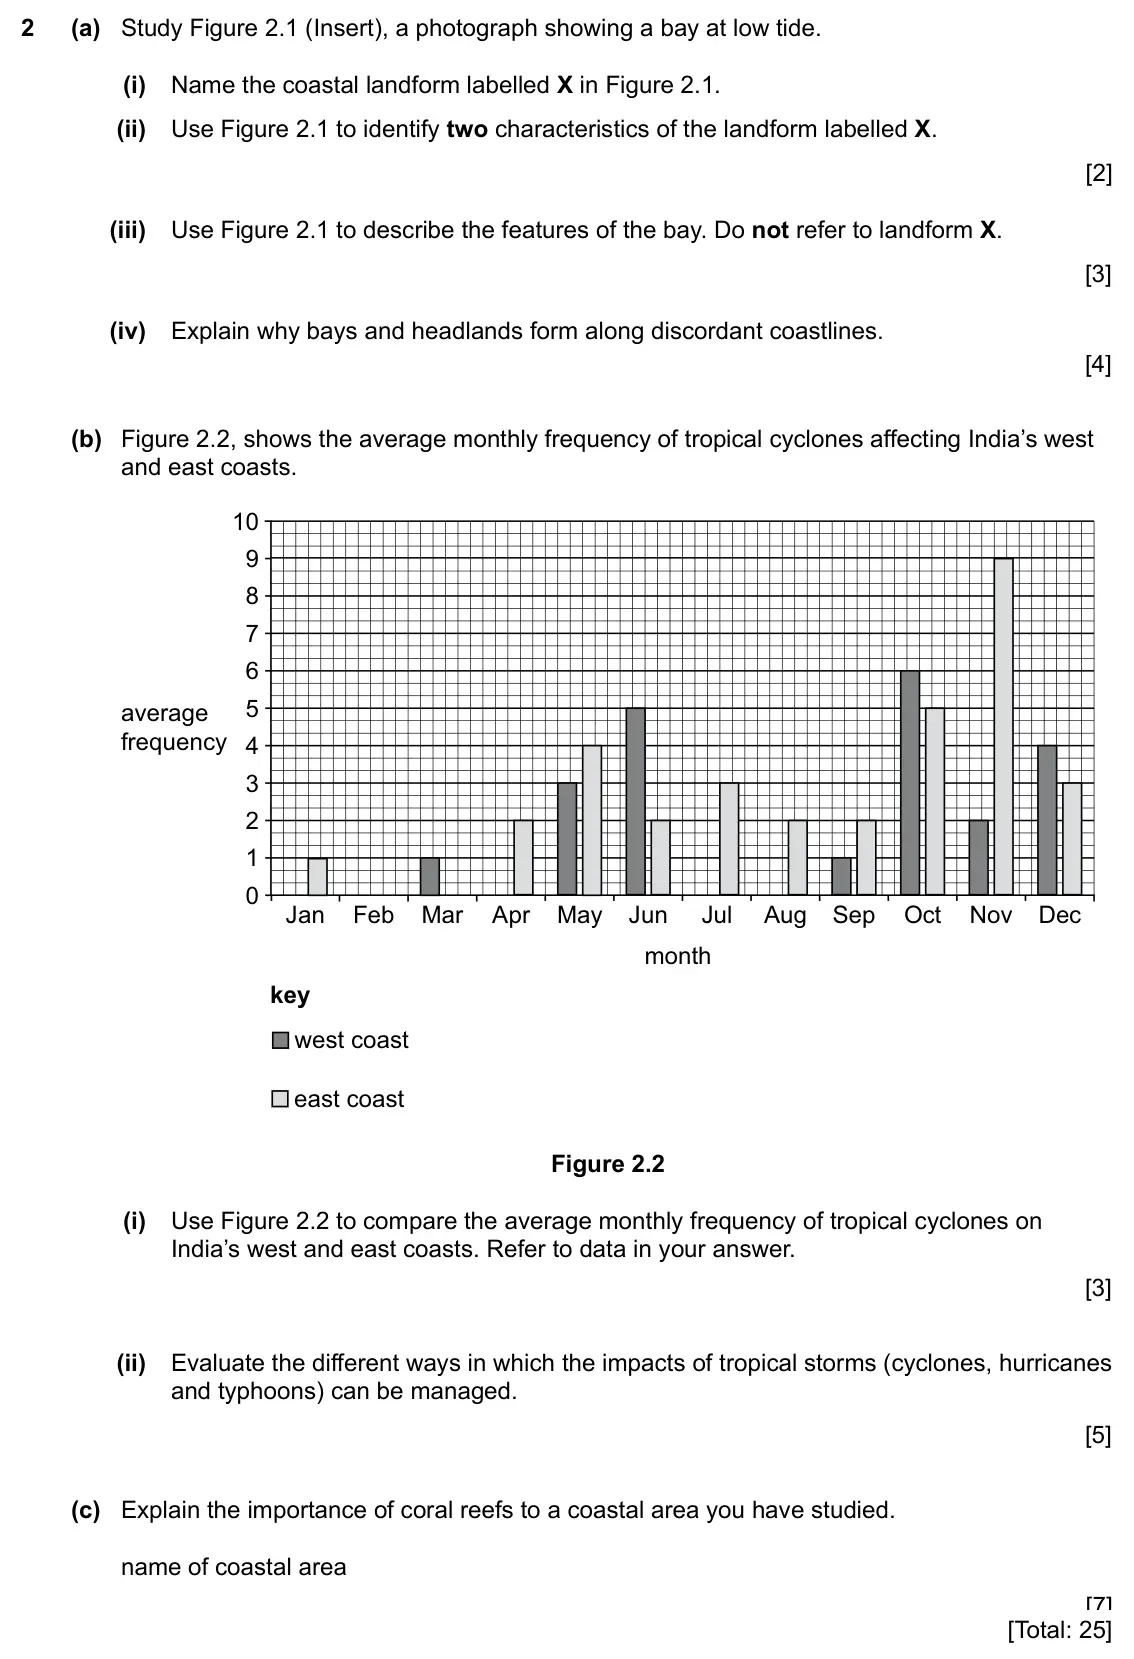
    Original question 2: (a) Study Figure 2.1 (Insert), a photograph showing a bay at low tide. (i) Name the coastal landform labelled X in Figure 2.1. [1] (ii) Use Figure 2.1 to identi

    Loading the question…

  12. Q3

    2027 specimen · Paper 1

    Sources (insert) ↗
    The whole paper ↗
    12
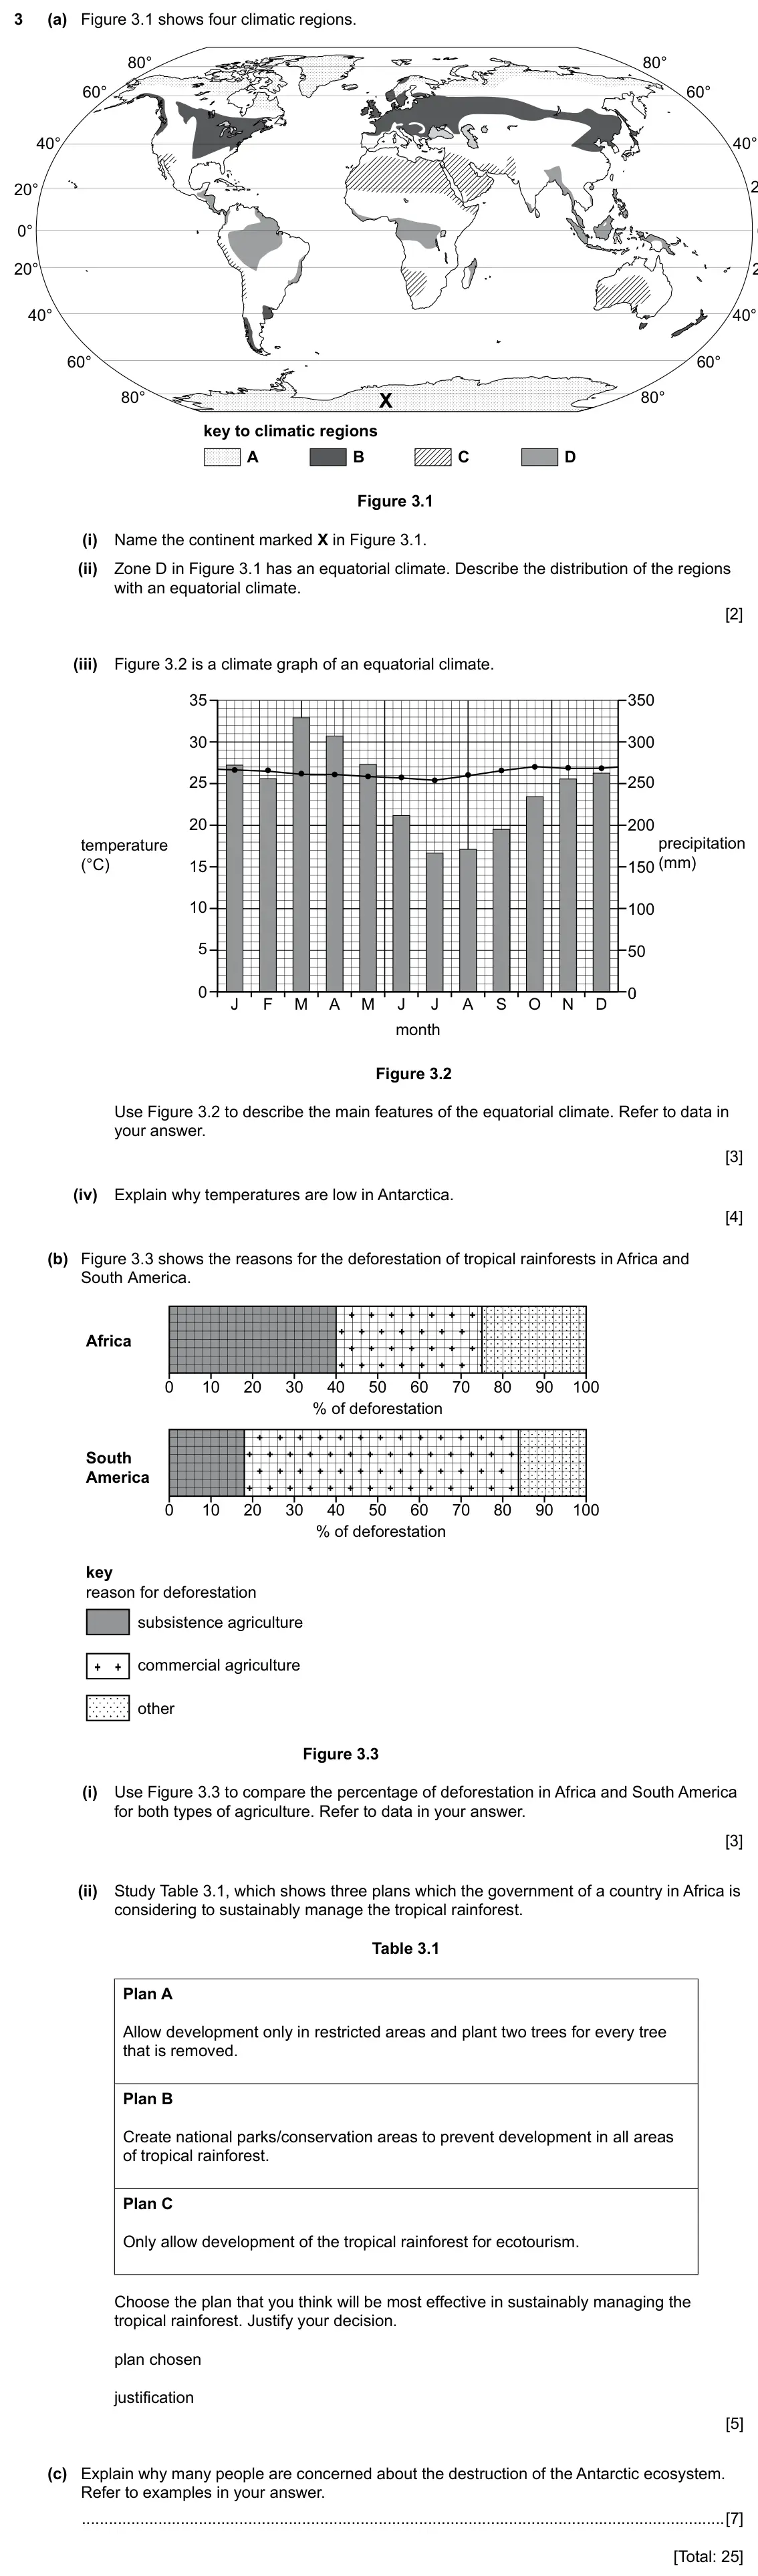
    Original question 3: (a) Figure 3.1 shows four climatic regions. 80° 80° 60° 60° 40° 40° 20° 0° 20° 40° 40° 60° 60° 80° X 80° key to climatic regions A B C D Figure 3.1 (i) Name the

    Loading the question…

  13. Q4

    2027 specimen · Paper 1

    Sources (insert) ↗
    The whole paper ↗
    13
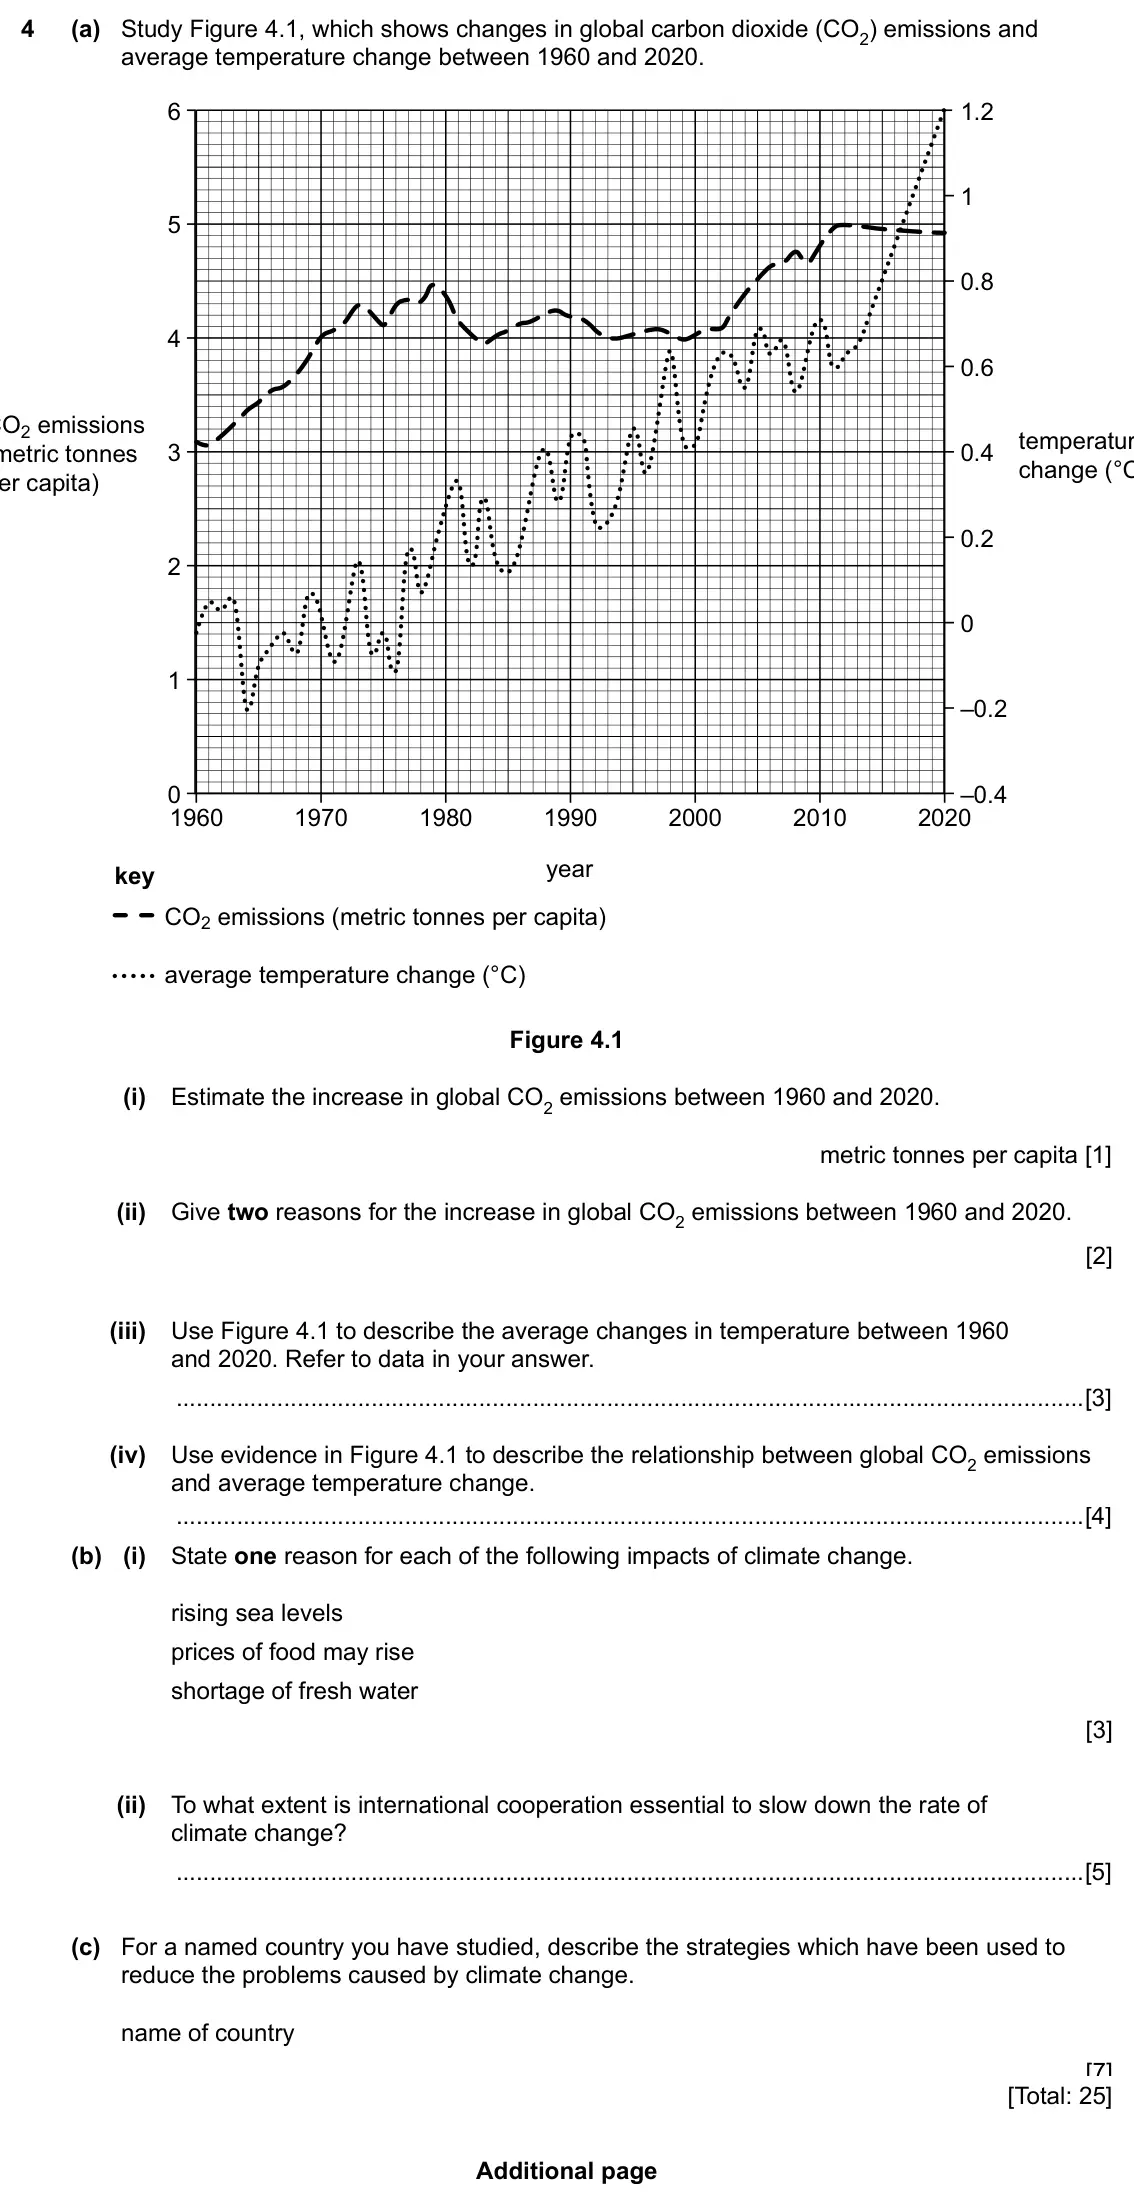
    Original question 4: (a) Study Figure 4.1, which shows changes in global carbon dioxide (CO2) emissions and average temperature change between 1960 and 2020. 6 1.2 1 5 0.8 4 0.6 CO2

    Loading the question…

All 13 questions on Weather and climate, as a list
  1. March 2026, Paper 4 (42), Q1 (30 marks): Geography students in Wellington, New Zealand, did some fieldwork to investigate local weather. They used measuring equipment to collect data on 15 days in Sept
  2. November 2025, Paper 2 (21), Q2 (8 marks): (a) Fig. 2.1 shows the climate of the Atacama hot desert in Chile. 30 30 temperature rainfall 20 20 (°C) (mm) 10 10 0 0 J F M A M J J A S O N D month Fig. 2.1 (
  3. November 2025, Paper 2 (23), Q5 (8 marks): (a) Study Fig. 5.1, which shows the climate of Jambi, Indonesia. 35 350 30 300 25 250 20 200 rainfall temperature 15 150 (mm) (°C) 10 100 5 50 0 0 J F M A M J J
  4. June 2025, Paper 1 (11), Q3 (25 marks): (a) Study Fig. 3.1, a sketch showing weather instruments. X Fig. 3.1 (i) Name the weather instrument labelled X in Fig. 3.1. [1] (ii) State two types of weather
  5. June 2025, Paper 1 (13), Q4 (25 marks): (a) Study Fig. 4.1, a map showing the location of two hot deserts in North America. N CANADA Mojave UNITED STATES Desert OF AMERICA Sonoran Desert ATLANTIC OCEA
  6. June 2025, Paper 2 (21), Q5 (8 marks): Fig. 5.1 (Insert) shows the total precipitation over 24 hours in Germany in 2021. (a) Using Fig. 5.1, describe the pattern of precipitation. [3] (b) The precipi
  7. June 2025, Paper 2 (23), Q4 (8 marks): (a) Fig. 4.1 is a map showing weather conditions in India at mid-day on one day in February. 1010 0 500 N 1008 km PAKISTAN New Delhi 12 1008 BANGLADESH Bay of B
  8. June 2025, Paper 4 (42), Q1 (30 marks): Students who were studying the topic of weather used a variety of traditional instruments to collect weather data in their city. (a) Some of the measuring instr
  9. June 2024 (9–1 variant), Paper 2, Q5 (8 marks): (a) Fig. 5.1 shows three instruments, A, B and C, kept at a weather station. mm 10 9 8 7 6 5 4 3 2 1 0.5 A B C not drawn to scale Fig. 5.1 (i) Name the types of
  10. 2020 specimen, Paper 1, Q4 (25 marks): (a) Study Fig. 4.1, which shows information collected in June 2012 and June 2013 at a weather station in Maleny, Australia. 2012 2013 Rainfall (mm) 267.2 164.6
  11. 2027 specimen, Paper 1, Q2 (25 marks): (a) Study Figure 2.1 (Insert), a photograph showing a bay at low tide. (i) Name the coastal landform labelled X in Figure 2.1. [1] (ii) Use Figure 2.1 to identi
  12. 2027 specimen, Paper 1, Q3 (25 marks): (a) Figure 3.1 shows four climatic regions. 80° 80° 60° 60° 40° 40° 20° 0° 20° 40° 40° 60° 60° 80° X 80° key to climatic regions A B C D Figure 3.1 (i) Name the
  13. 2027 specimen, Paper 1, Q4 (25 marks): (a) Study Figure 4.1, which shows changes in global carbon dioxide (CO2) emissions and average temperature change between 1960 and 2020. 6 1.2 1 5 0.8 4 0.6 CO2

Questions, mark schemes and examiner’s reports are © Cambridge University Press & Assessment, from their published past papers. Plumi isn’t affiliated with any exam board. Want whole papers? CAIE IGCSE Geography past papers.

The Plumi iPad app also offers exam-style questions with AI feedback on your handwritten working.