 plumi
Population and migration: CAIE IGCSE Geography questions
CAIE IGCSE Geography past-paper questions on Population and migration, June 2024, June and November 2025, March 2026, a 9–1 variant, and the 2020 and 2027 specimens, with mark schemes and examiner’s reports where available.
Paper
All papers
Exam
All years
Calculations
Loading the full question list…
- 1
- 2
- 3
- 4
- 5
- 6
- 7
- 8
- 9
- 10
- 11
- 12
- 13
- 14
- 15
- 16
- 17
- 18
- 19
All 19 questions on Population and migration, as a list
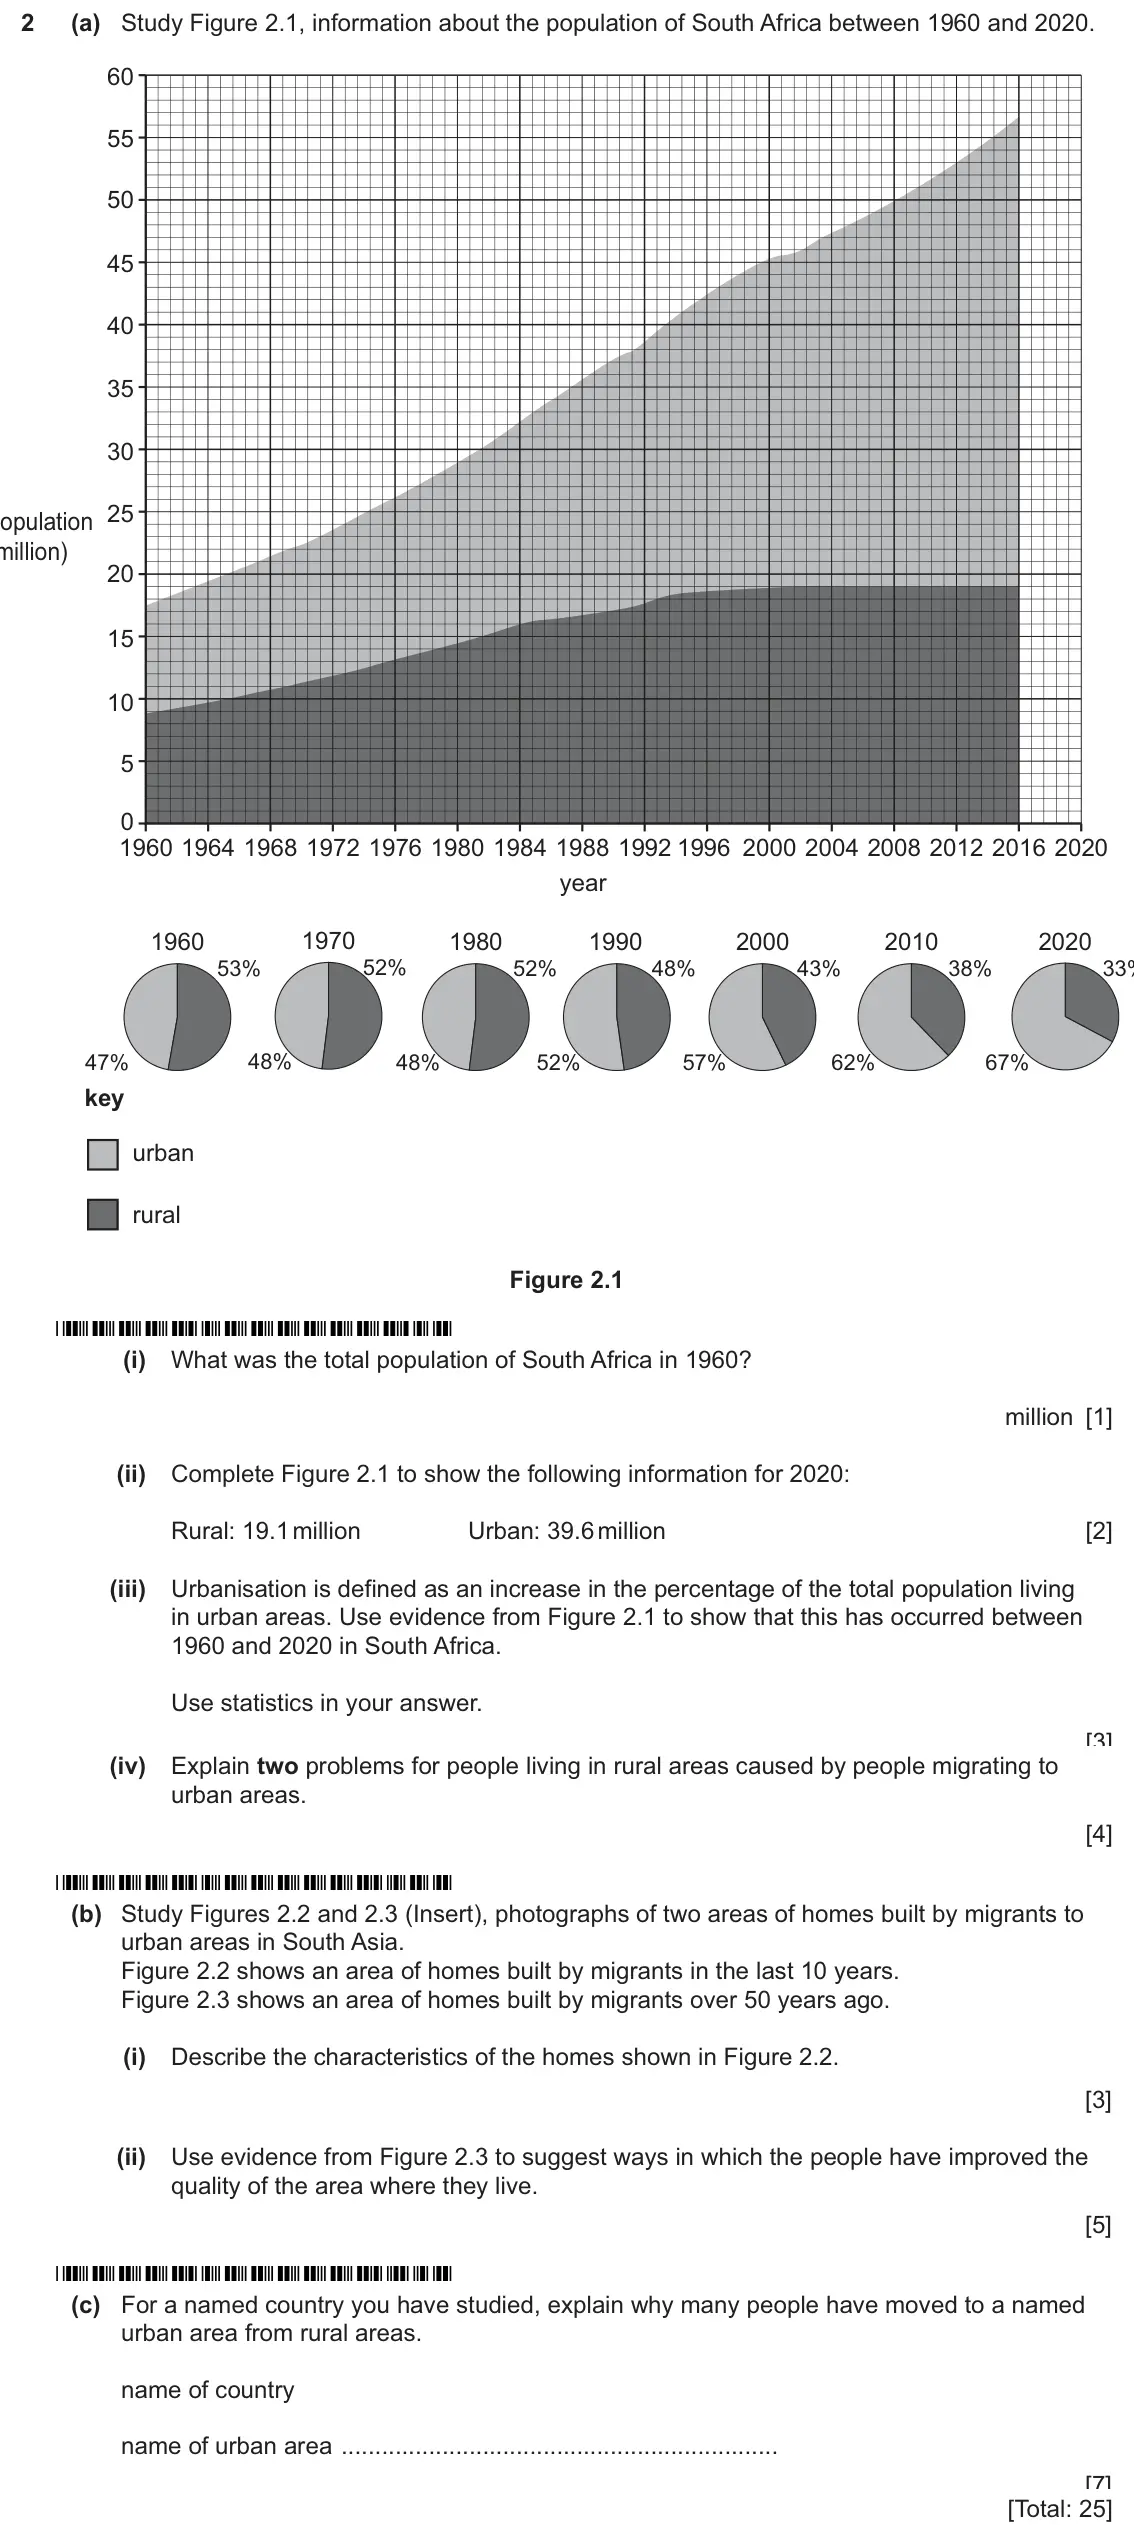
- March 2026, Paper 1 (12), Q2 (25 marks): (a) Study Figure 2.1, information about the population of South Africa between 1960 and 2020. 60 55 50 45 40 35 30 25 population (million) 20 15 10 5 0 1960 196
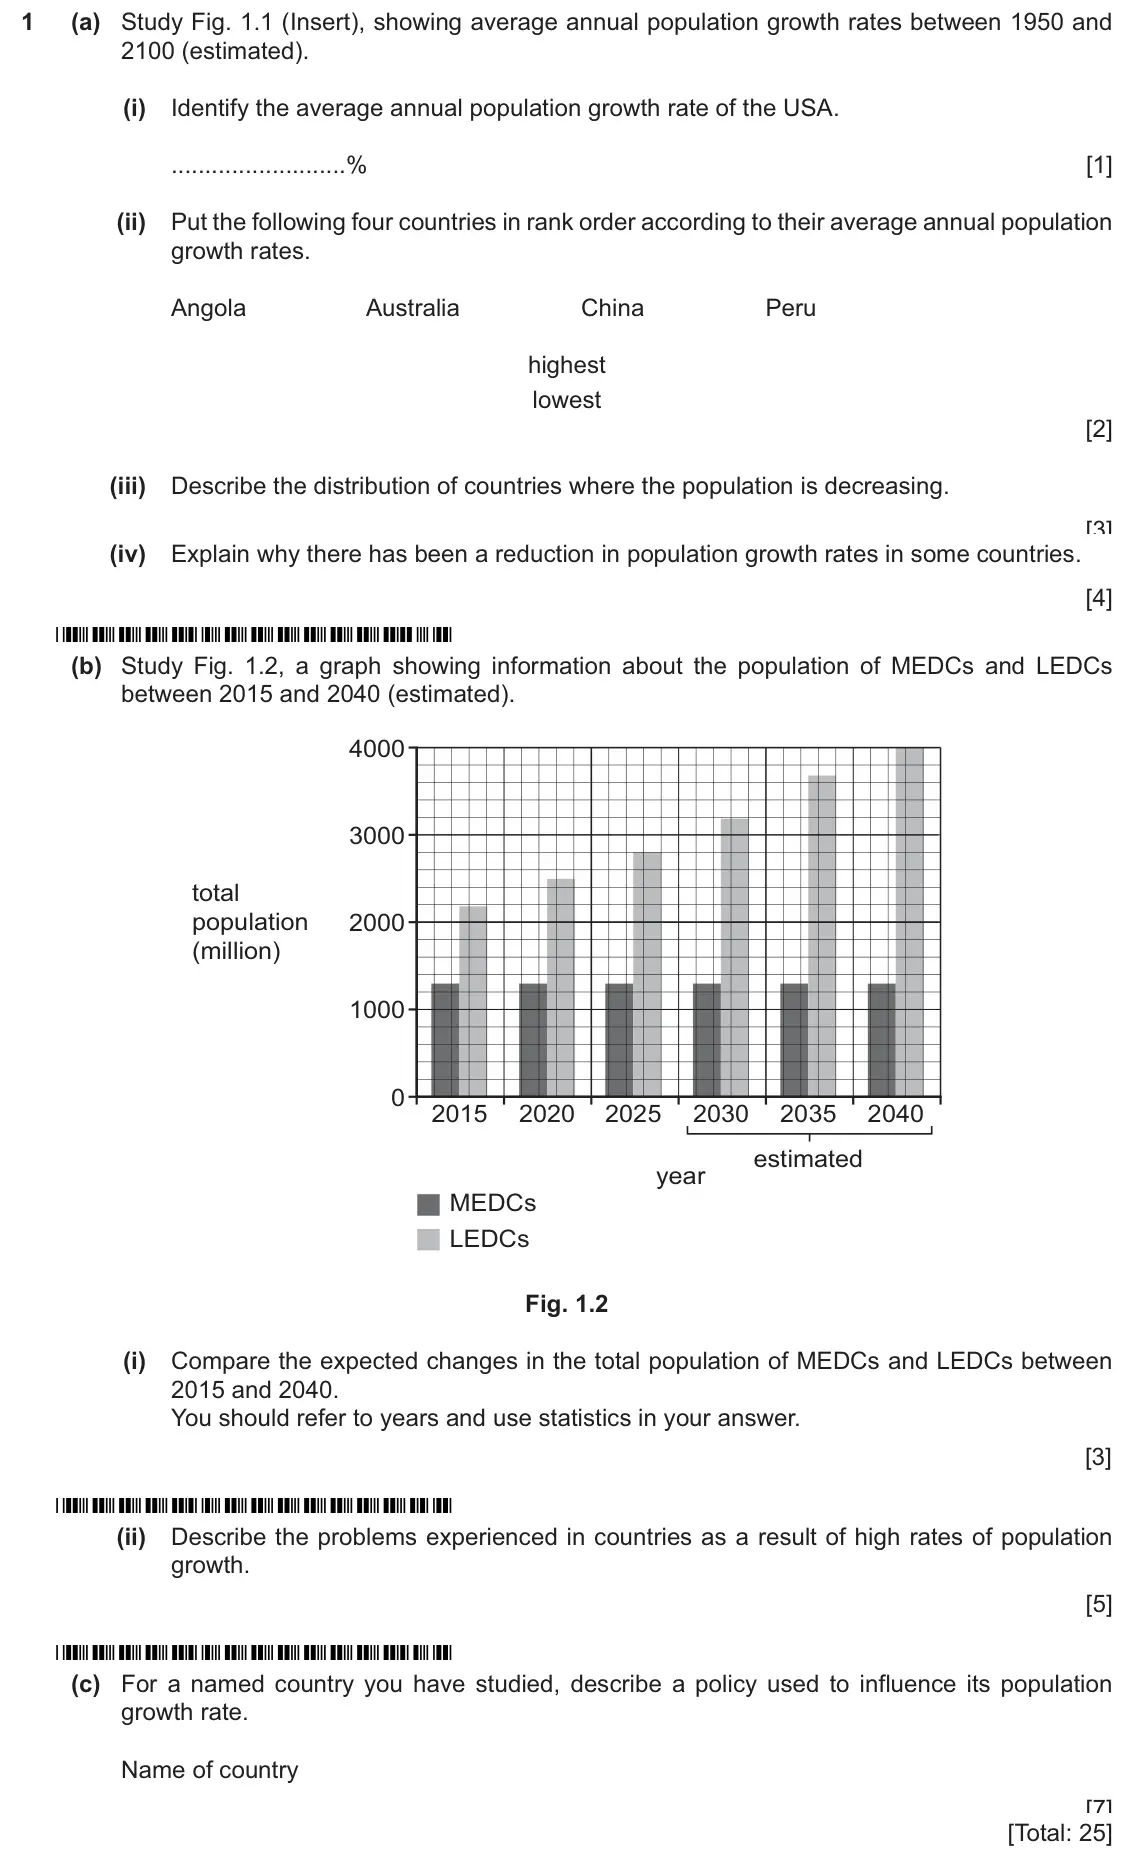
- November 2025, Paper 1 (11), Q1 (25 marks): (a) Study Fig. 1.1 (Insert), showing average annual population growth rates between 1950 and 2100 (estimated). (i) Identify the average annual population growth
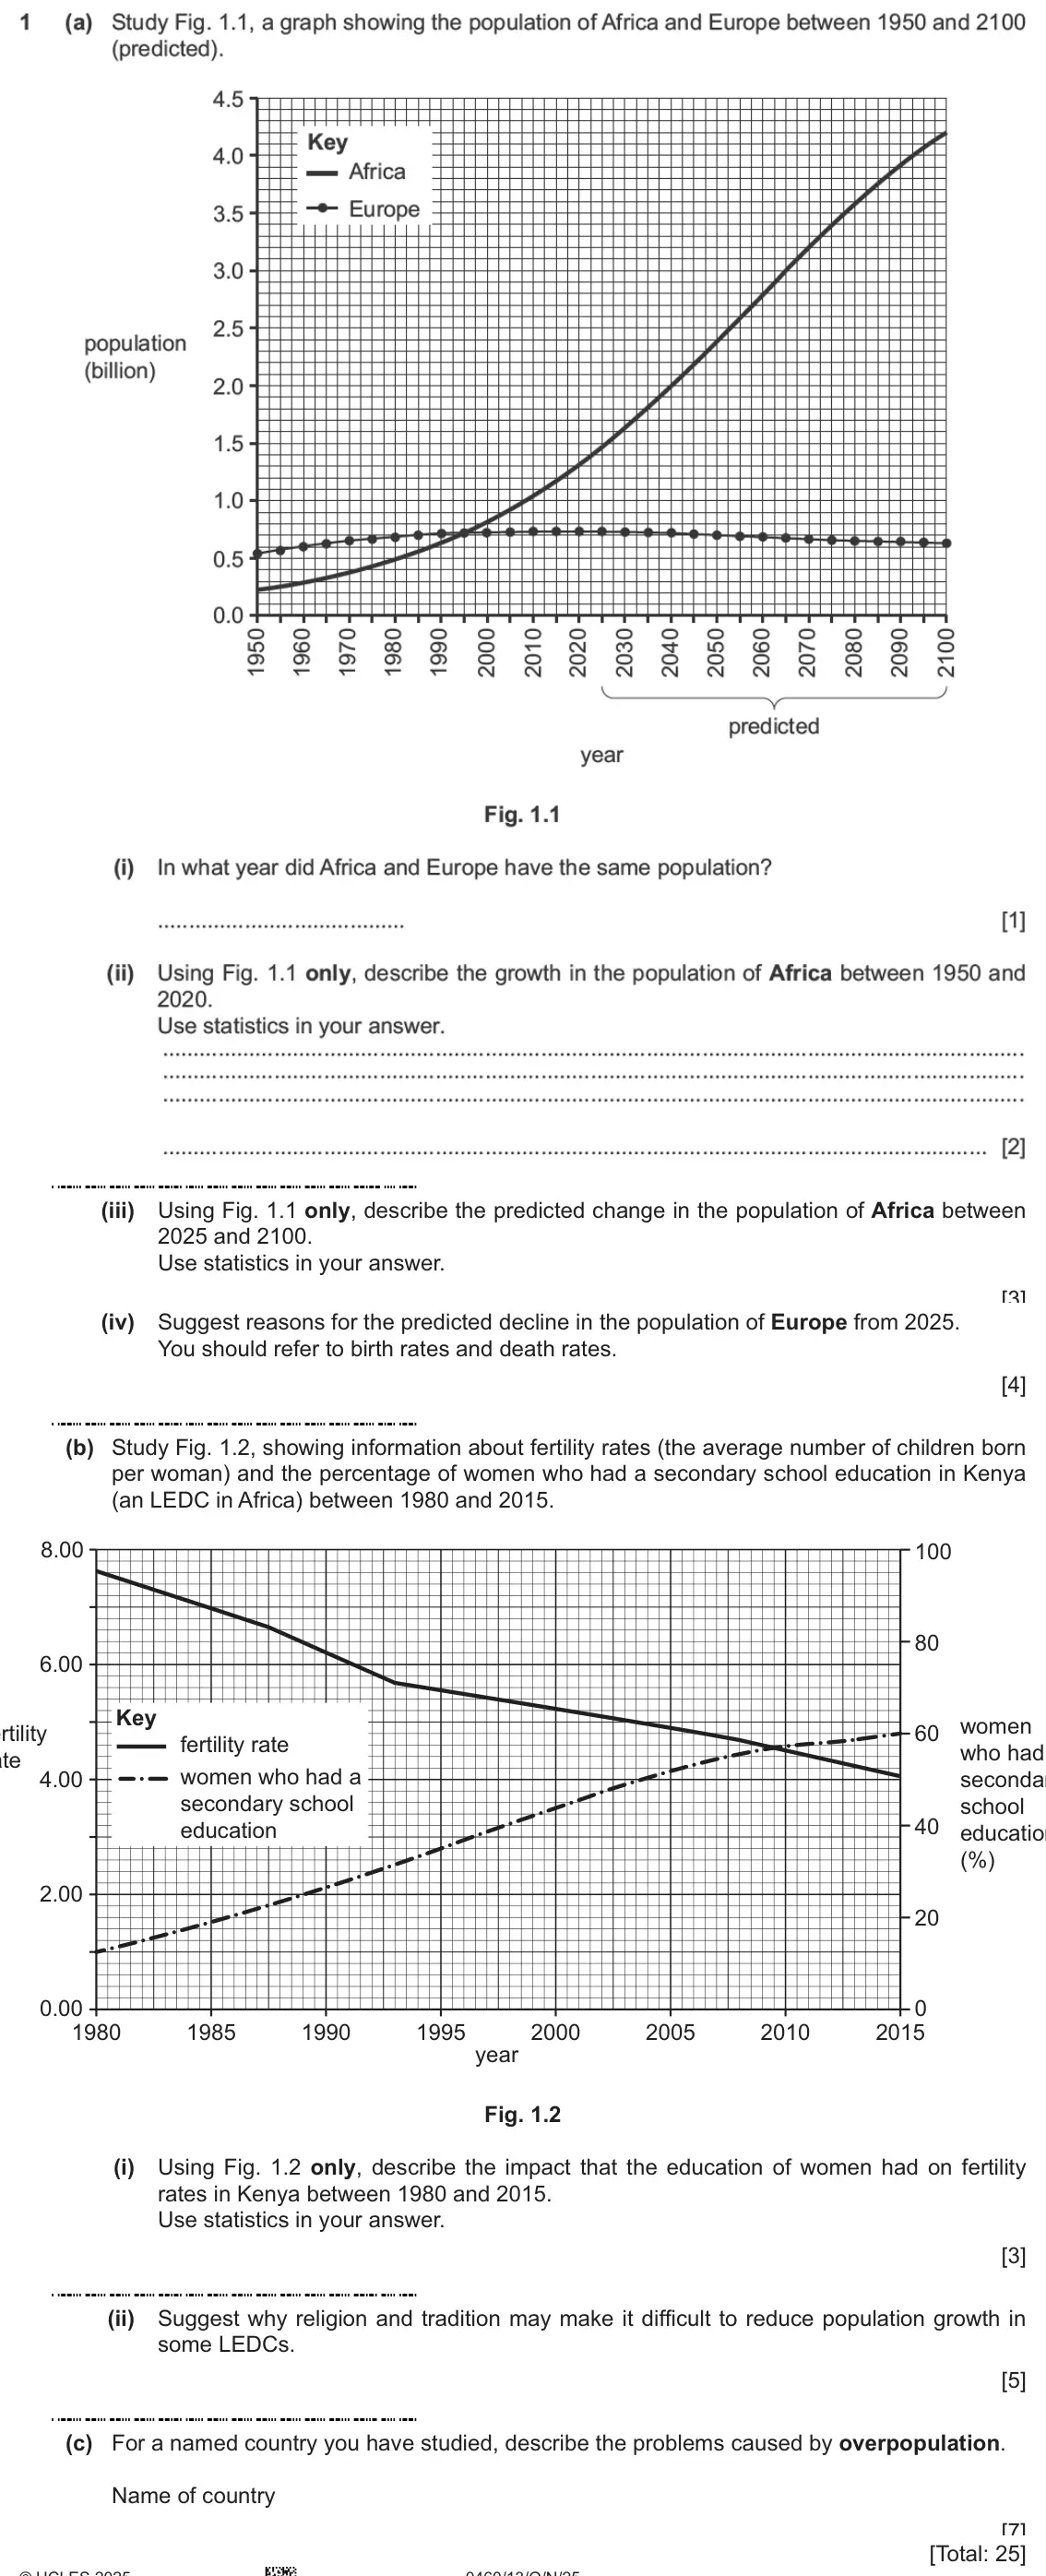
- November 2025, Paper 1 (13), Q1 (25 marks): (a) Study Fig. 1.1, a graph showing the population of Africa and Europe between 1950 and 2100 (predicted). 4.5 Key 4.0- — Africa 3.5 - Europe 3.0• 2.5 populatio
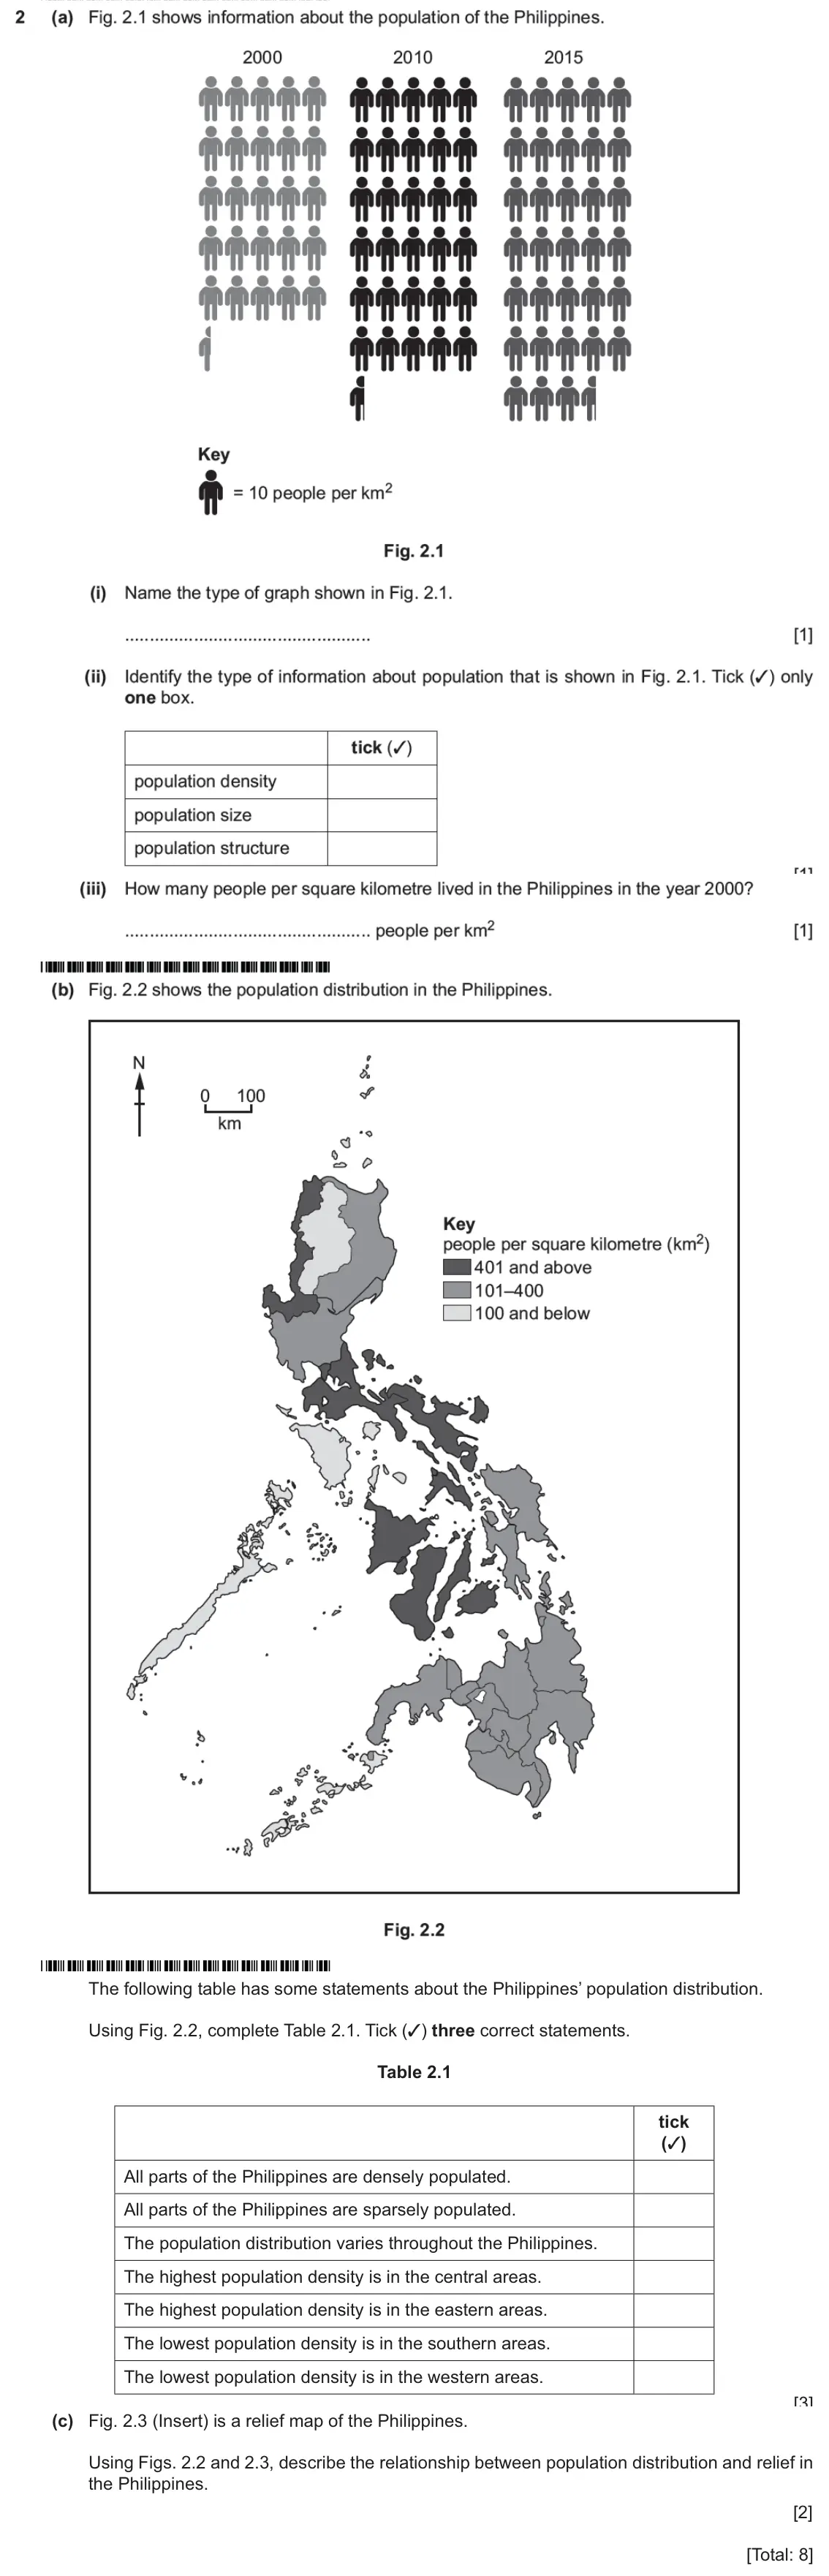
- November 2025, Paper 2 (22), Q2 (8 marks): (a) Fig. 2.1 shows information about the population of the Philippines. 2000 2010 2015 ПАPPN PŘŘİN ФMM·· Key Tp = 10 people perkm? Fig. 2.1 (i) Name the type of
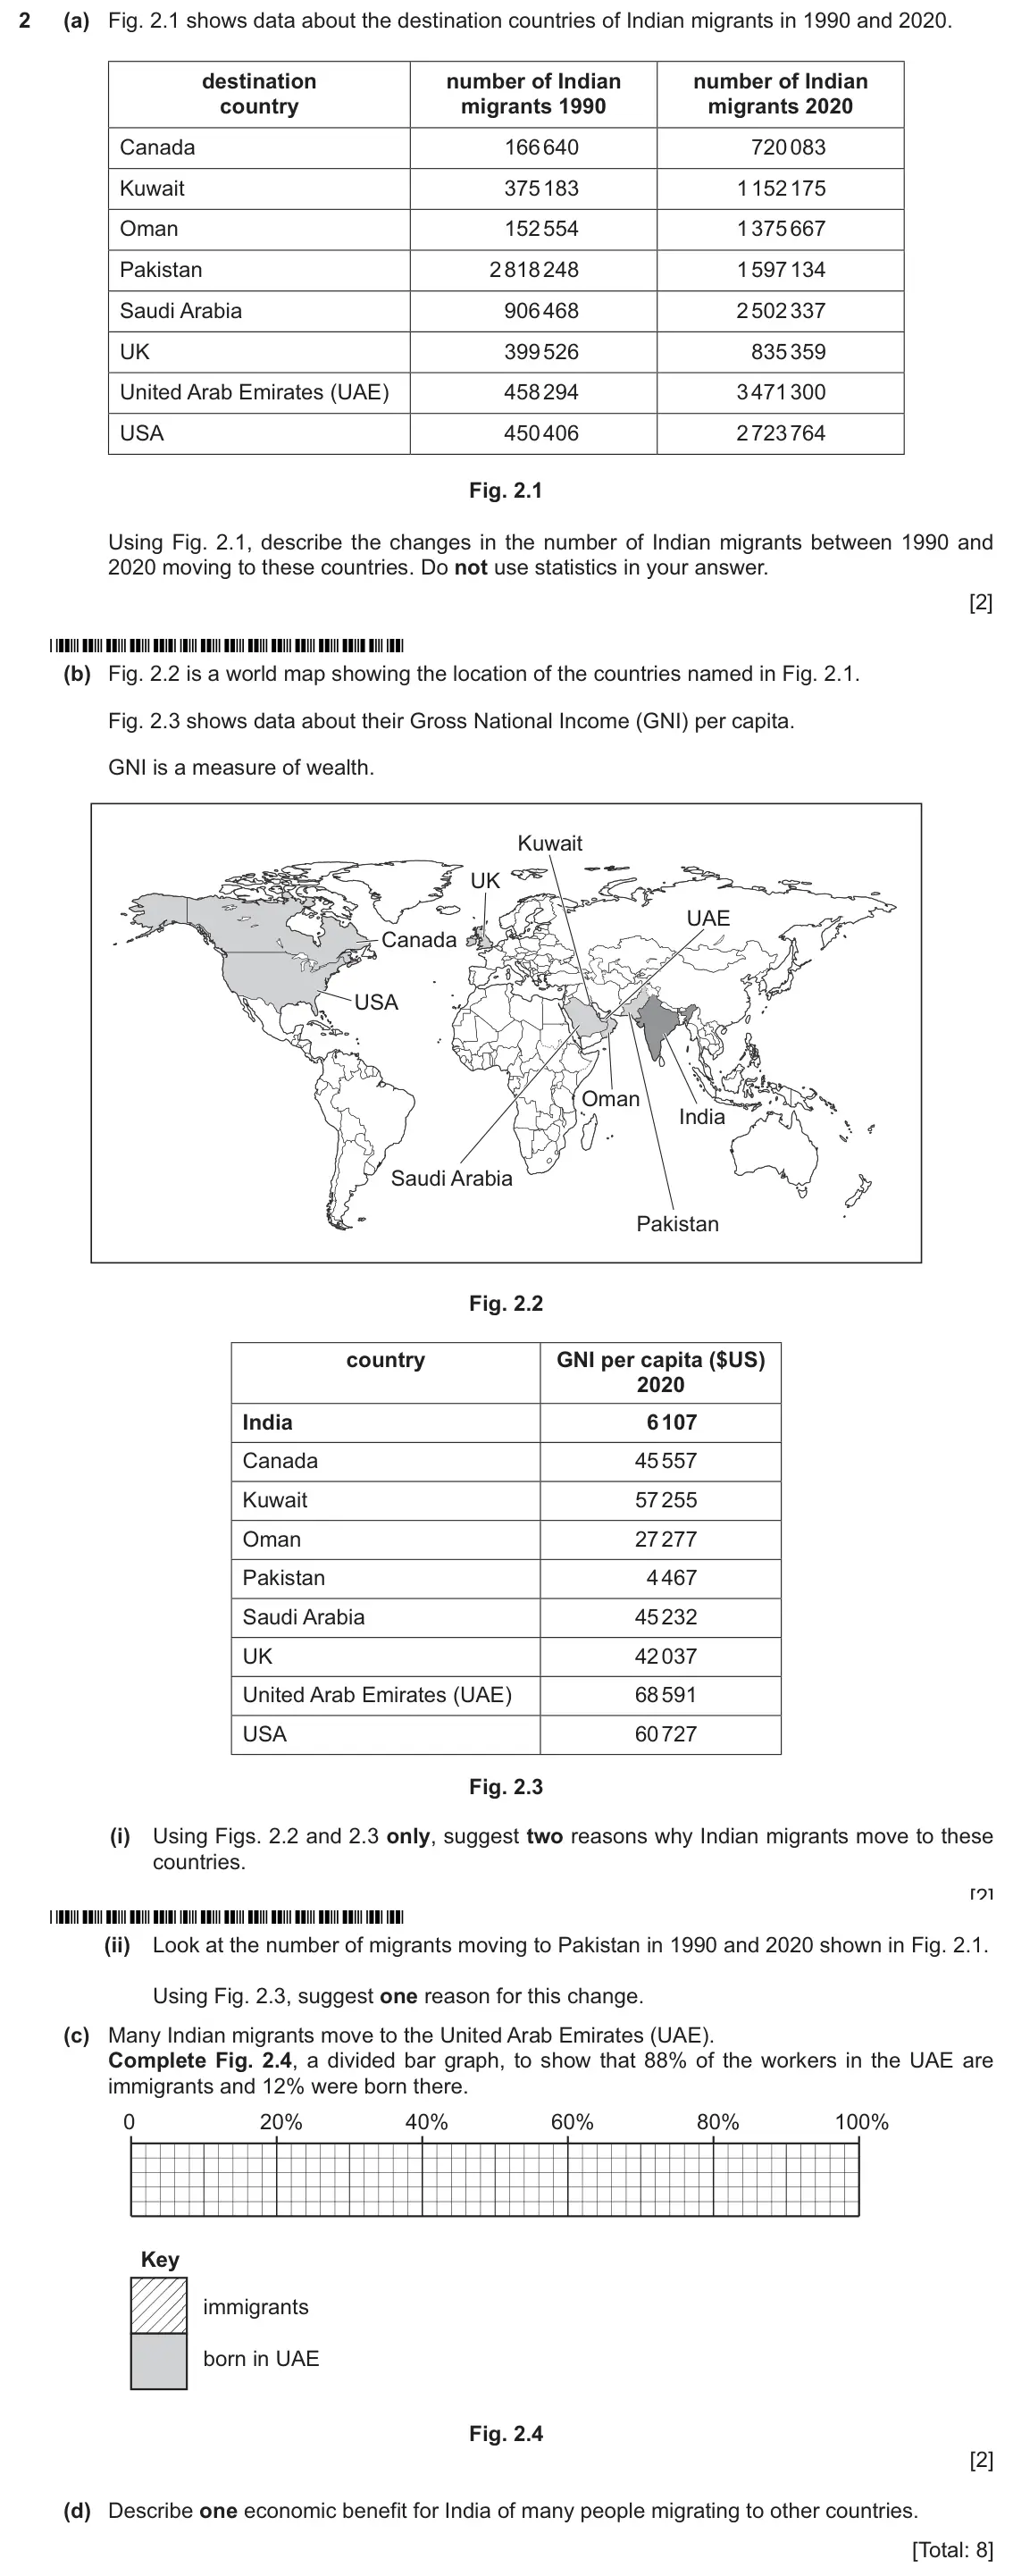
- November 2025, Paper 2 (23), Q2 (8 marks): (a) Fig. 2.1 shows data about the destination countries of Indian migrants in 1990 and 2020. destination number of Indian number of Indian country migrants 1990
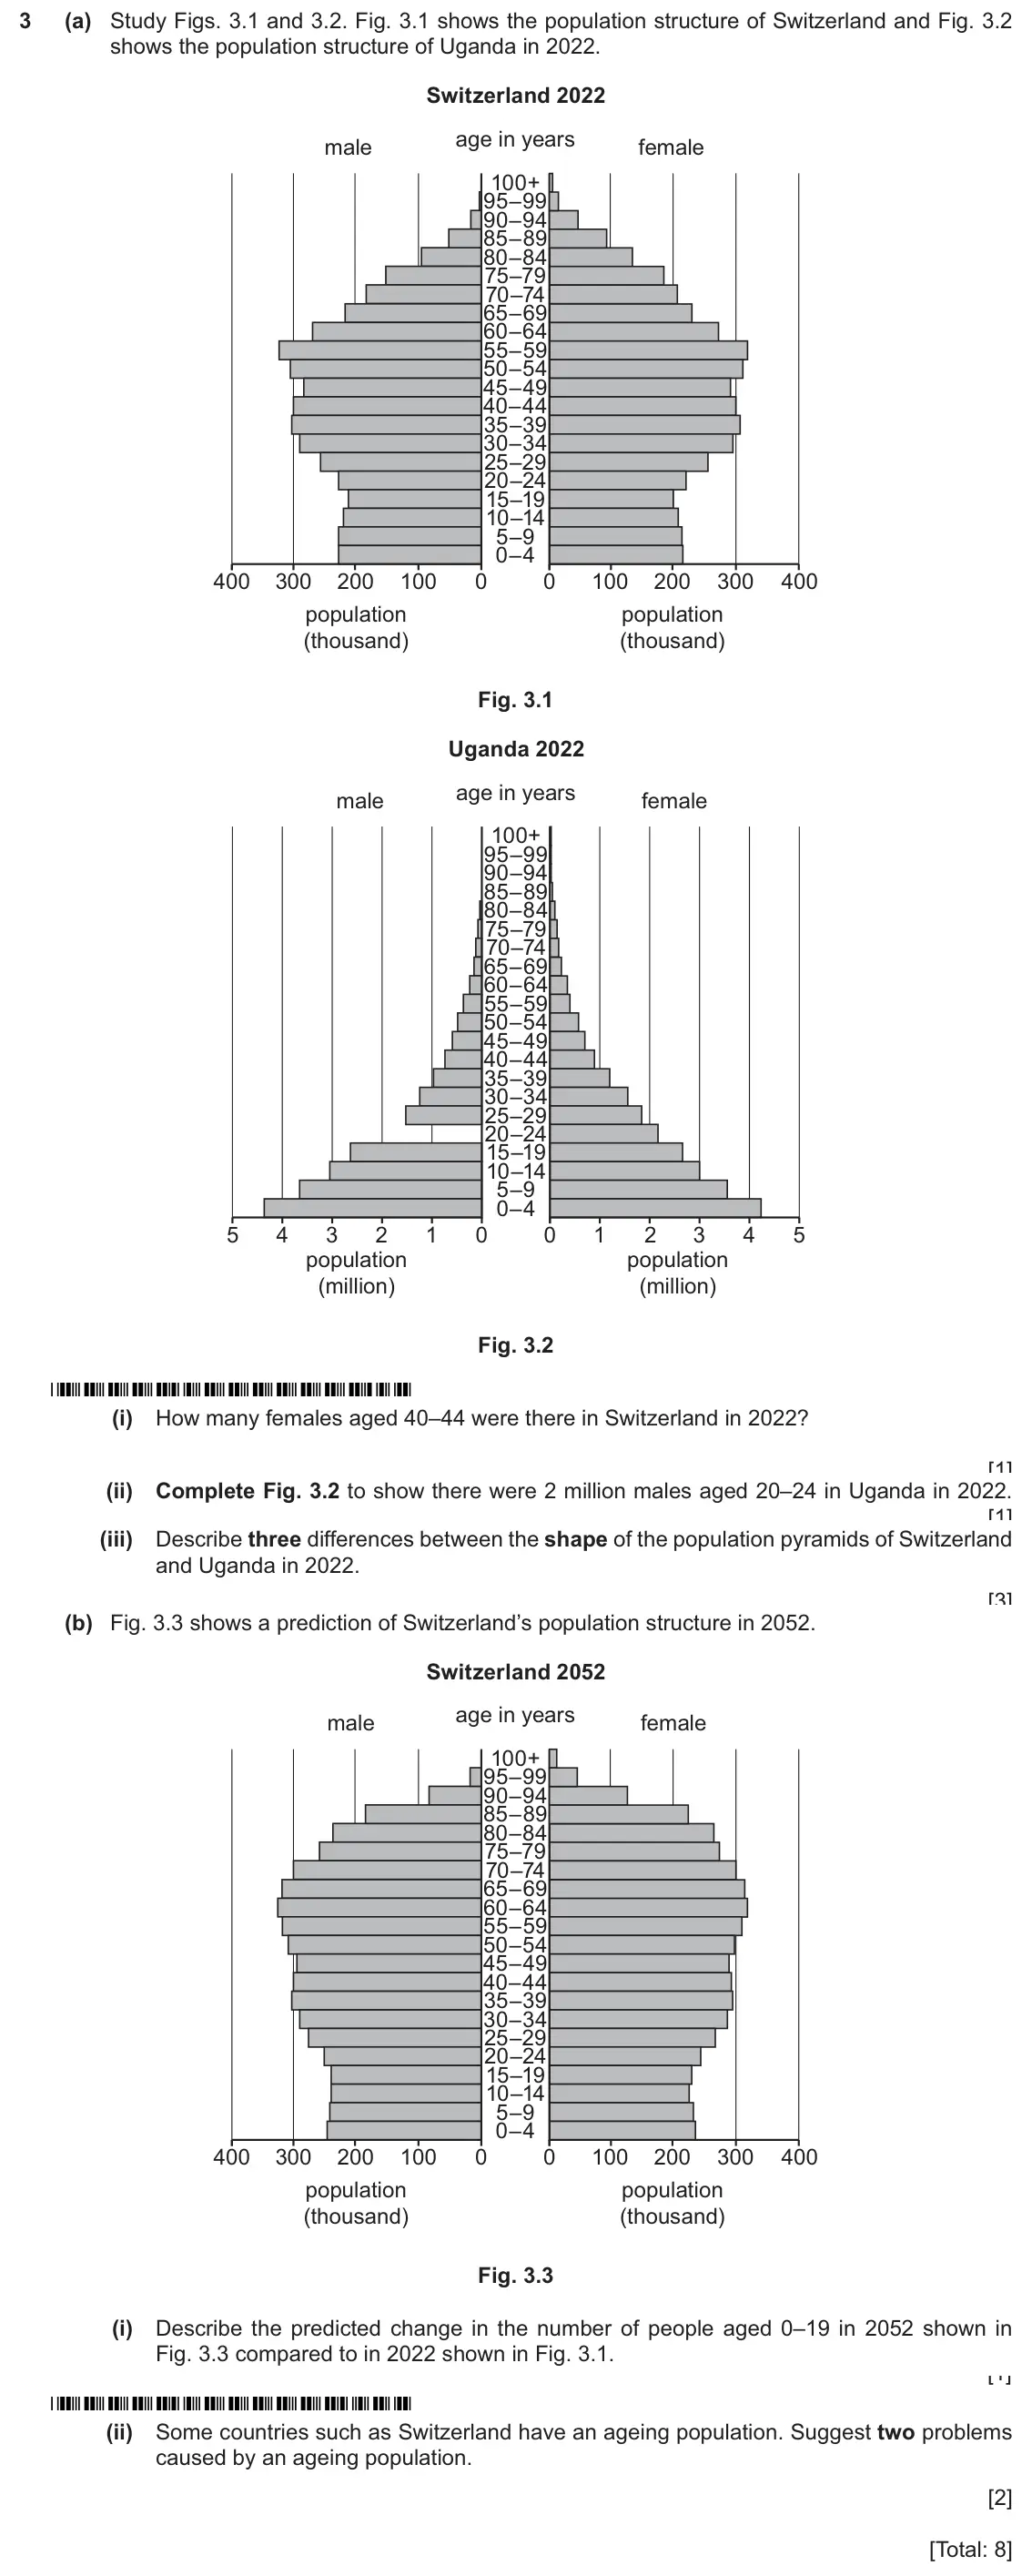
- November 2025, Paper 2 (23), Q3 (8 marks): (a) Study Figs. 3.1 and 3.2. Fig. 3.1 shows the population structure of Switzerland and Fig. 3.2 shows the population structure of Uganda in 2022. Switzerland 2
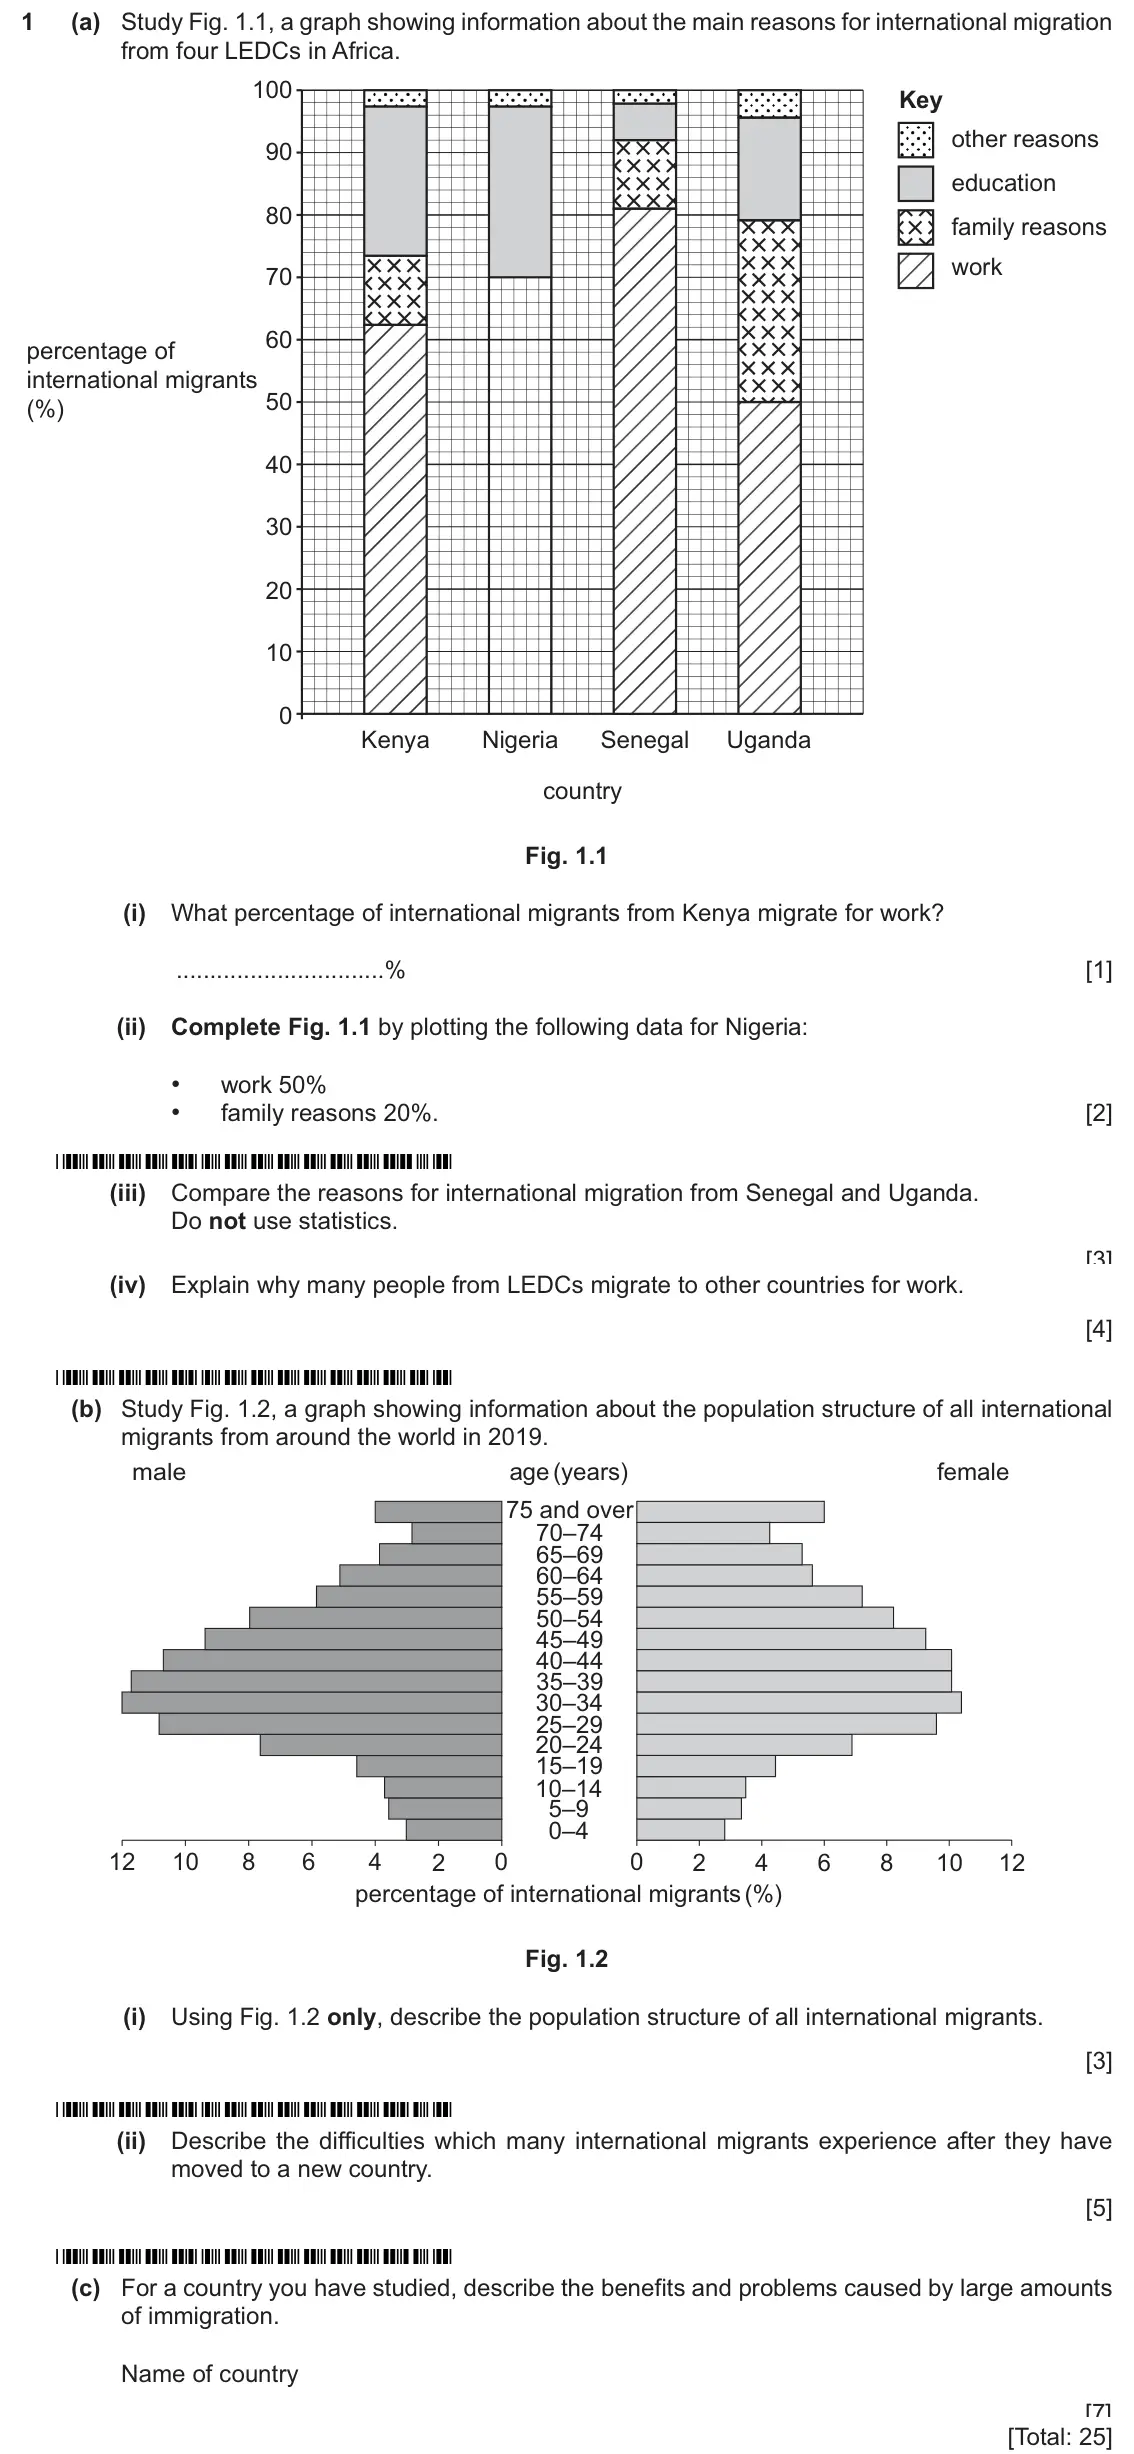
- June 2025, Paper 1 (11), Q1 (25 marks): (a) Study Fig. 1.1, a graph showing information about the main reasons for international migration from four LEDCs in Africa. 100 Key other reasons 90 education
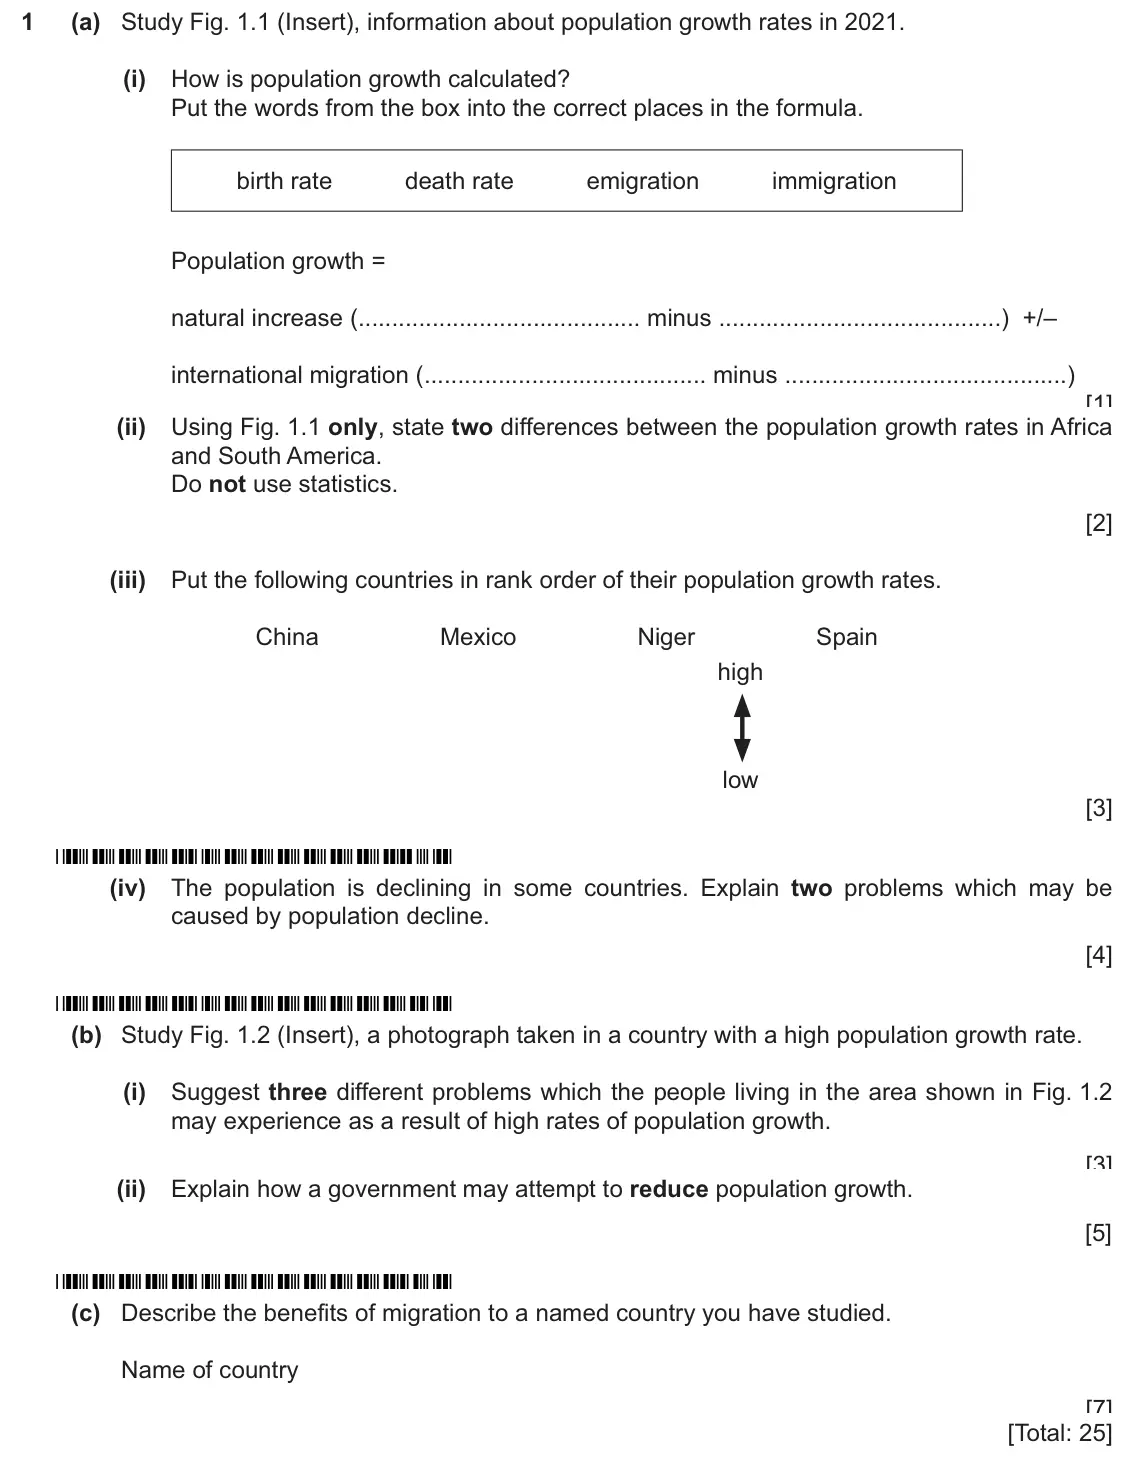
- June 2025, Paper 1 (12), Q1 (25 marks): (a) Study Fig. 1.1 (Insert), information about population growth rates in 2021. (i) How is population growth calculated? Put the words from the box into the cor
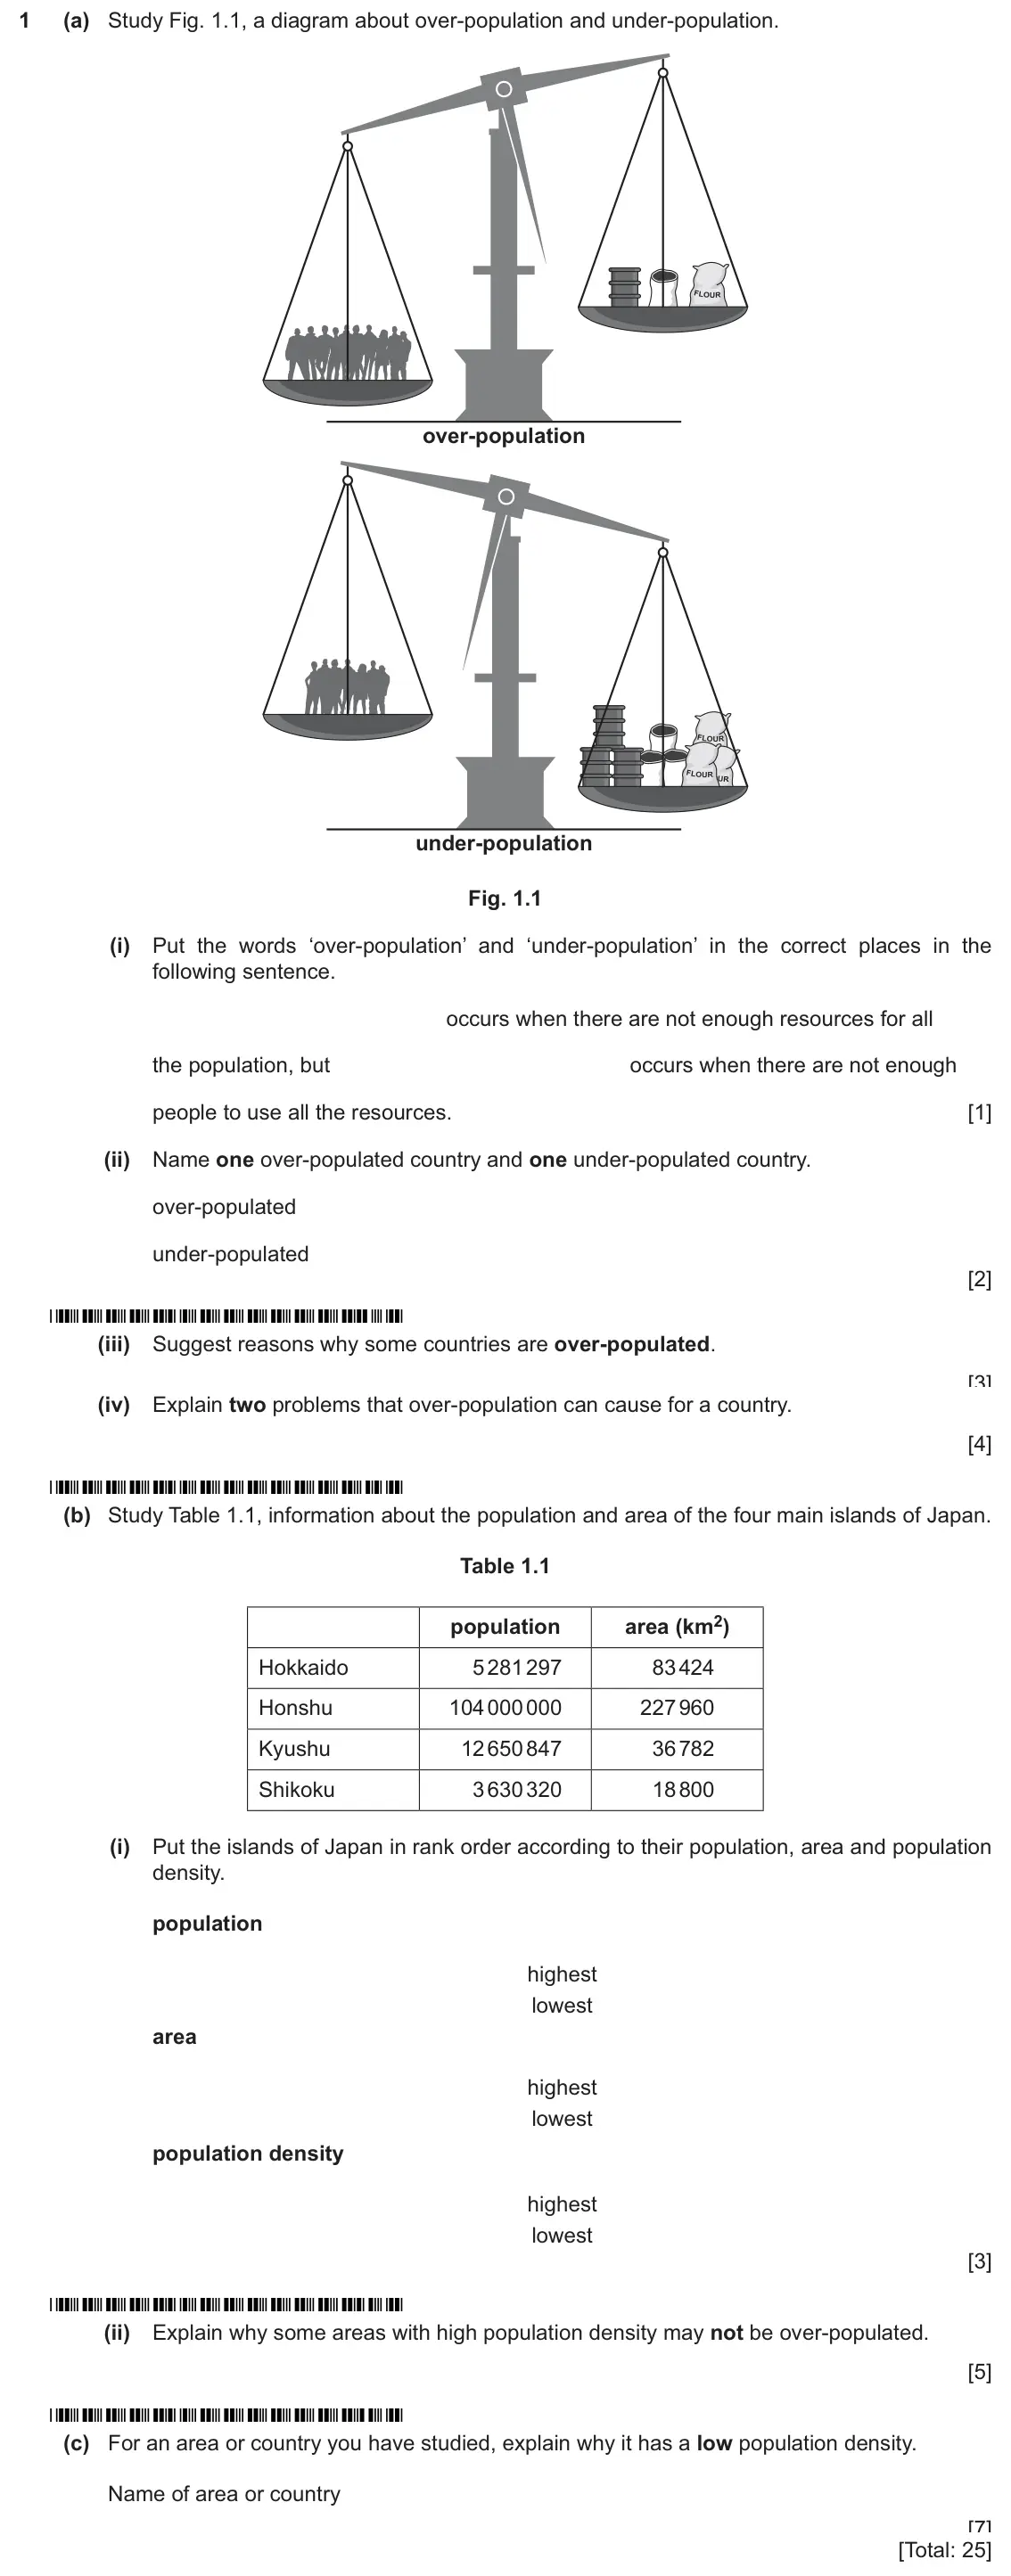
- June 2025, Paper 1 (13), Q1 (25 marks): (a) Study Fig. 1.1, a diagram about over-population and under-population. over-population under-population Fig. 1.1 (i) Put the words ‘over-population’ and ‘und
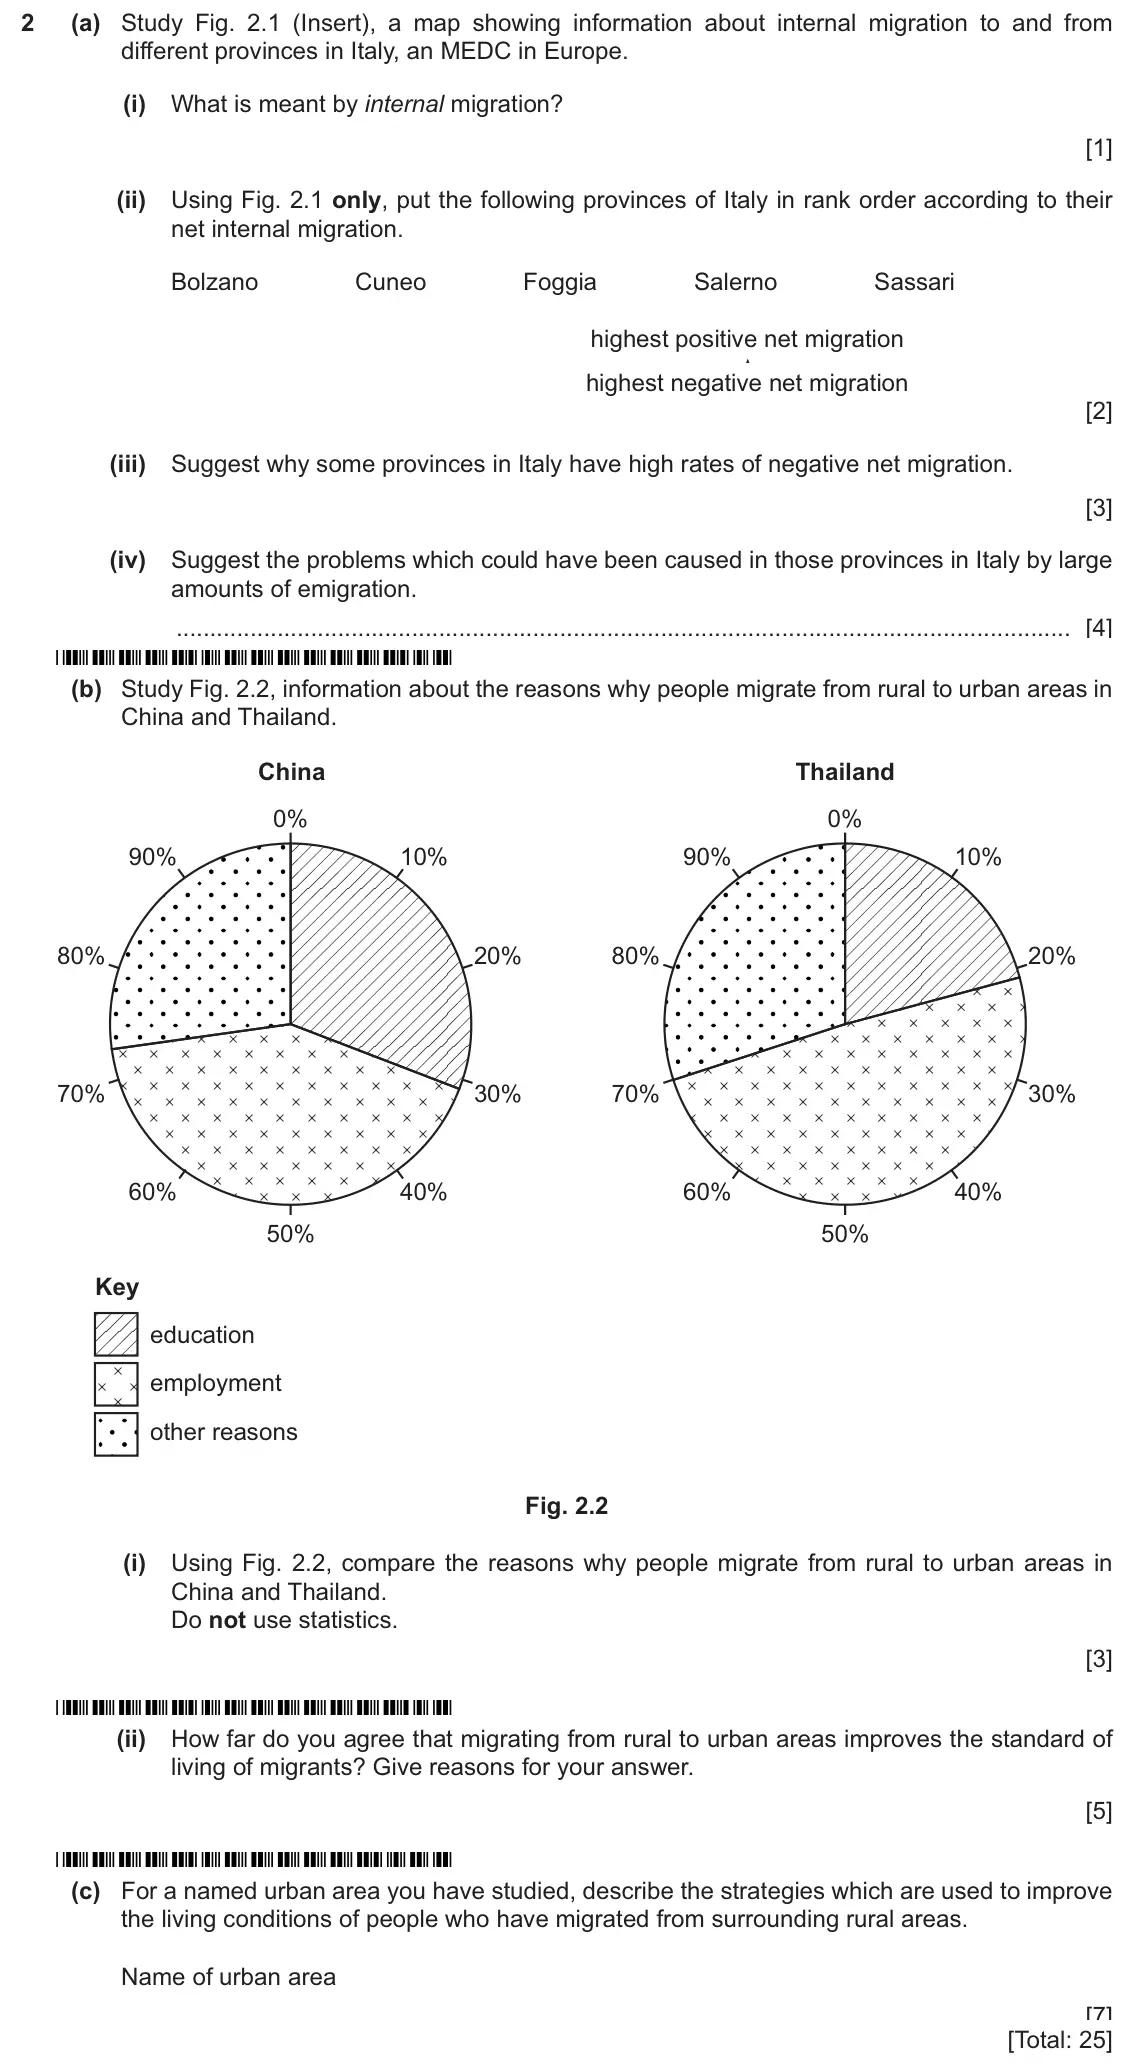
- June 2025, Paper 1 (13), Q2 (25 marks): (a) Study Fig. 2.1 (Insert), a map showing information about internal migration to and from different provinces in Italy, an MEDC in Europe. (i) What is meant b
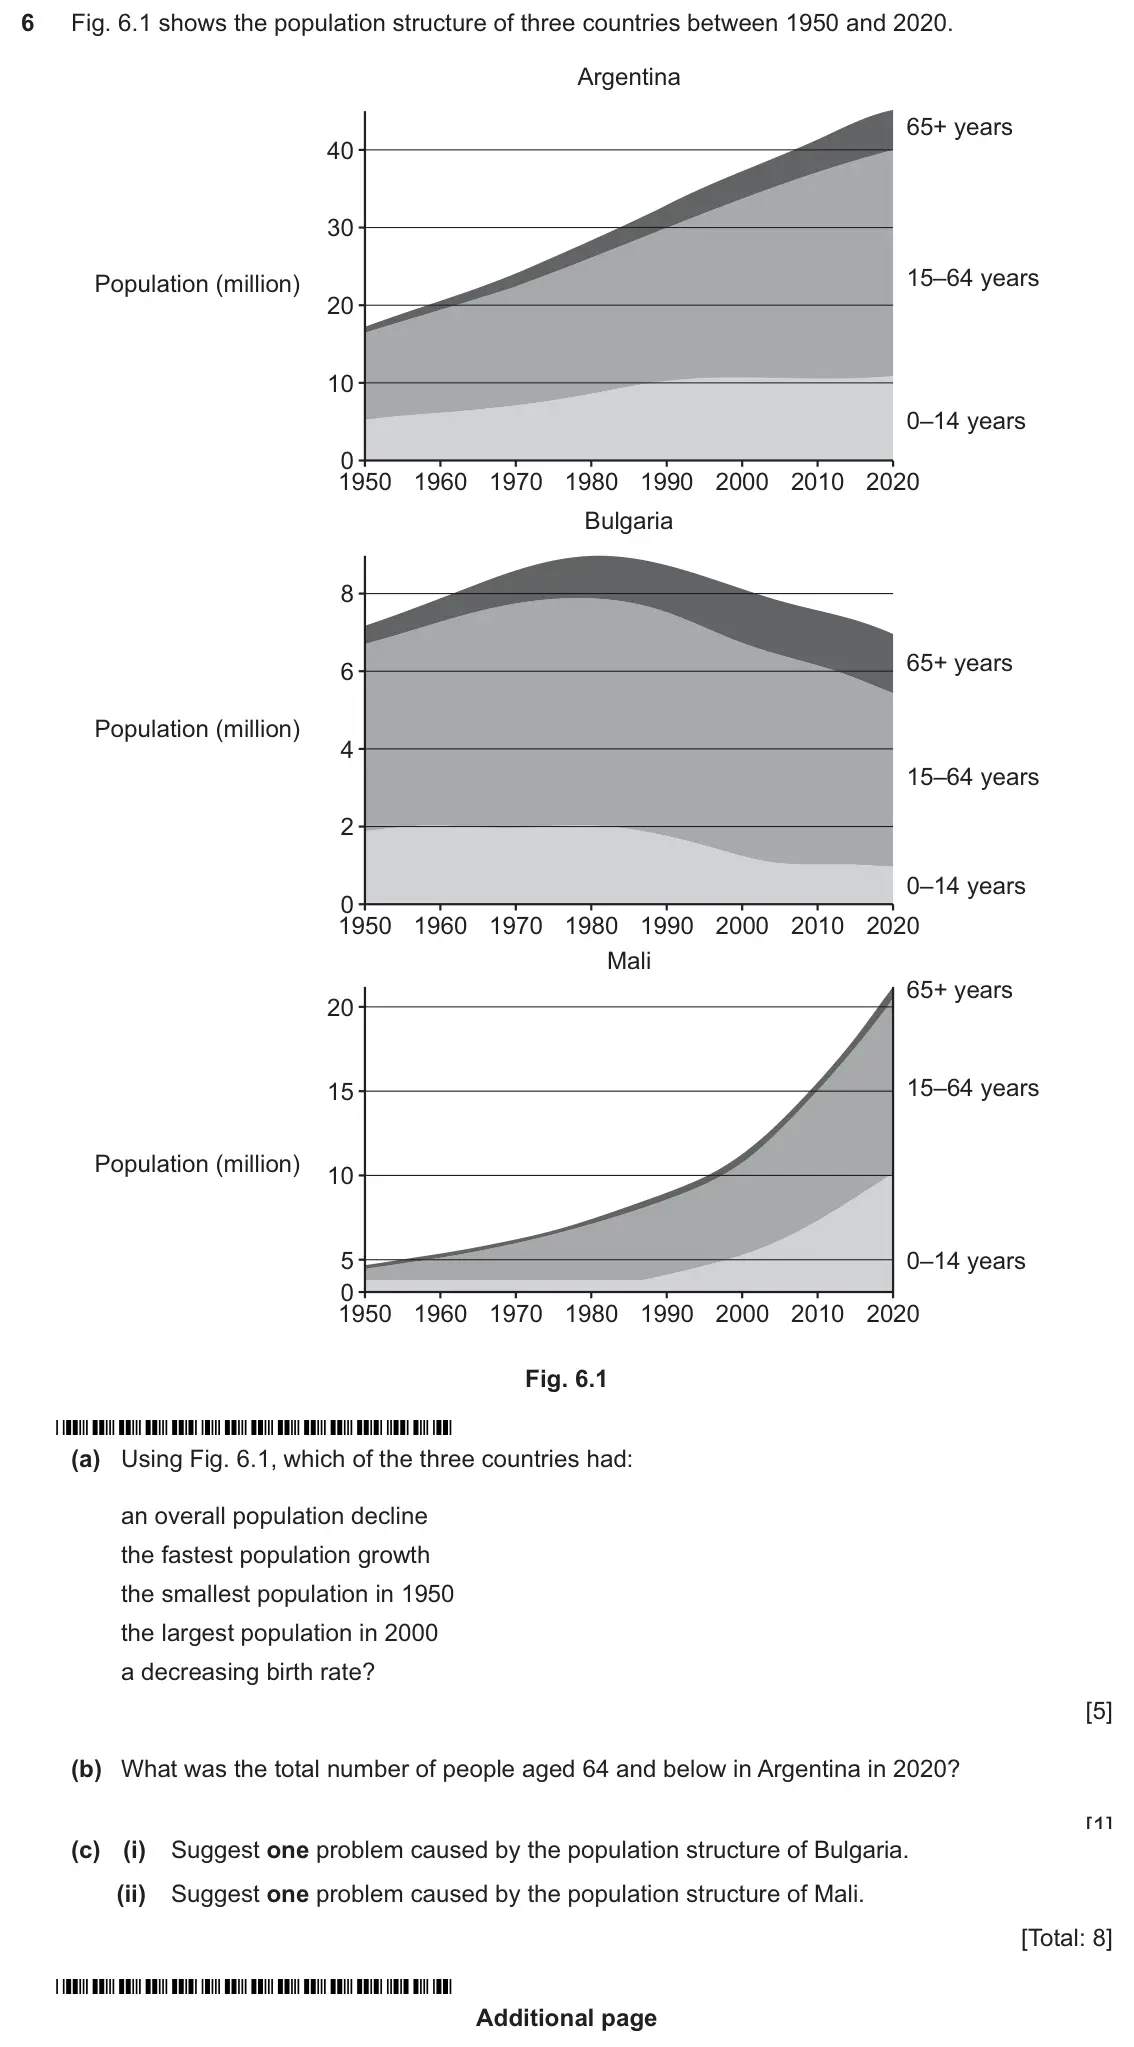
- June 2025, Paper 2 (21), Q6 (8 marks): Fig. 6.1 shows the population structure of three countries between 1950 and 2020. Argentina 65+ years 40 30 15–64 years Population (million) 20 10 0–14 years 0
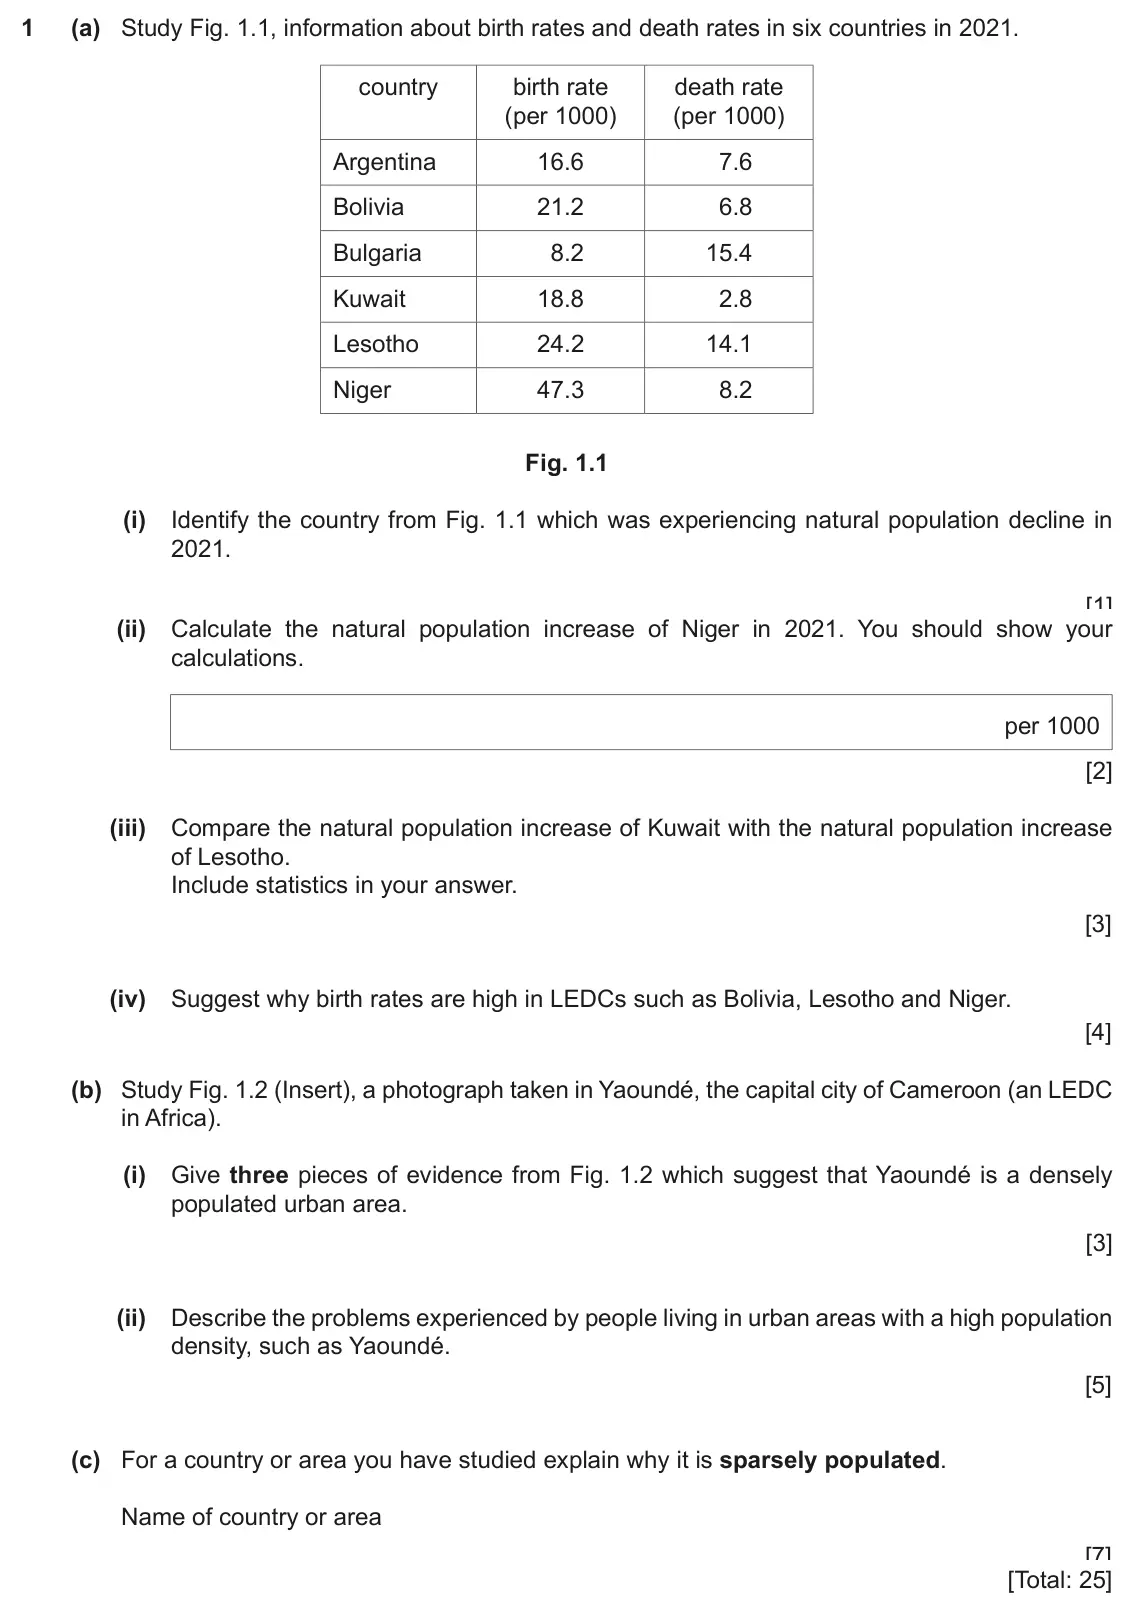
- June 2024, Paper 1, Q1 (25 marks): (a) Study Fig. 1.1, information about birth rates and death rates in six countries in 2021. country birth rate death rate (per 1000) (per 1000) Argentina 16.6 7
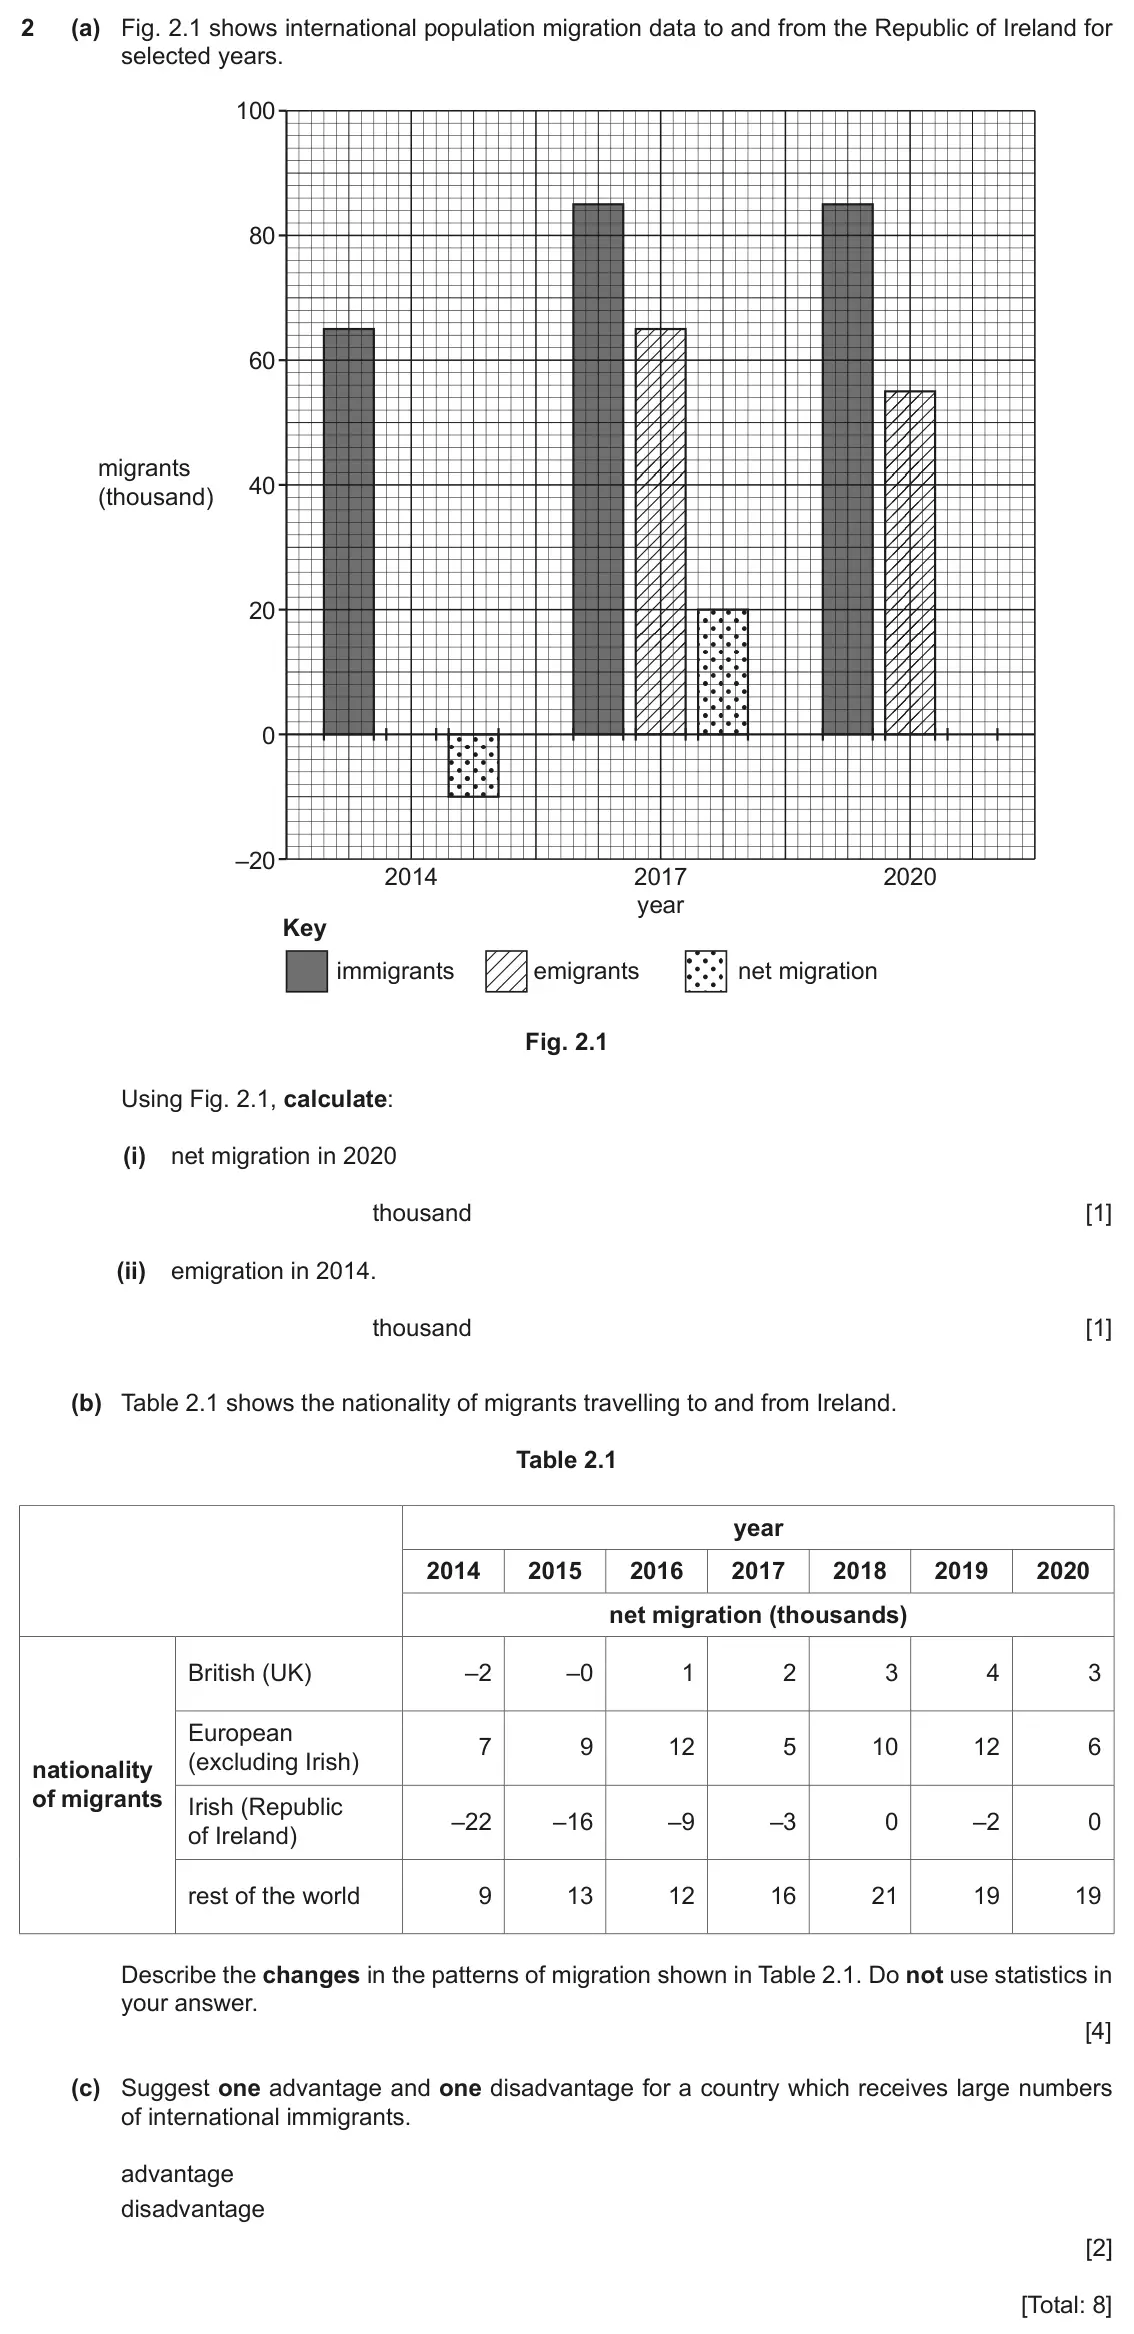
- June 2024, Paper 2, Q2 (8 marks): (a) Fig. 2.1 shows international population migration data to and from the Republic of Ireland for selected years. 100 80 60 migrants 40 (thousand) 20 0 –20 201
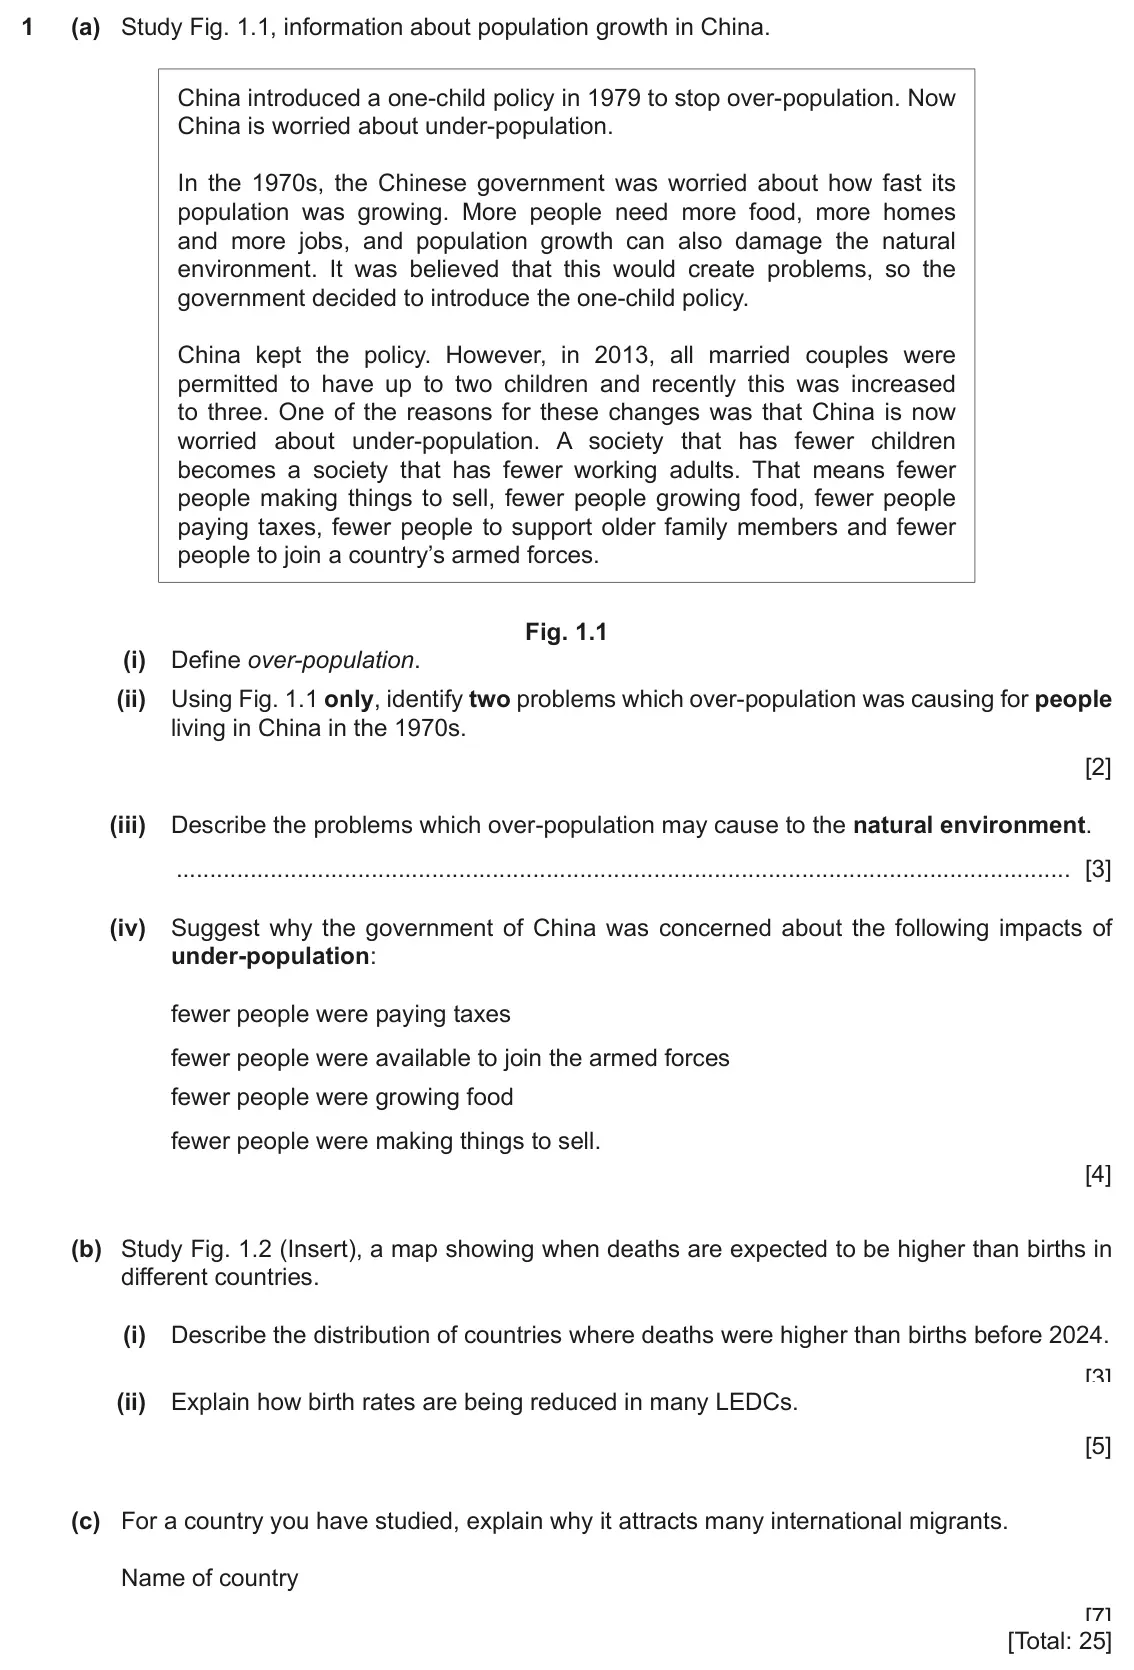
- June 2024 (9–1 variant), Paper 1, Q1 (25 marks): (a) Study Fig. 1.1, information about population growth in China. China introduced a one-child policy in 1979 to stop over-population. Now China is worried abou
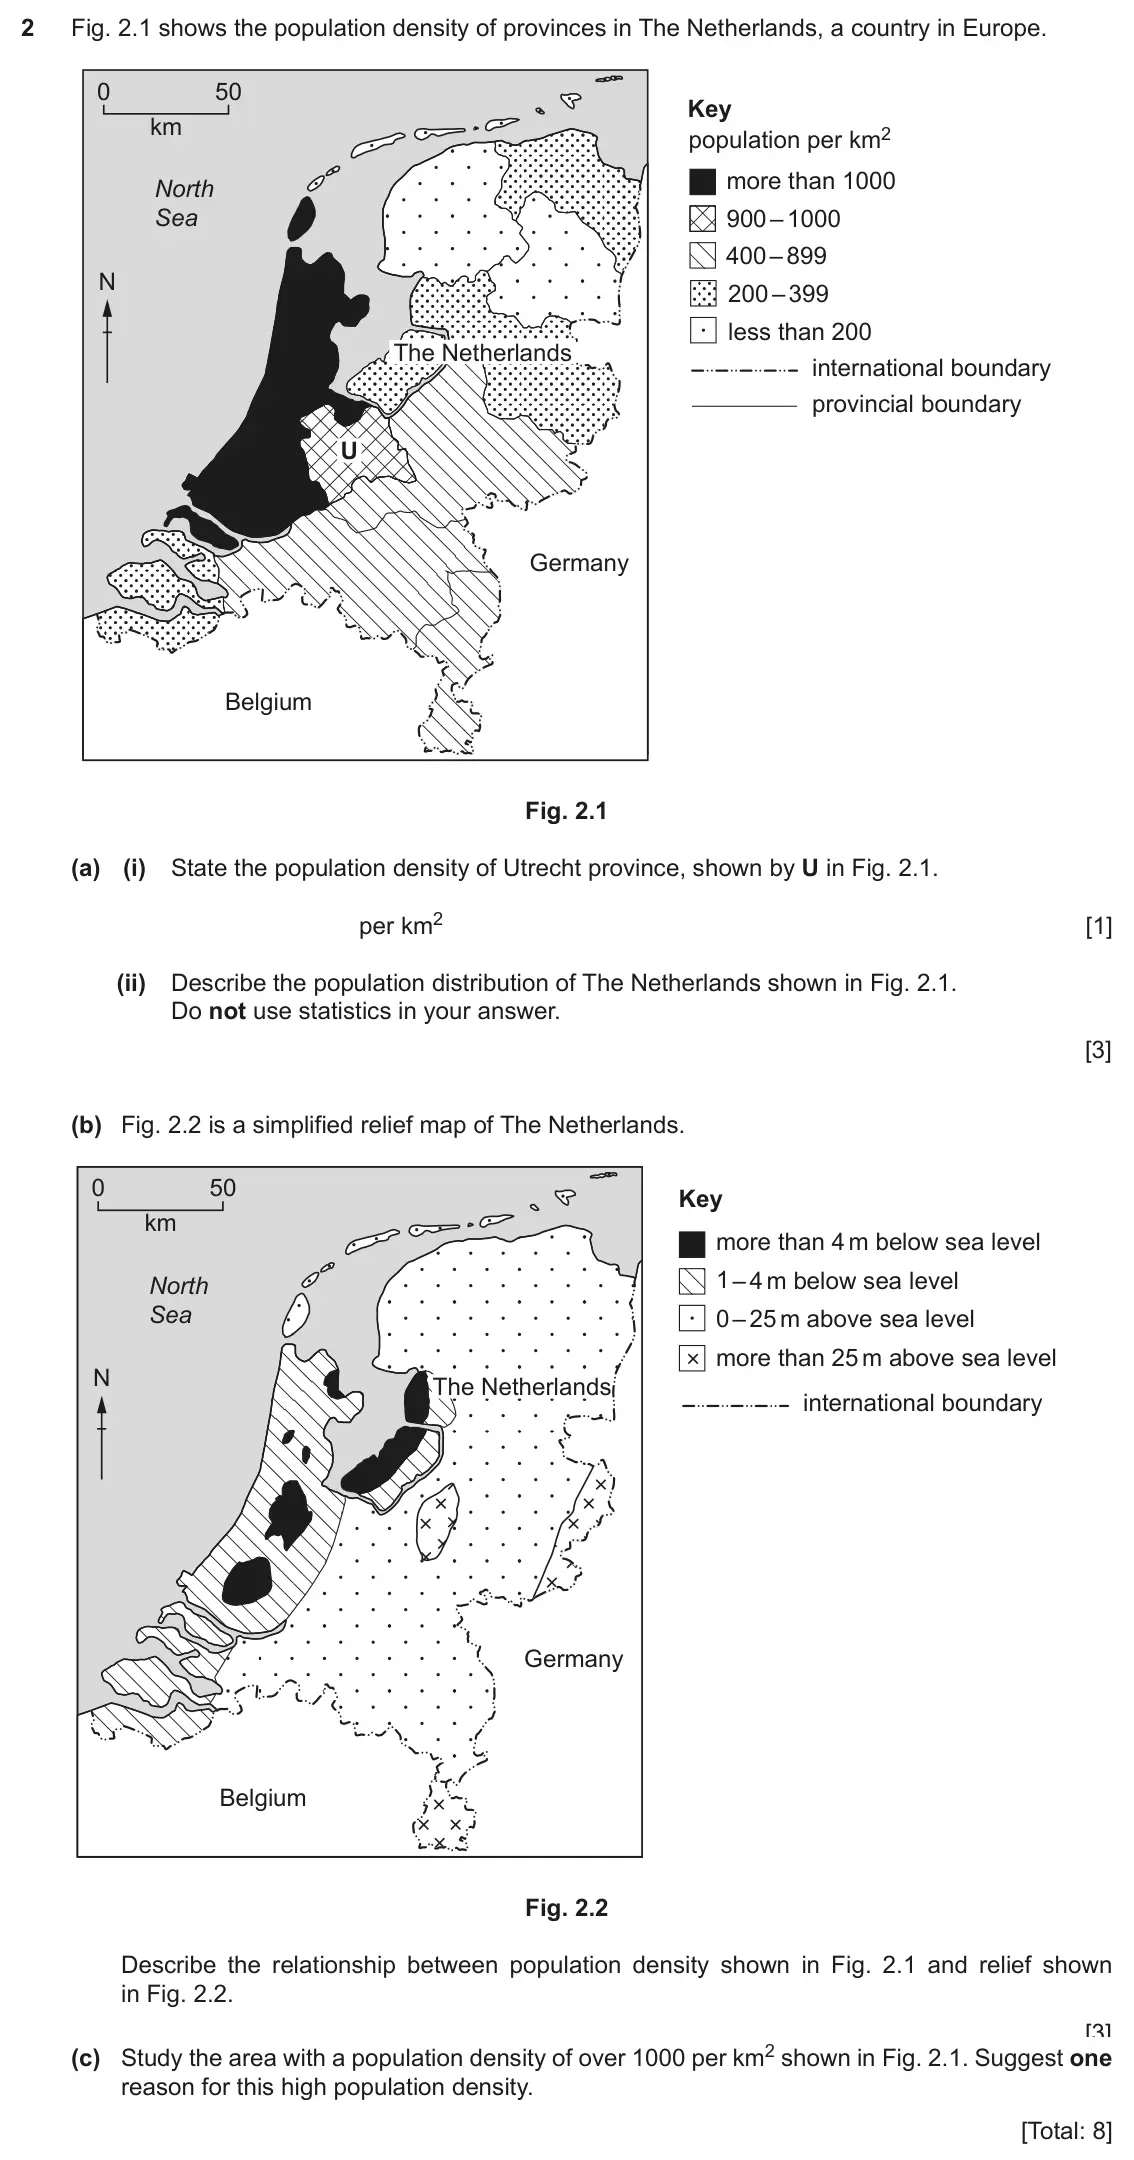
- June 2024 (9–1 variant), Paper 2, Q2 (8 marks): Fig. 2.1 shows the population density of provinces in The Netherlands, a country in Europe. 0 50 Key km population per km2 more than 1000 North Sea 900 – 1000 4
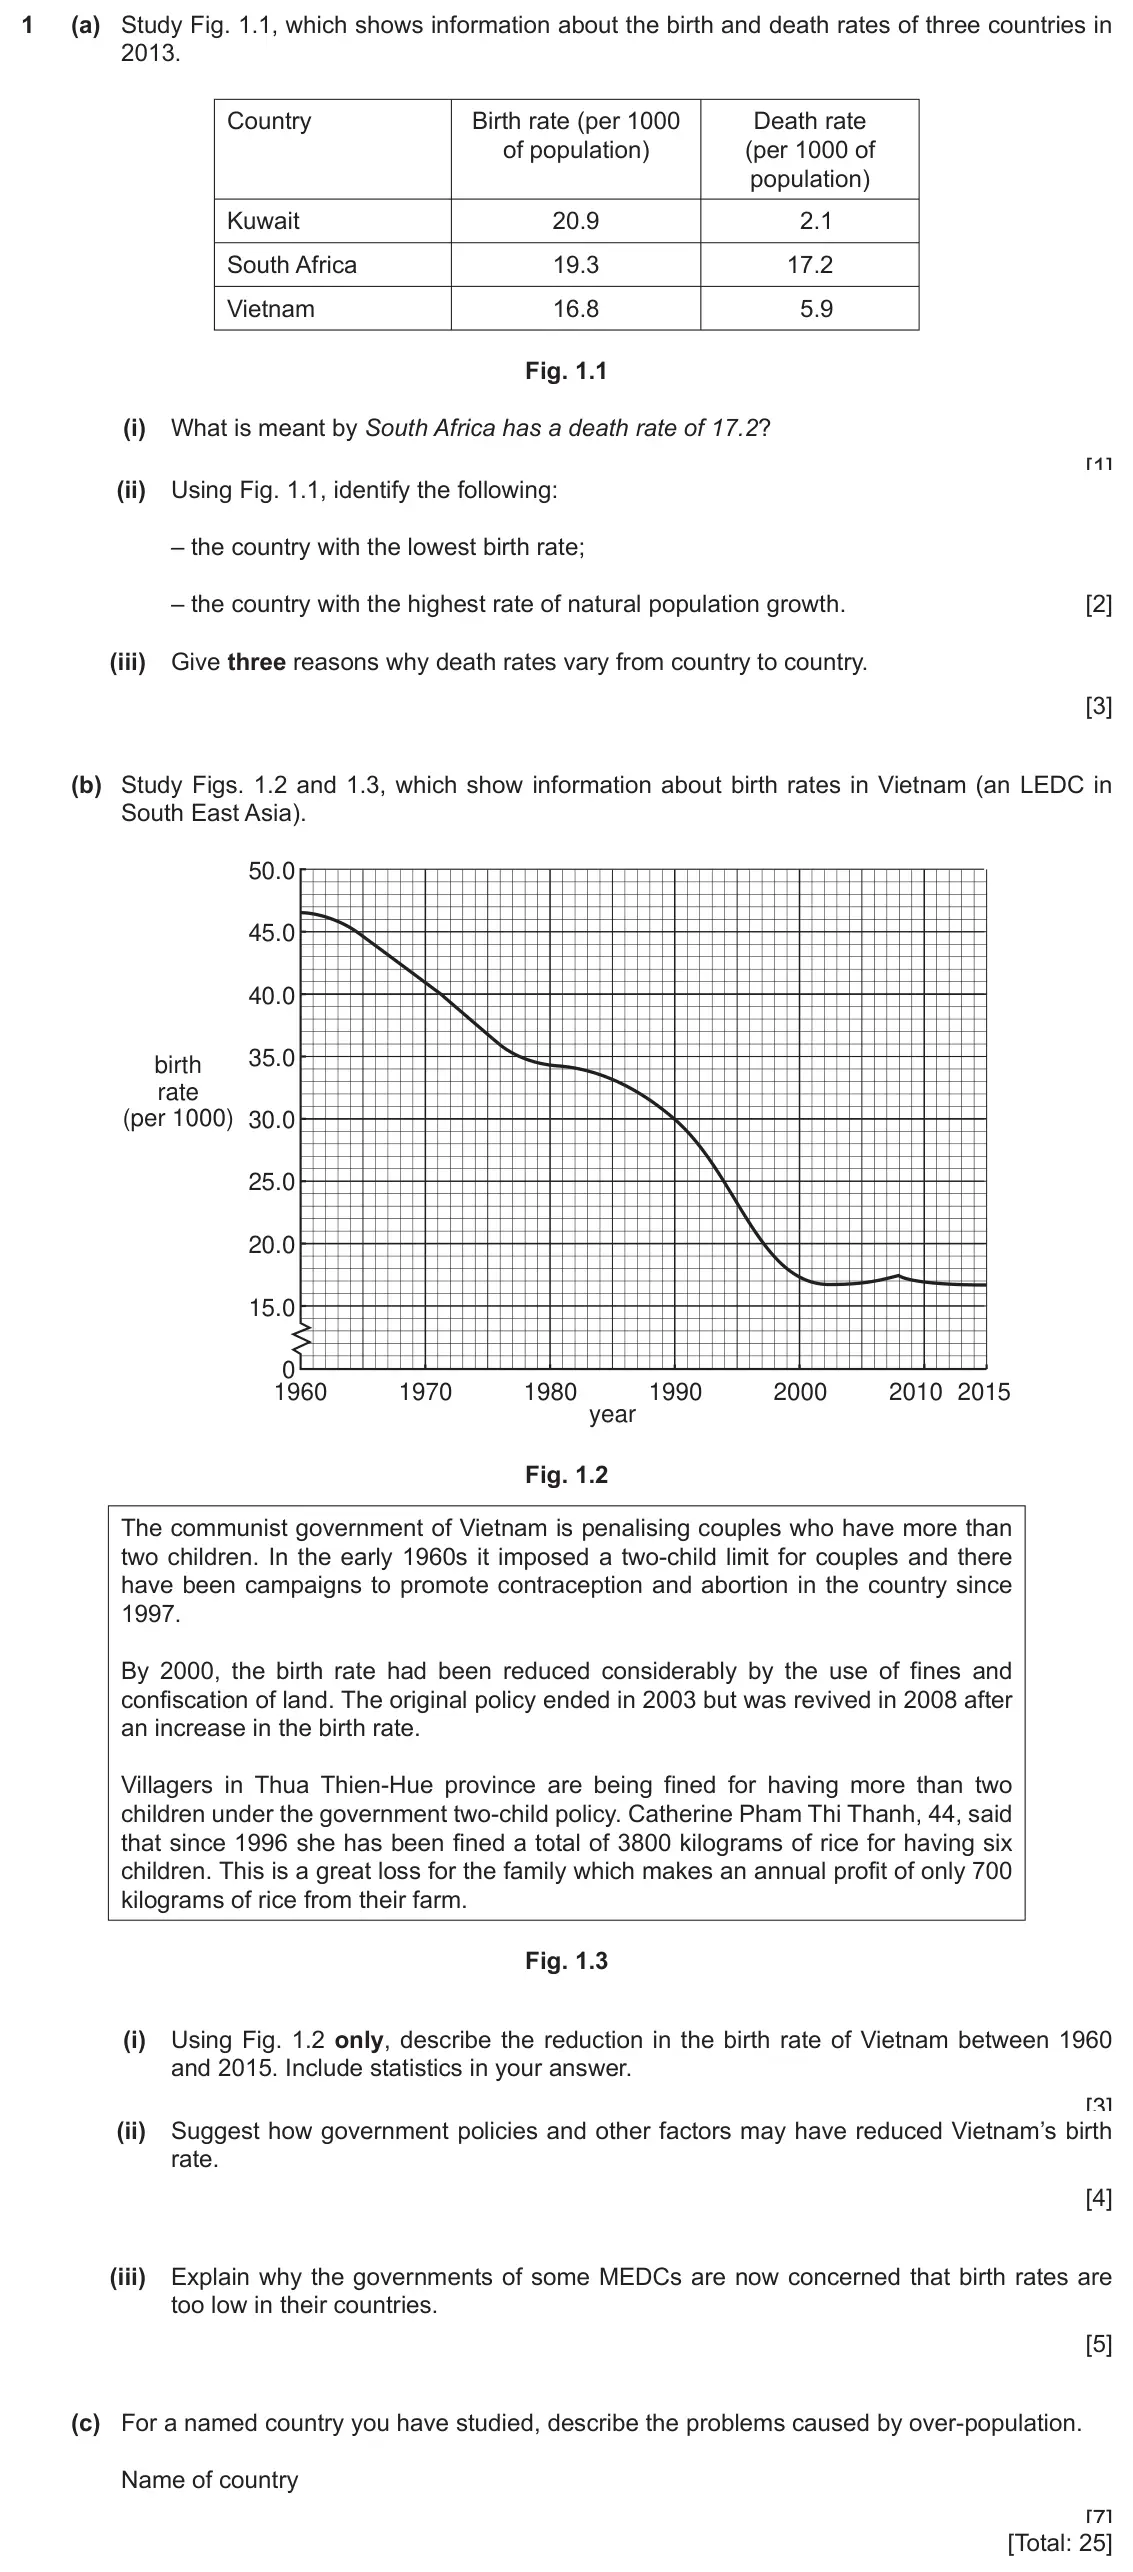
- 2020 specimen, Paper 1, Q1 (25 marks): (a) Study Fig. 1.1, which shows information about the birth and death rates of three countries in 2013. Country Birth rate (per 1000 Death rate of population) (
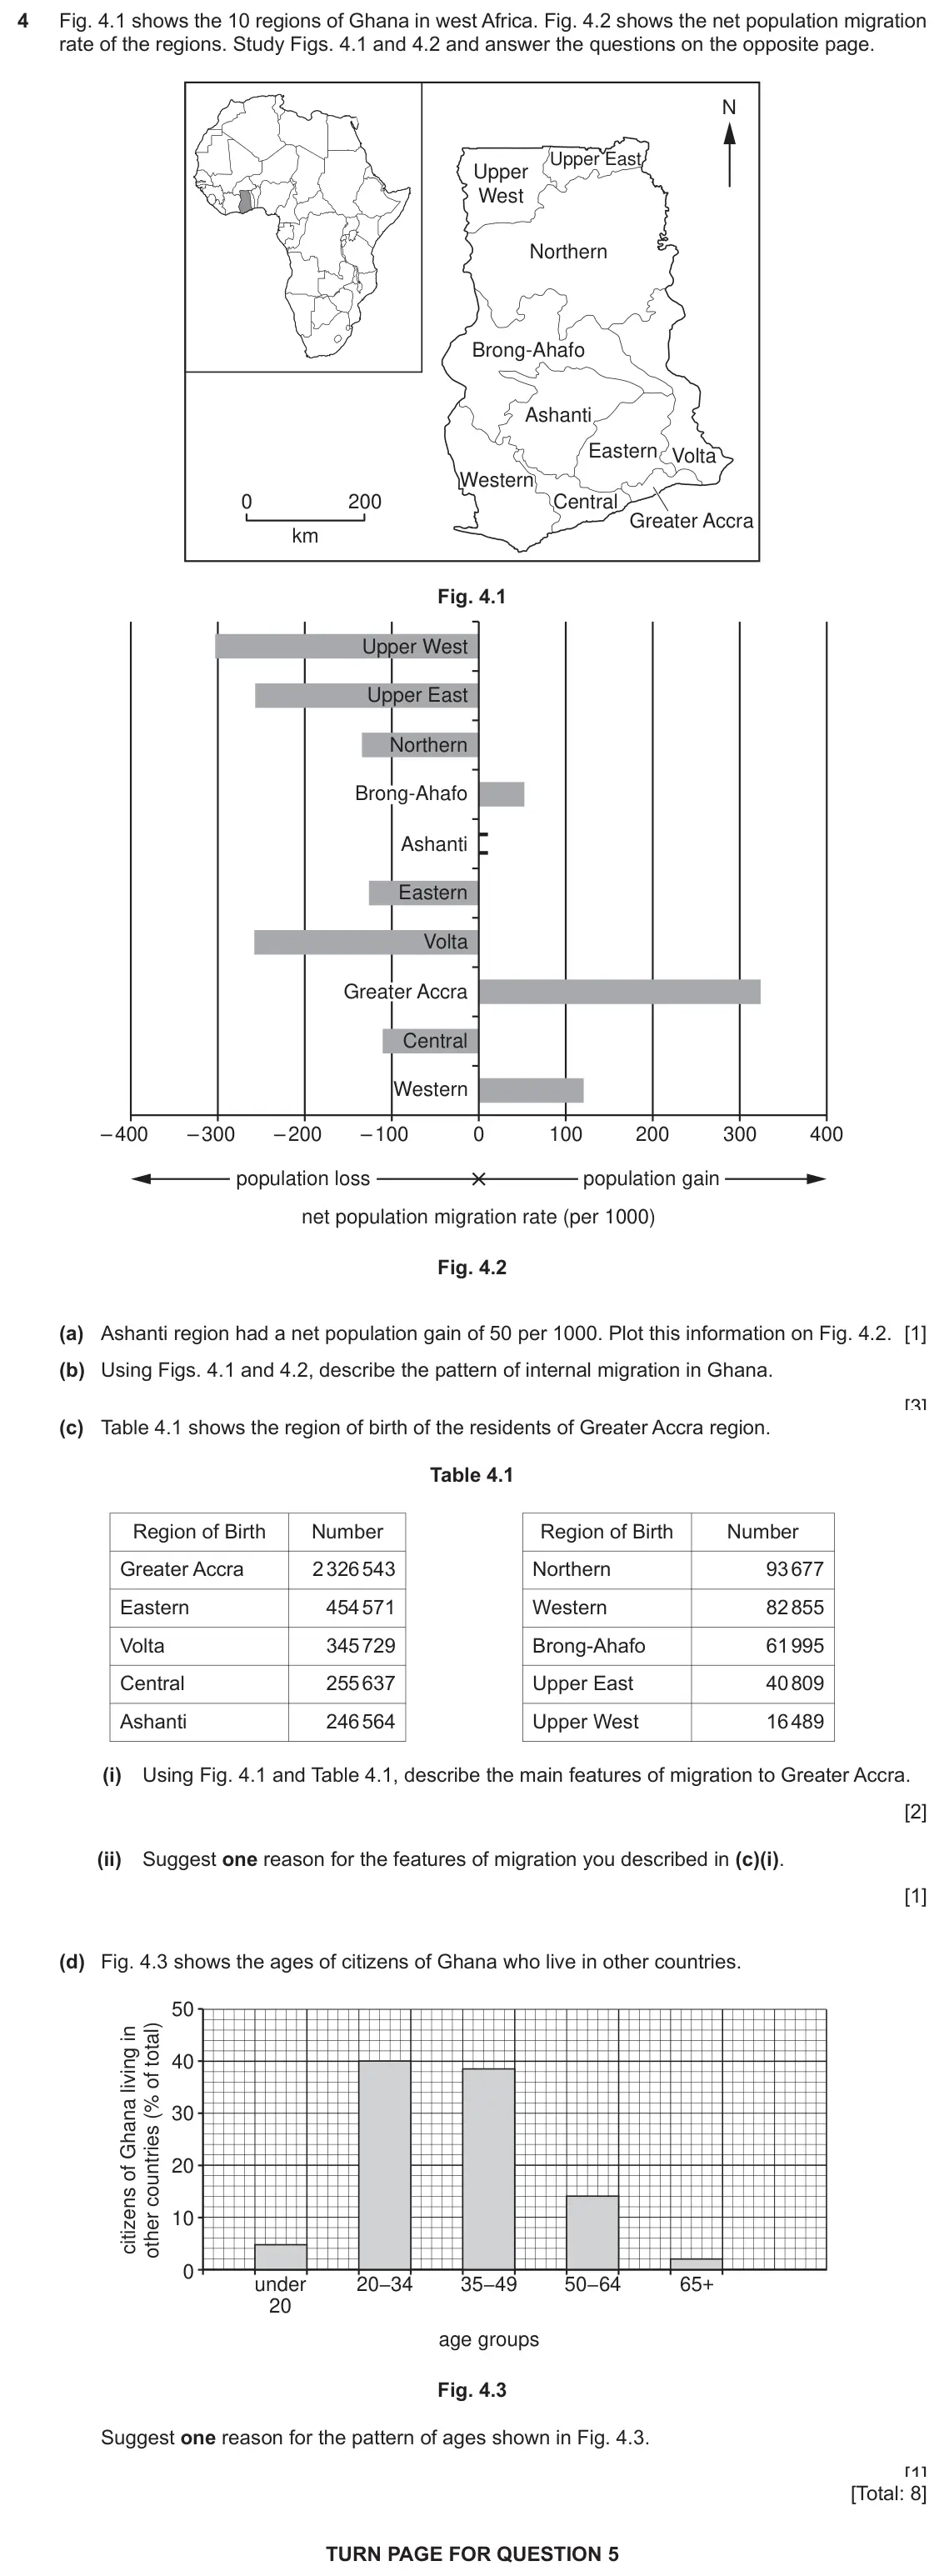
- 2020 specimen, Paper 2, Q4 (8 marks): Fig. 4.1 shows the 10 regions of Ghana in west Africa. Fig. 4.2 shows the net population migration rate of the regions. Study Figs. 4.1 and 4.2 and answer the q
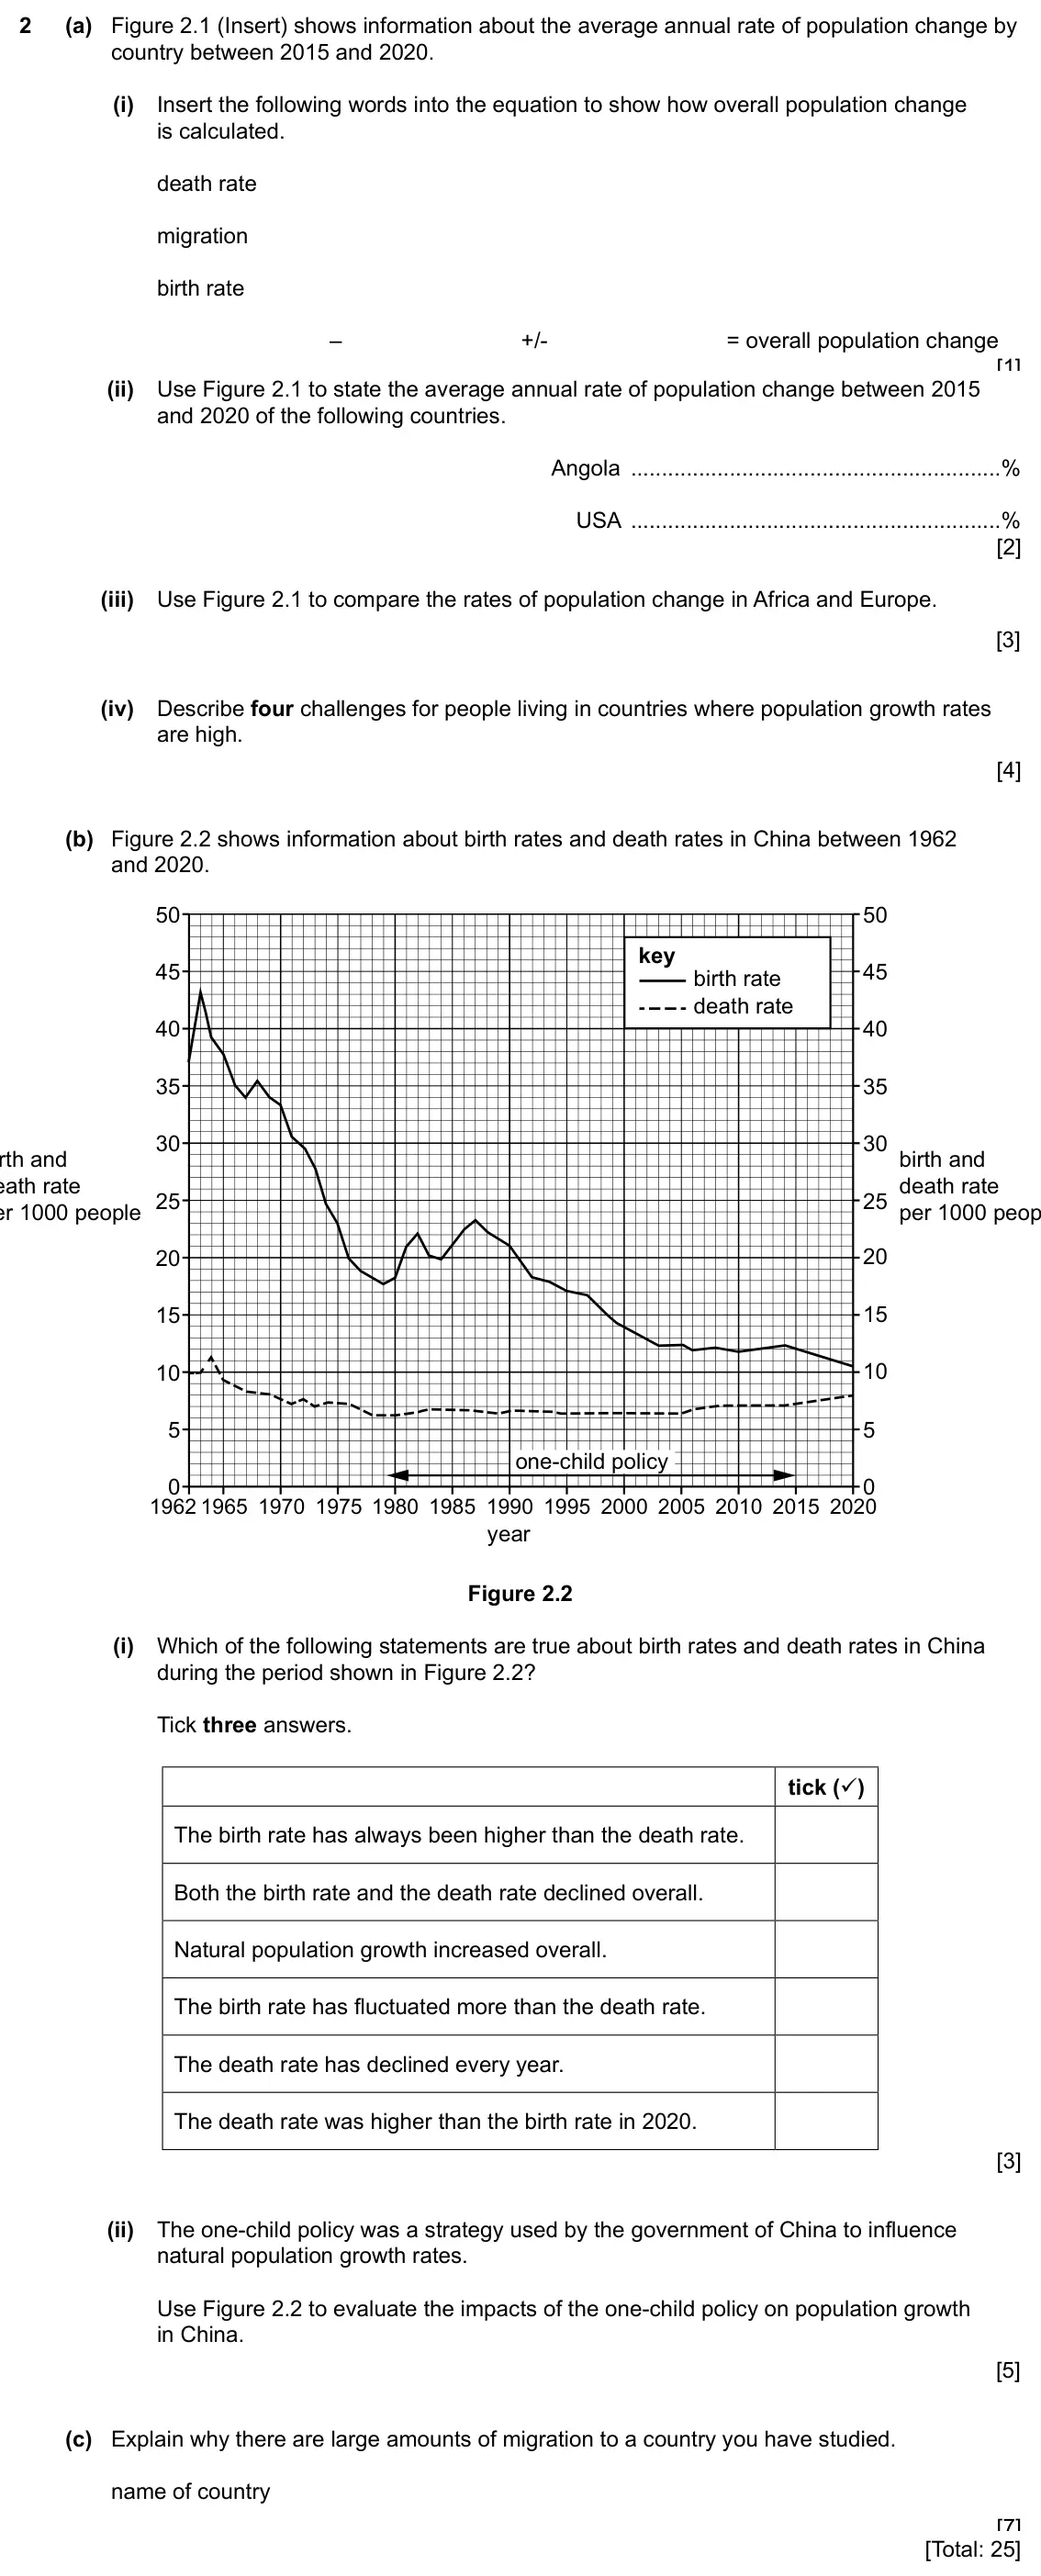
- 2027 specimen, Paper 2, Q2 (25 marks): (a) Figure 2.1 (Insert) shows information about the average annual rate of population change by country between 2015 and 2020. (i) Insert the following words in
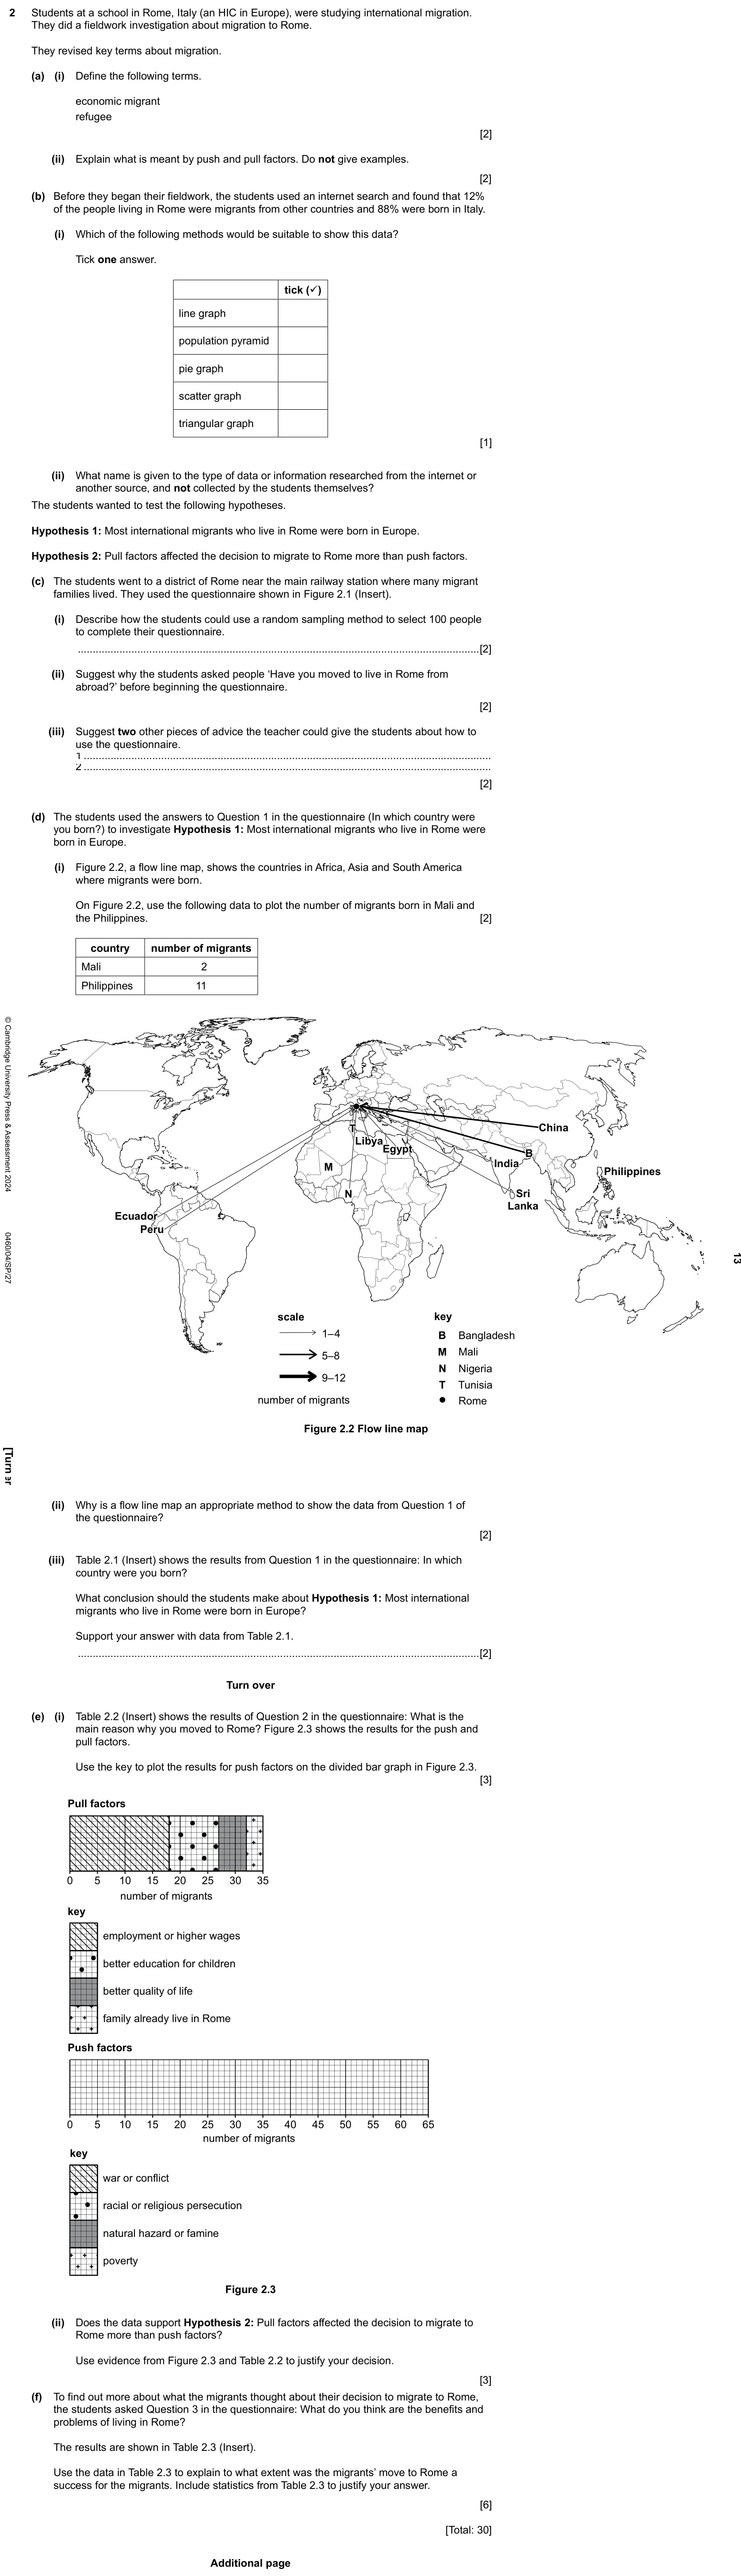
- 2027 specimen, Paper 4, Q2 (30 marks): Students at a school in Rome, Italy (an HIC in Europe), were studying international migration. They did a fieldwork investigation about migration to Rome. They
Questions, mark schemes and examiner’s reports are © Cambridge University Press & Assessment, from their published past papers. Plumi isn’t affiliated with any exam board. Want whole papers? CAIE IGCSE Geography past papers.
The Plumi iPad app also offers exam-style questions with AI feedback on your handwritten working.