 plumi
Gradients and areas under graphs: OCR GCSE Maths questions
Every OCR GCSE Maths exam question on A15 Gradients and areas under graphs, 2017–2025, with its mark scheme and examiner’s report.
Find questions921
Exam
All years
Calculator
All 14 questions on Gradients and areas under graphs, as a list
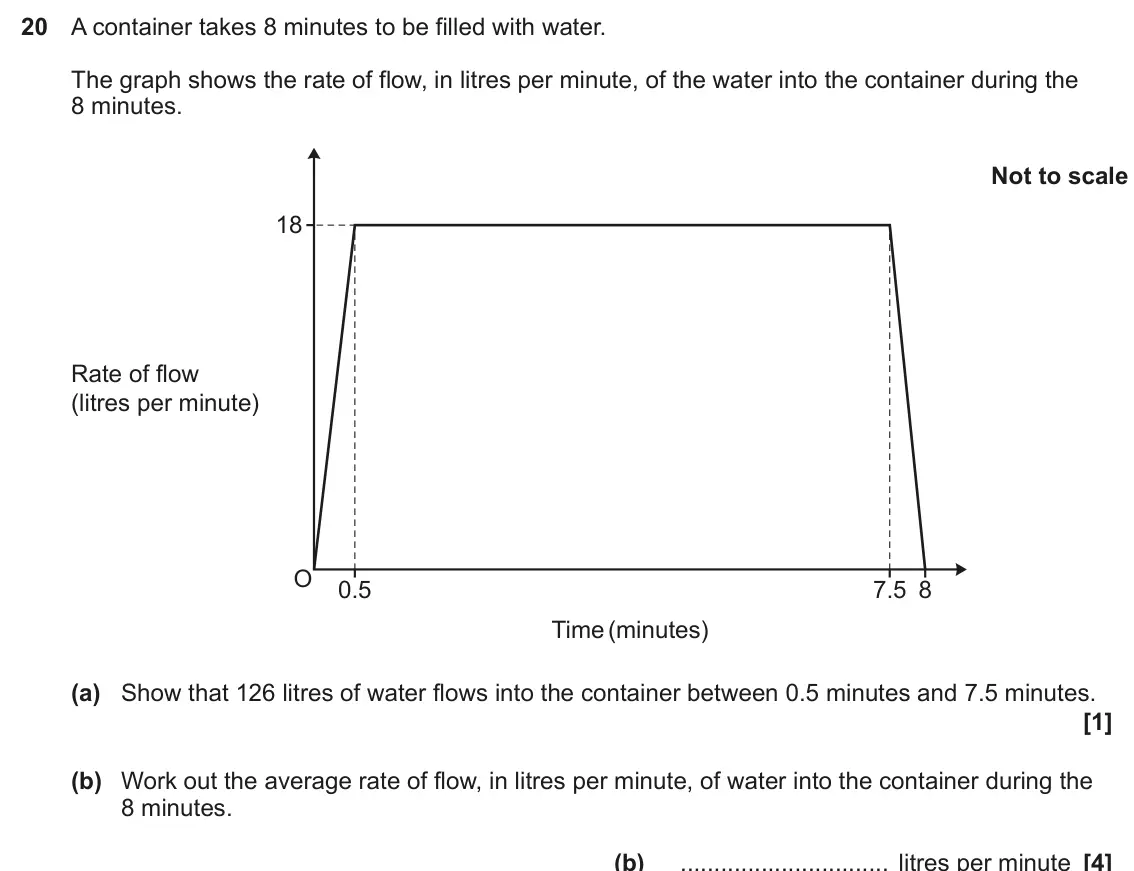
- June 2025, Paper 6, Q20 (5 marks): A container takes 8 minutes to be filled with water. The graph shows the rate of flow, in litres per minute, of the water into the container during the 8 minute
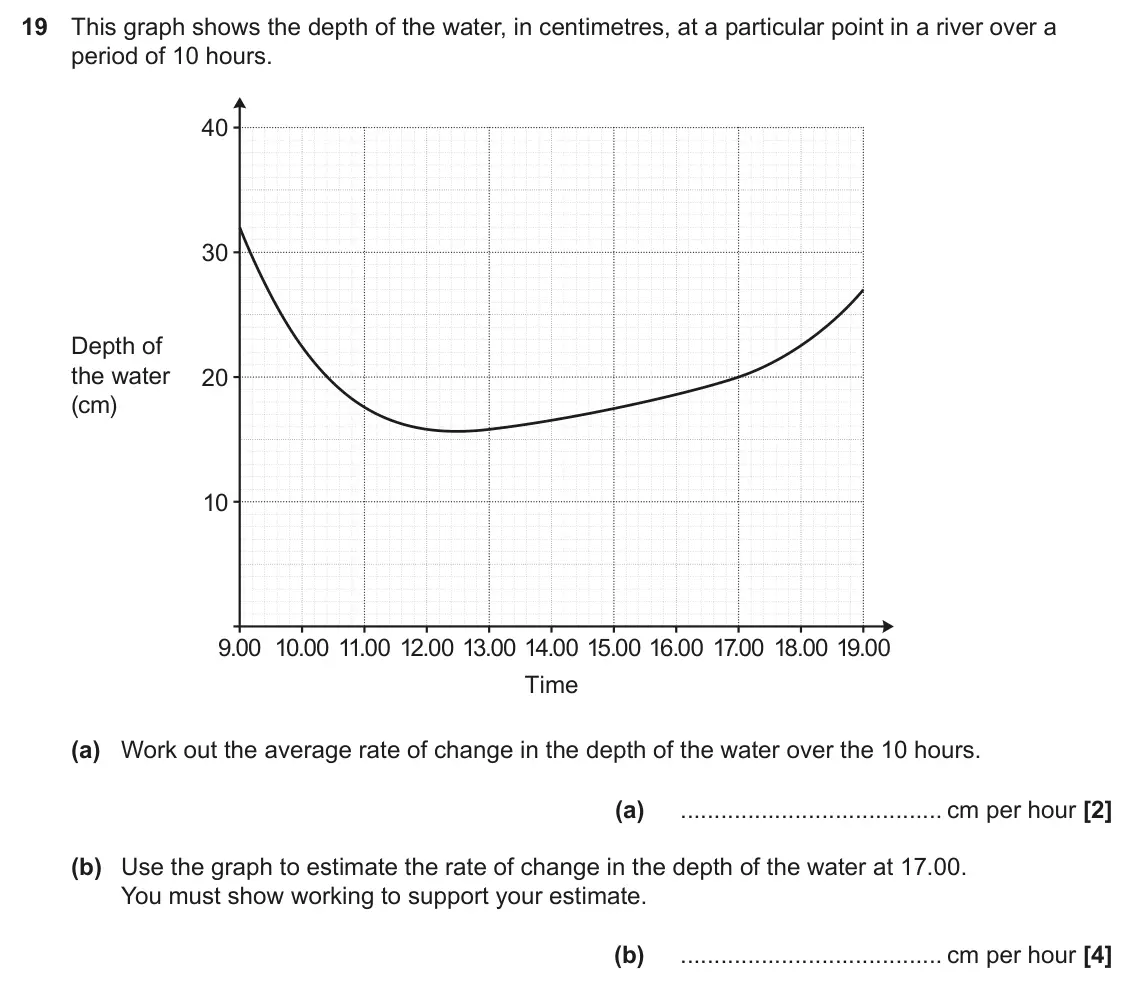
- November 2024, Paper 6, Q19 (6 marks): This graph shows the depth of the water, in centimetres, at a particular point in a river over a period of 10 hours. 40 30 Depth of the water 20 (cm) 10 9.00 10
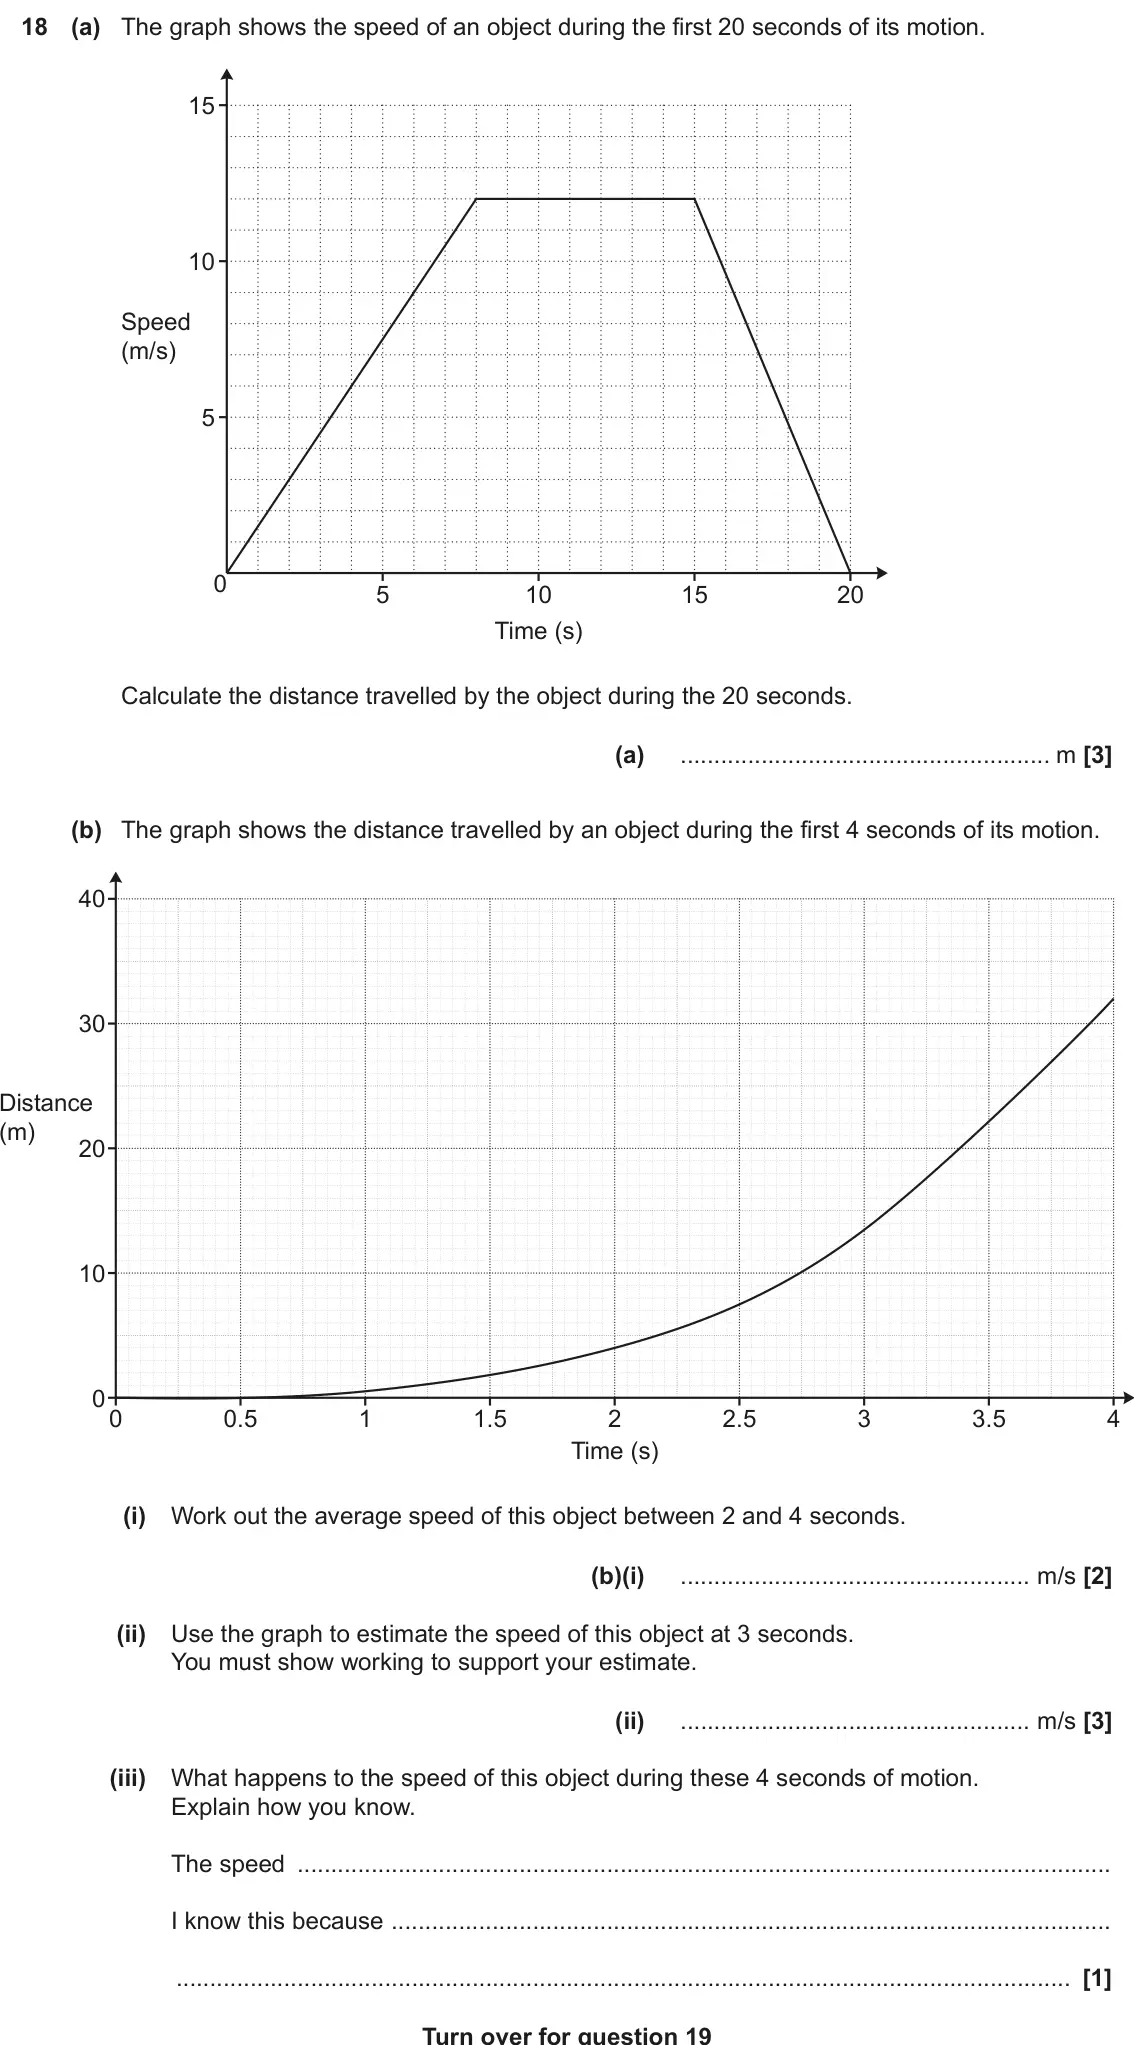
- June 2024, Paper 4, Q18 (9 marks): (a) The graph shows the speed of an object during the first 20 seconds of its motion. 15 10 Speed (m/s) 5 0 5 10 15 20 Time (s) Calculate the distance travelled
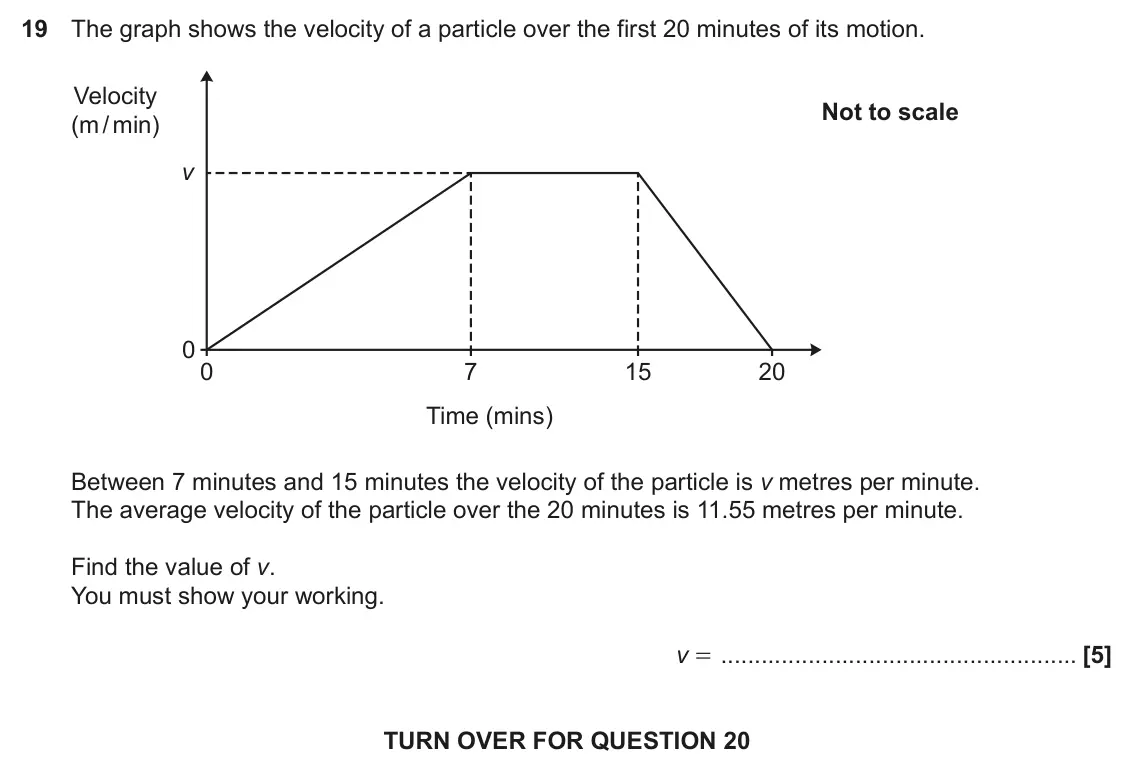
- June 2023, Paper 4, Q19 (5 marks): The graph shows the velocity of a particle over the first 20 minutes of its motion. Velocity Not to scale (m / min) v 0 0 7 15 20 Time (mins) Between 7 minutes
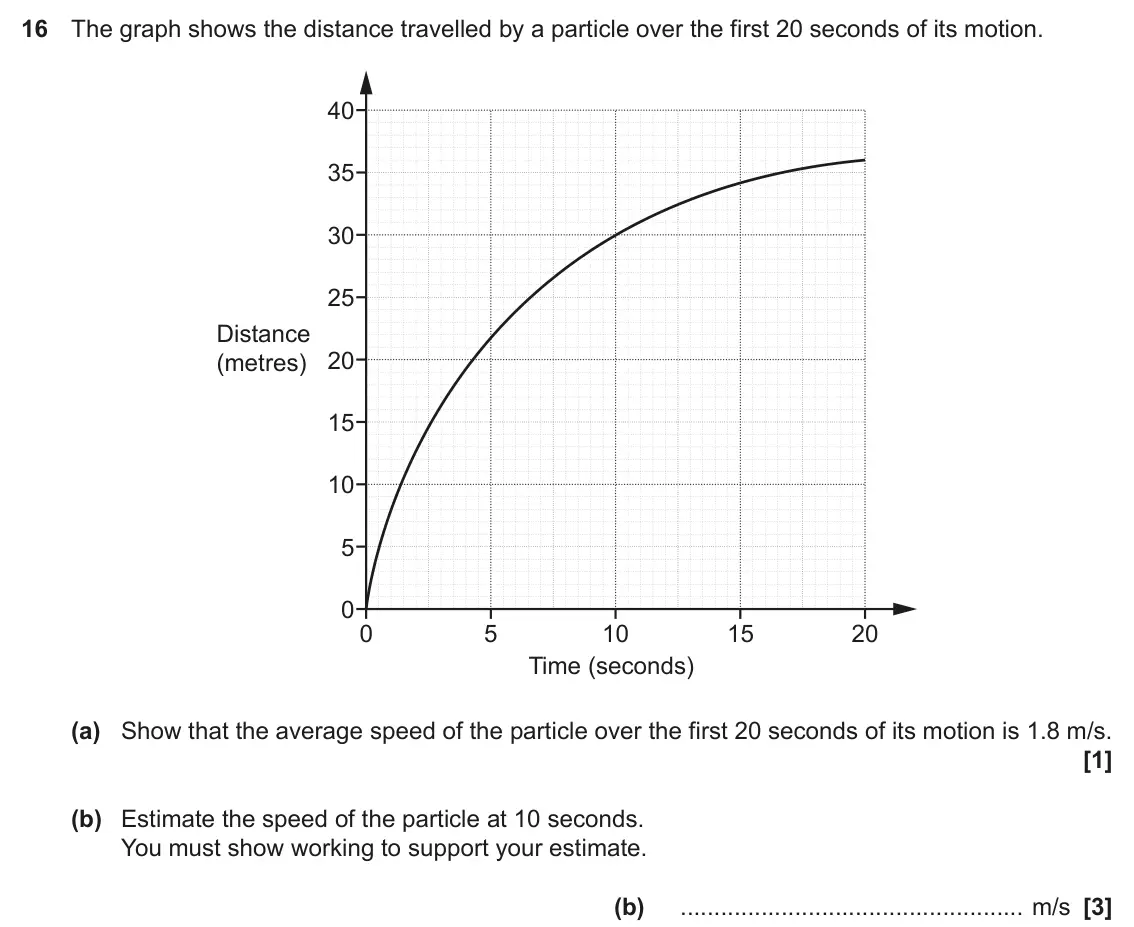
- November 2022, Paper 5, Q16 (4 marks): The graph shows the distance travelled by a particle over the first 20 seconds of its motion. 40 35 30 25 Distance 20 (metres) 15 10 5 0 0 5 10 15 20 Time (seco
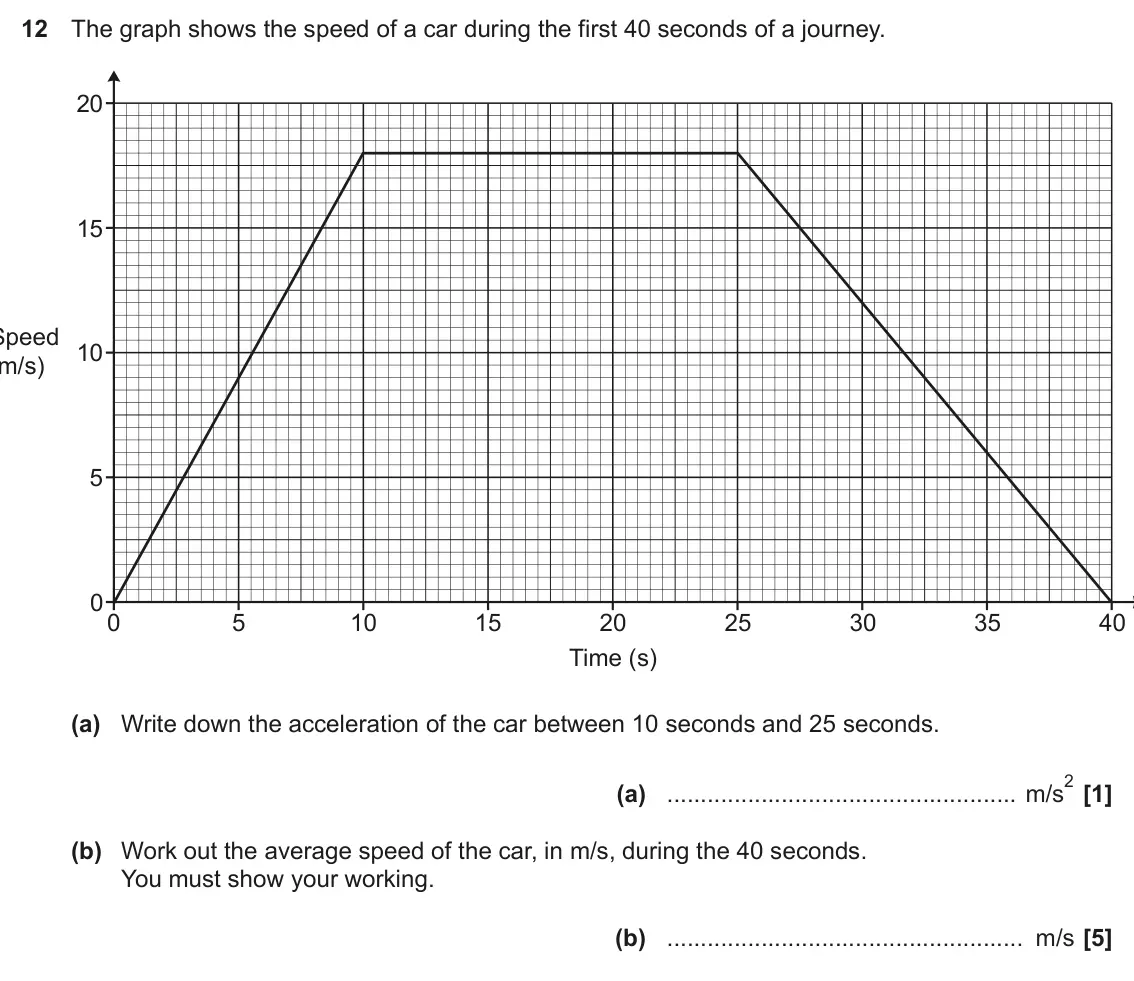
- November 2022, Paper 6, Q12 (6 marks): The graph shows the speed of a car during the first 40 seconds of a journey. 20 15 Speed 10 (m/s) 5 0 0 5 10 15 20 25 30 35 40 Time (s) (a) Write down the accel
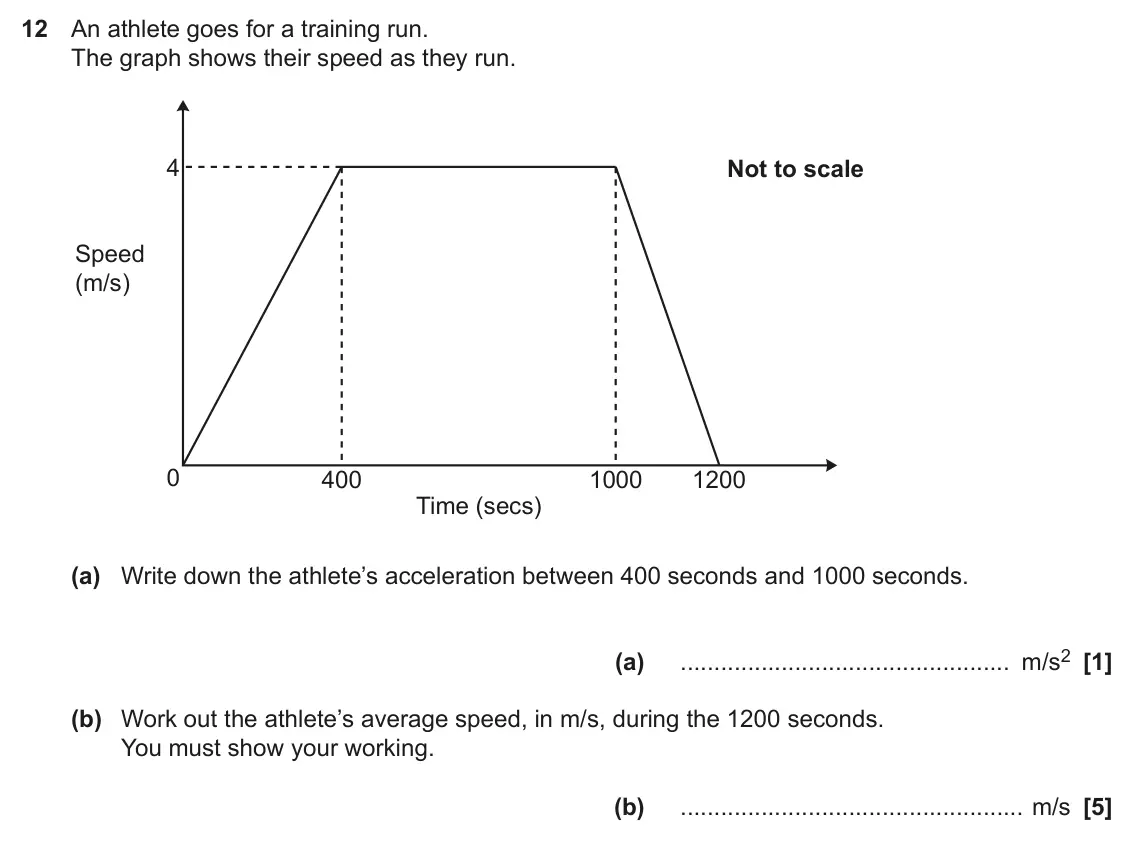
- June 2022, Paper 5, Q12 (6 marks): An athlete goes for a training run. The graph shows their speed as they run. 4 Not to scale Speed (m/s) 0 400 1000 1200 Time (secs) (a) Write down the athlete’s
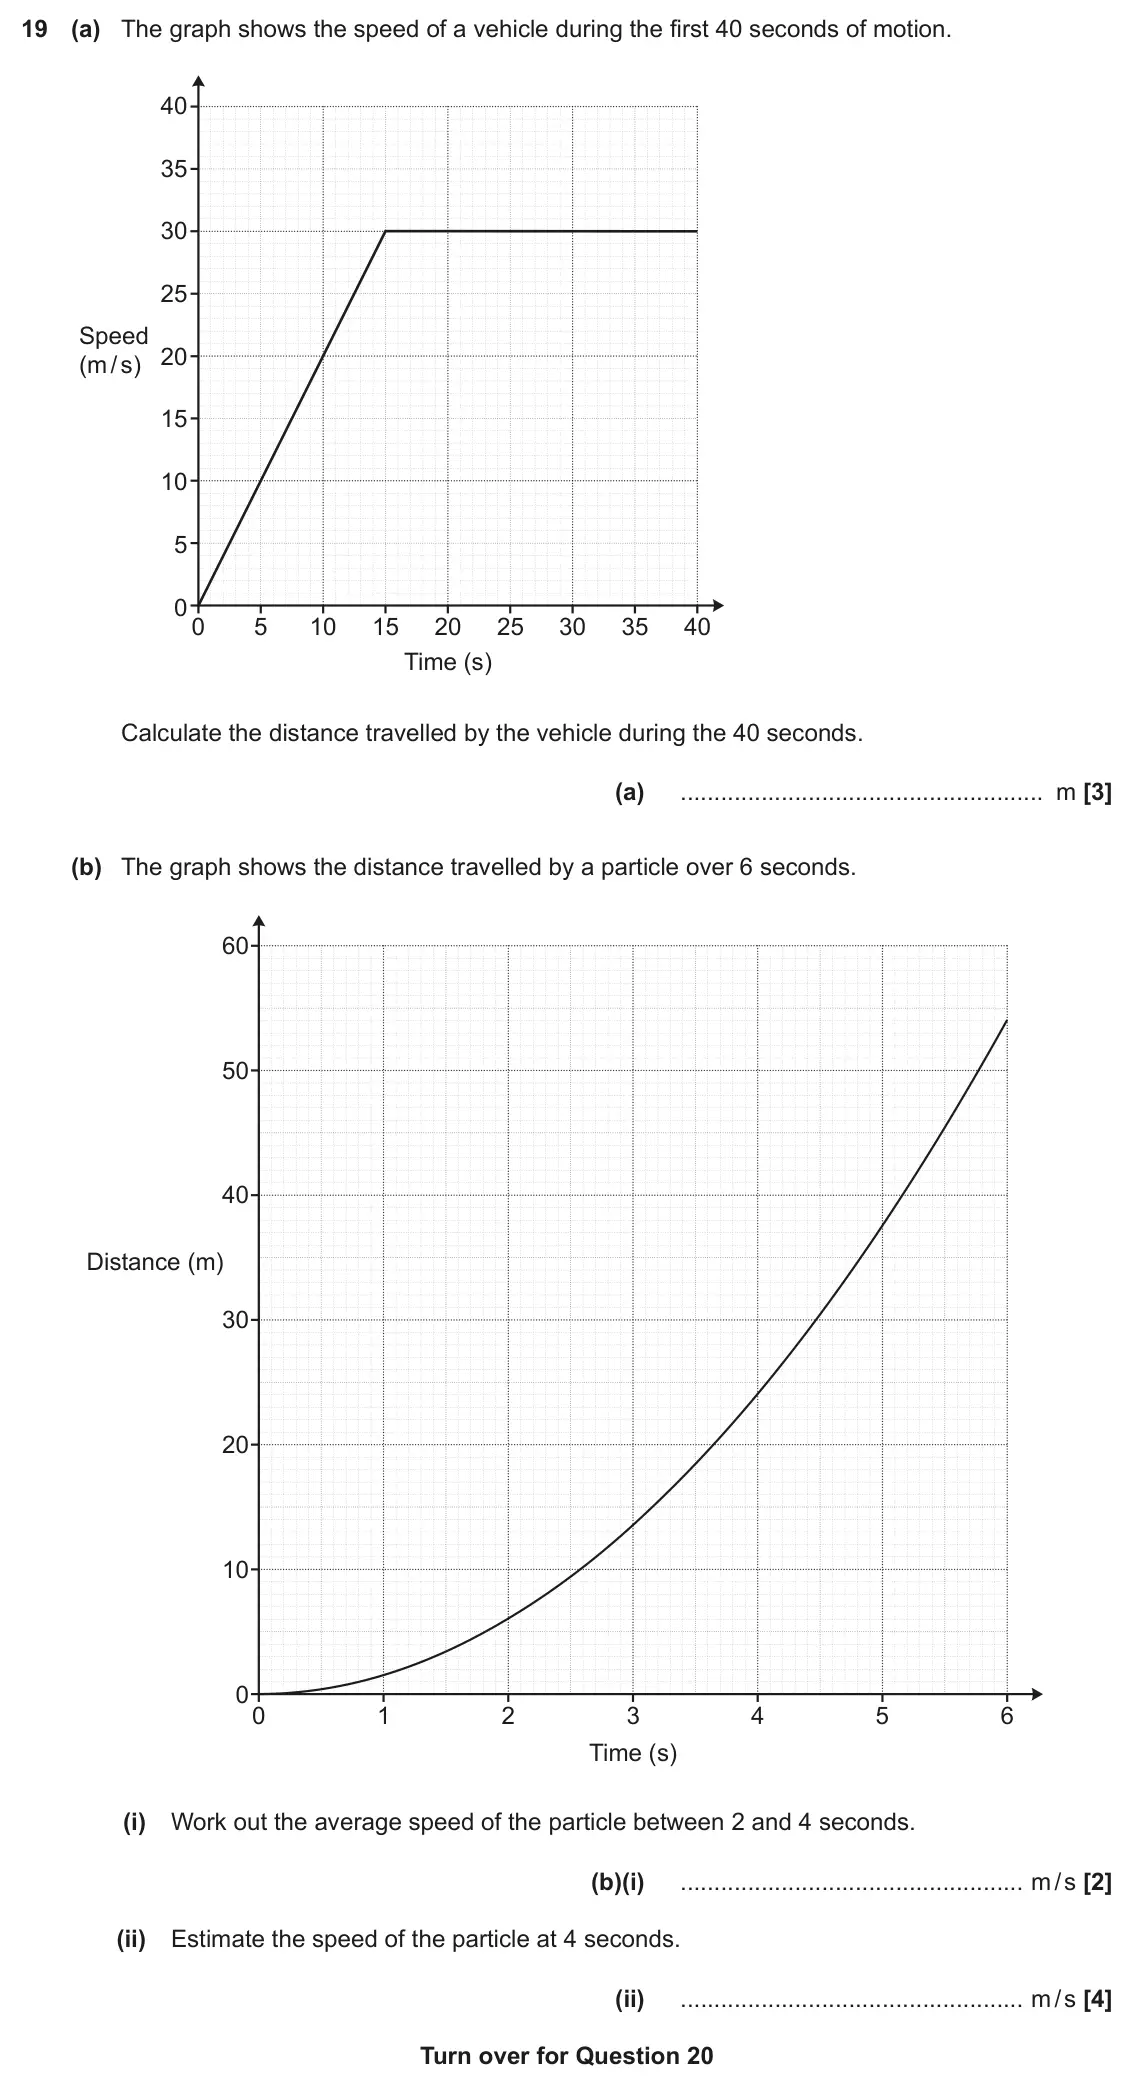
- November 2020, Paper 4, Q19 (9 marks): (a) The graph shows the speed of a vehicle during the first 40 seconds of motion. 40 35 30 25 Speed 20 (m / s) 15 10 5 0 0 5 10 15 20 25 30 35 40 Time (s) Calcu
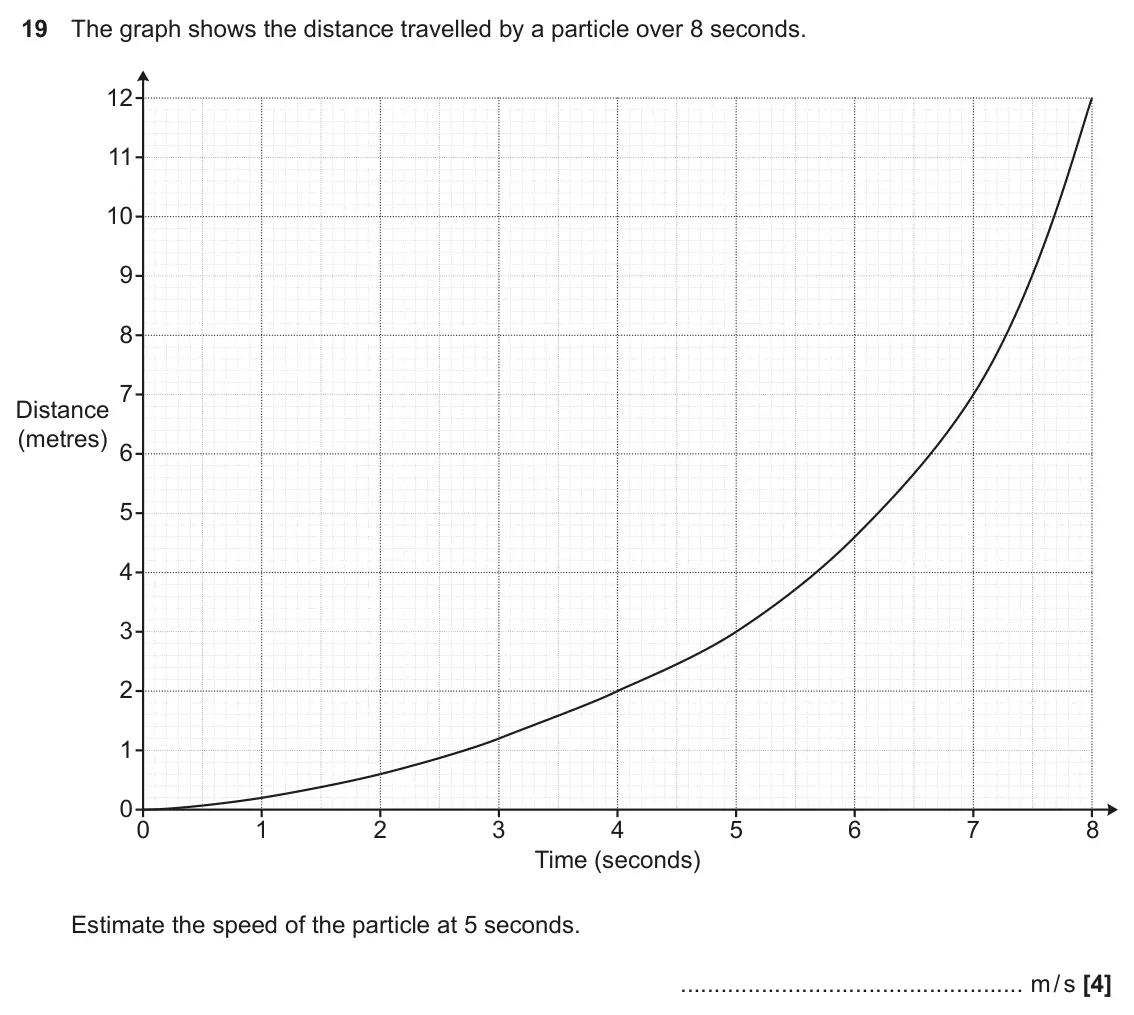
- November 2019, Paper 4, Q19 (4 marks): The graph shows the distance travelled by a particle over 8 seconds. 12 11 10 9 8 7 Distance (metres) 6 5 4 3 2 1 0 0 1 2 3 4 5 6 7 8 Time (seconds) Estimate th
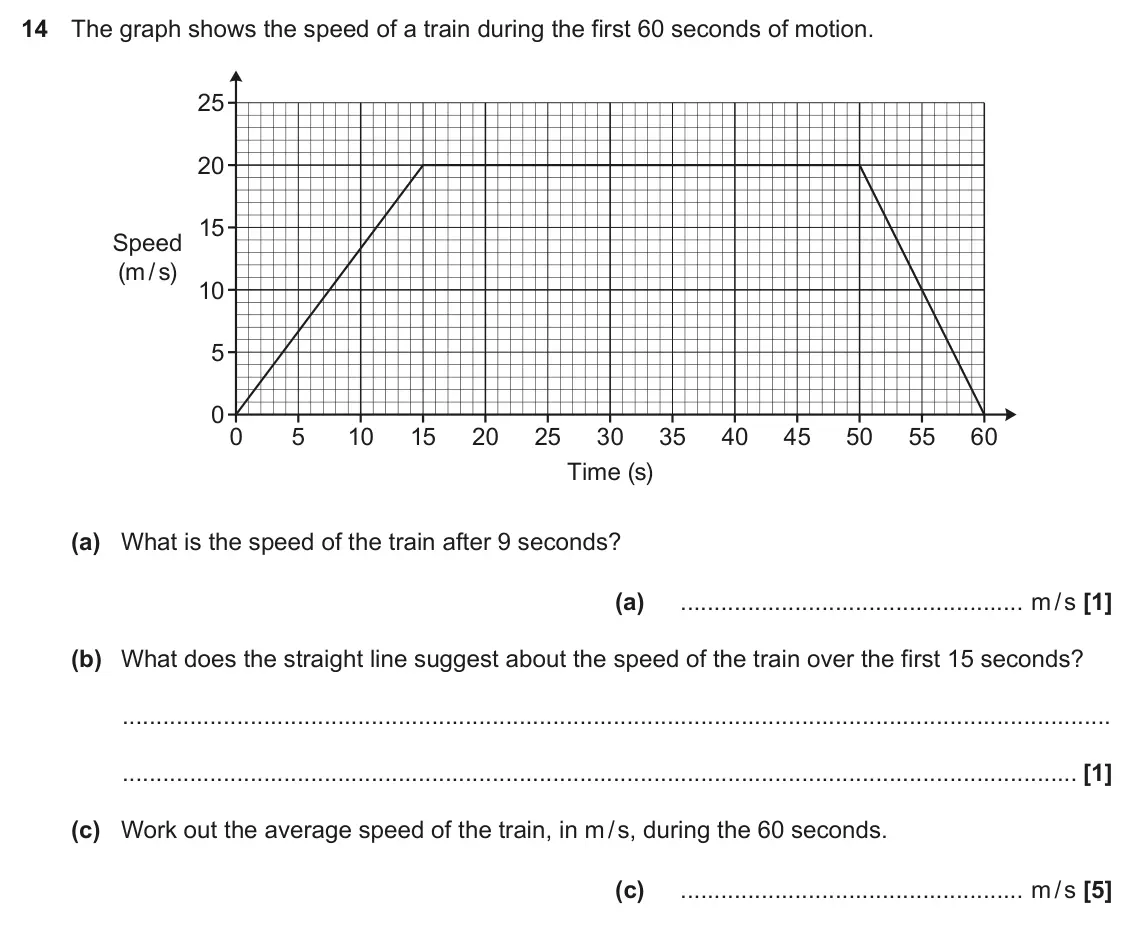
- June 2019, Paper 4, Q14 (7 marks): The graph shows the speed of a train during the first 60 seconds of motion. 25 20 15 Speed (m / s) 10 5 0 0 5 10 15 20 25 30 35 40 45 50 55 60 Time (s) (a) What
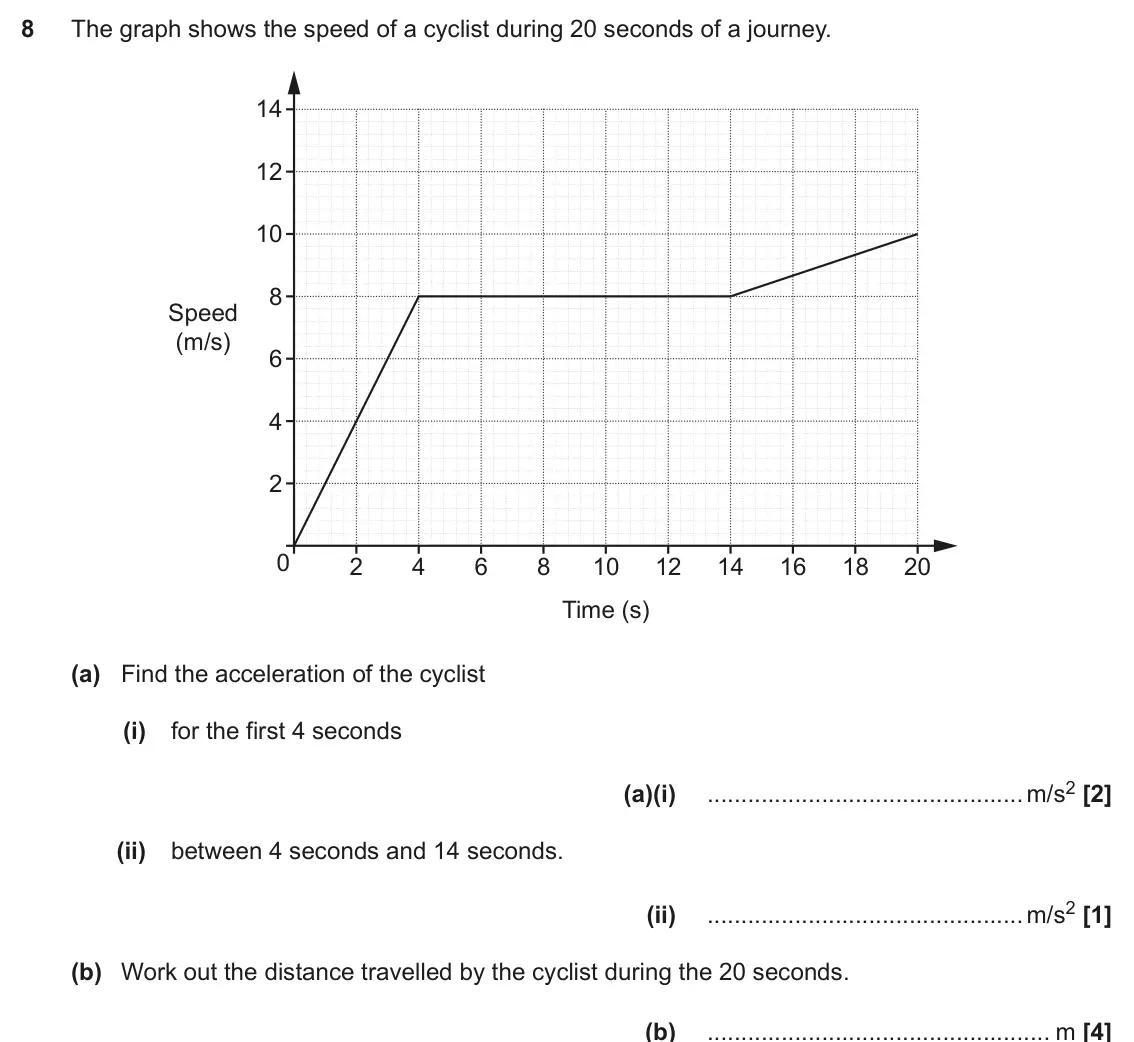
- November 2018, Paper 6, Q8 (7 marks): The graph shows the speed of a cyclist during 20 seconds of a journey. 14 12 10 8 Speed (m/s) 6 4 2 0 2 4 6 8 10 12 14 16 18 20 Time (s) (a) Find the accelerati
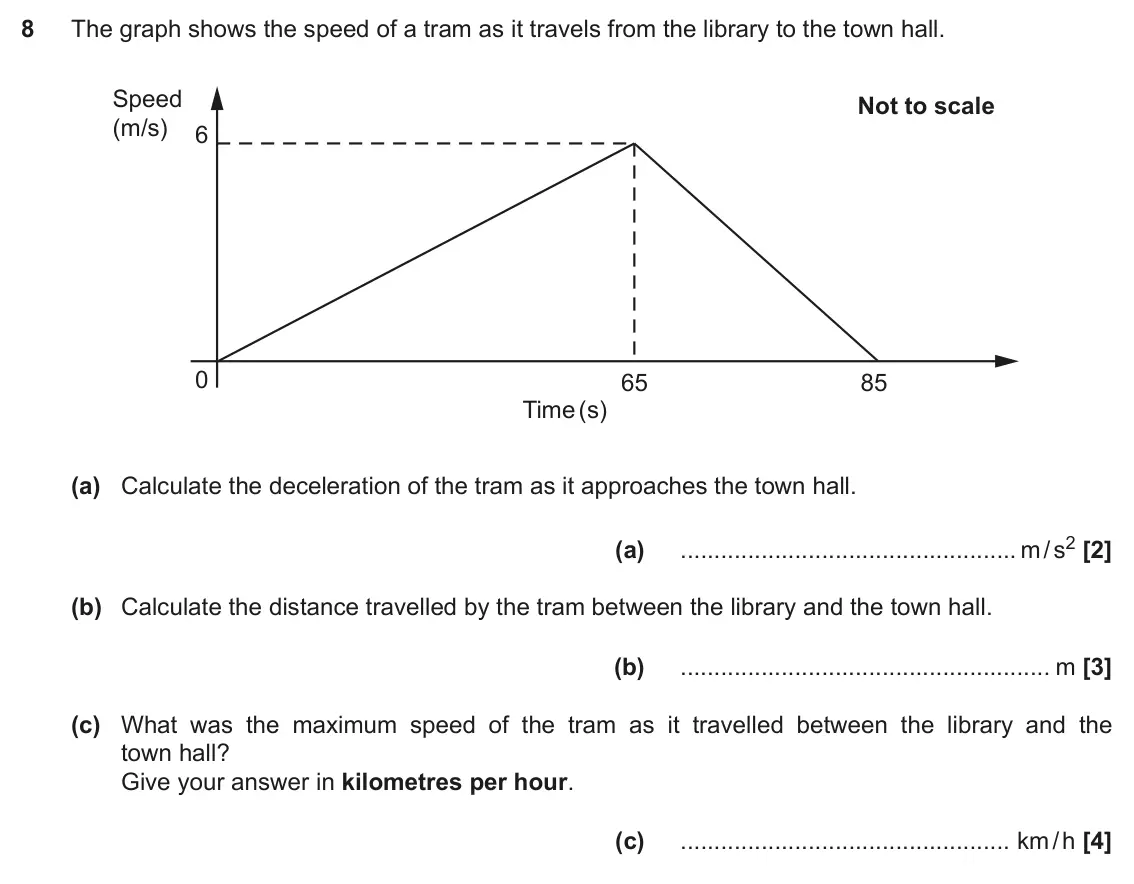
- June 2018, Paper 6, Q8 (9 marks): The graph shows the speed of a tram as it travels from the library to the town hall. Speed Not to scale (m/s) 6 0 65 85 Time (s) (a) Calculate the deceleration
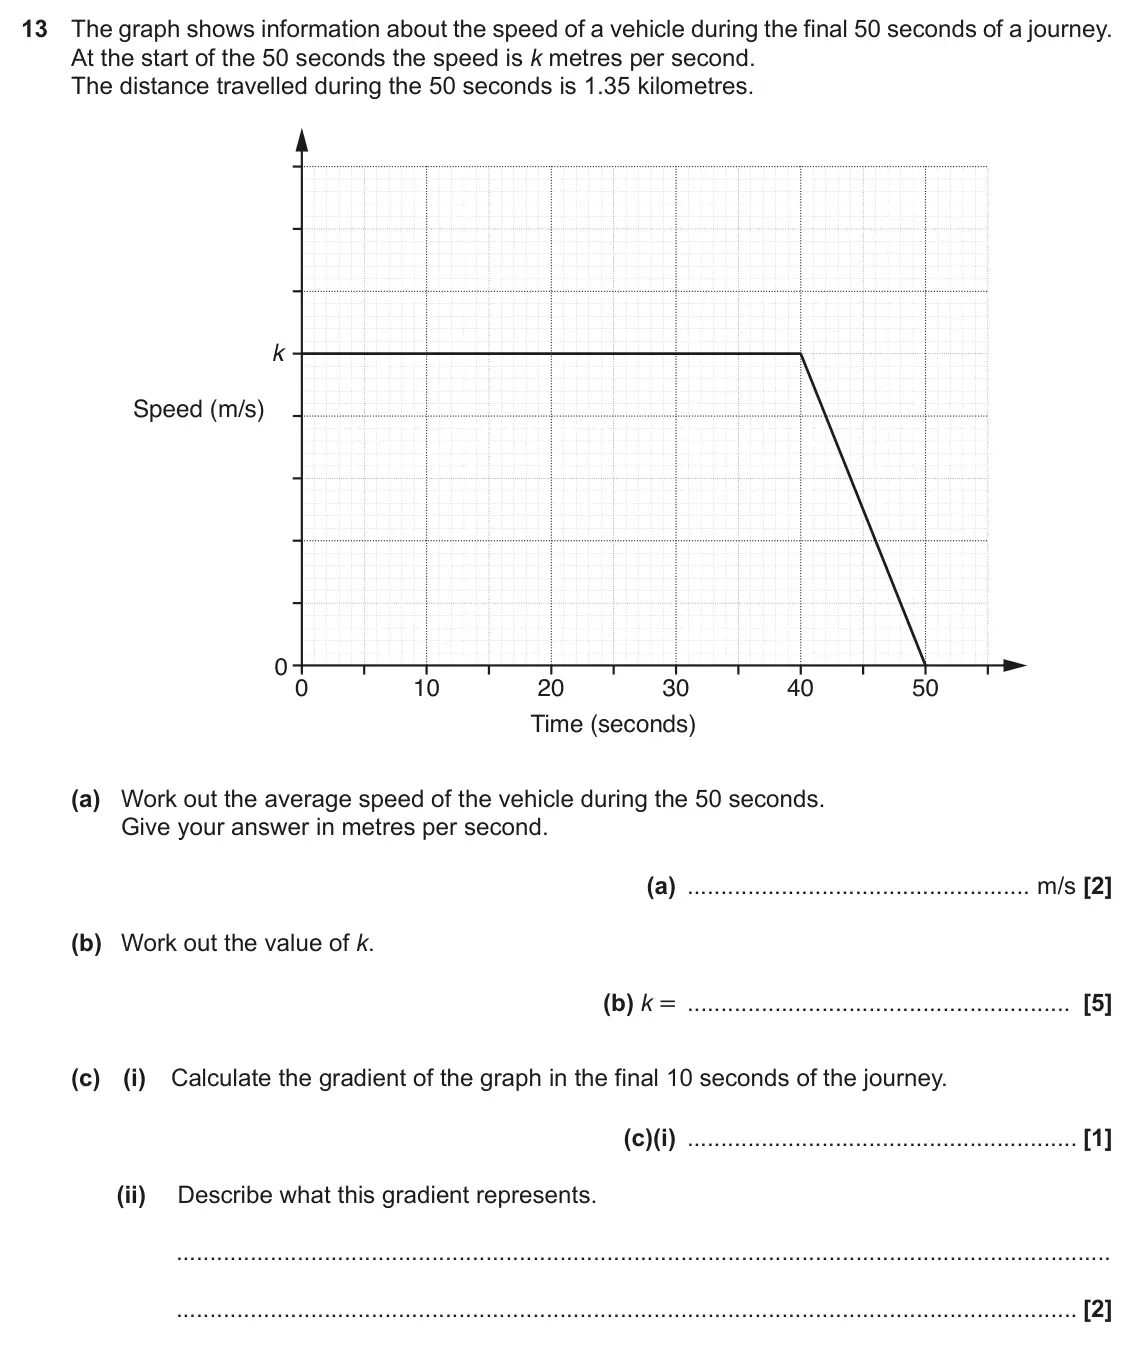
- November 2017, Paper 5, Q13 (10 marks): The graph shows information about the speed of a vehicle during the final 50 seconds of a journey. At the start of the 50 seconds the speed is k metres per seco
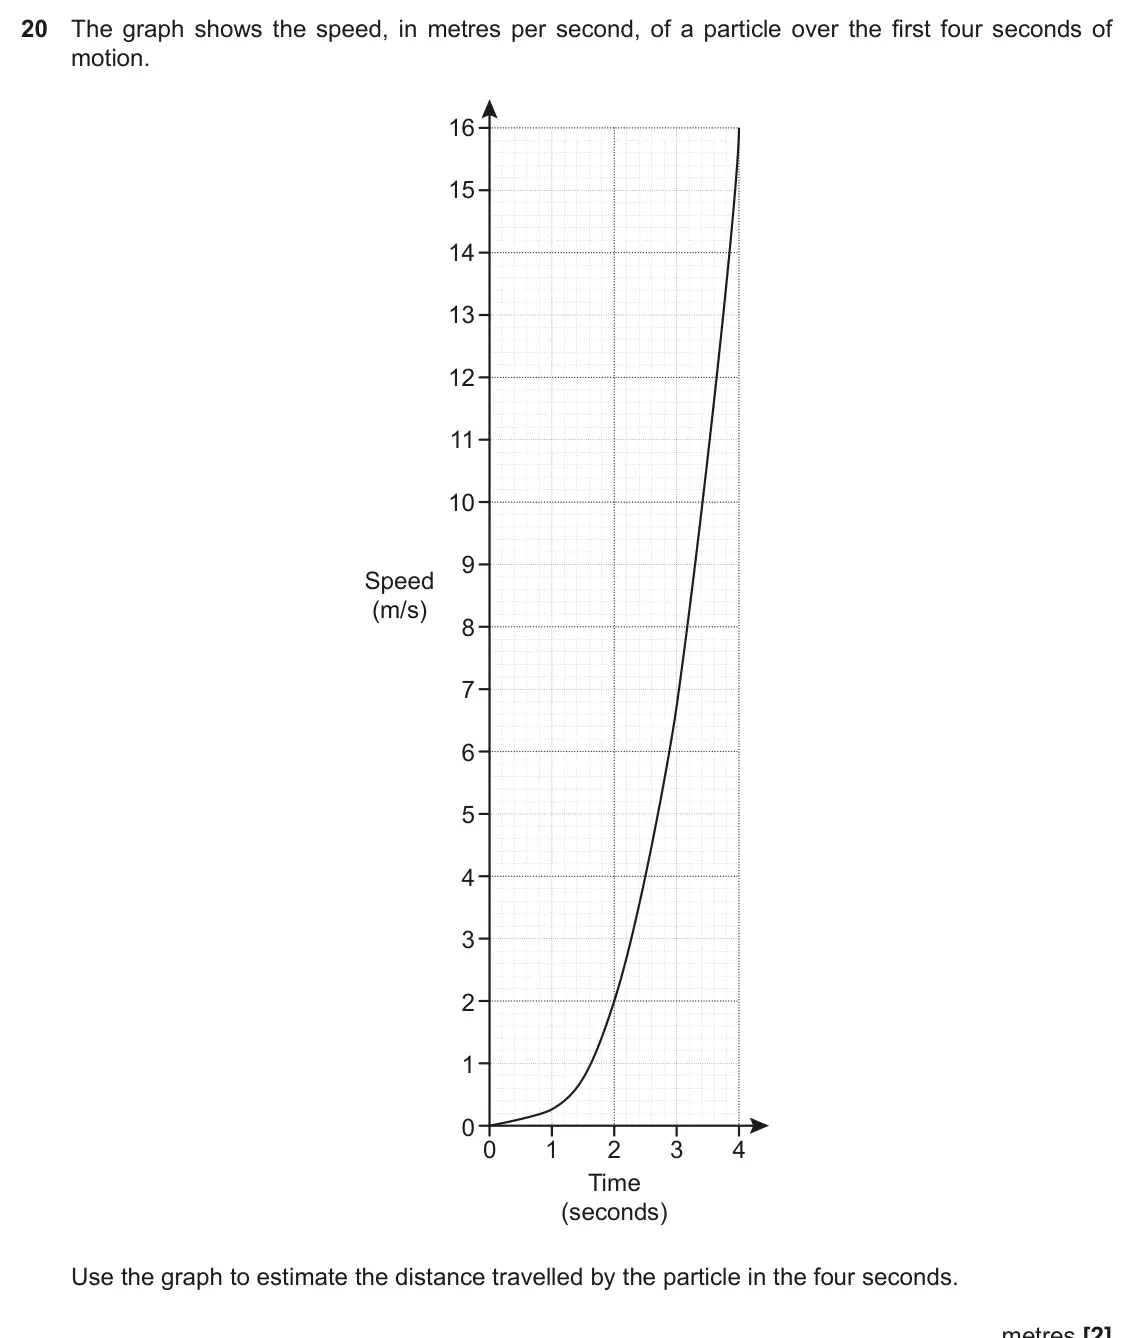
- June 2017, Paper 4, Q20 (2 marks): The graph shows the speed, in metres per second, of a particle over the first four seconds of motion. 16 15 14 13 12 11 10 9 Speed (m/s) 8 7 6 5 4 3 2 1 0 0 1 2
Questions, mark schemes and examiner’s reports are © OCR, from their published past papers. Plumi isn’t affiliated with any exam board. Want whole papers? Every OCR GCSE Maths paper.
Rather write your answers by hand on iPad? Plumi marks them against the same mark schemes.