 plumi
Instantaneous and average rates of change: OCR GCSE Maths questions
Every OCR GCSE Maths exam question on R15 Instantaneous and average rates of change, 2017–2025, with its mark scheme and examiner’s report.
Find questions921
Exam
All years
Calculator
All 6 questions on Instantaneous and average rates of change, as a list
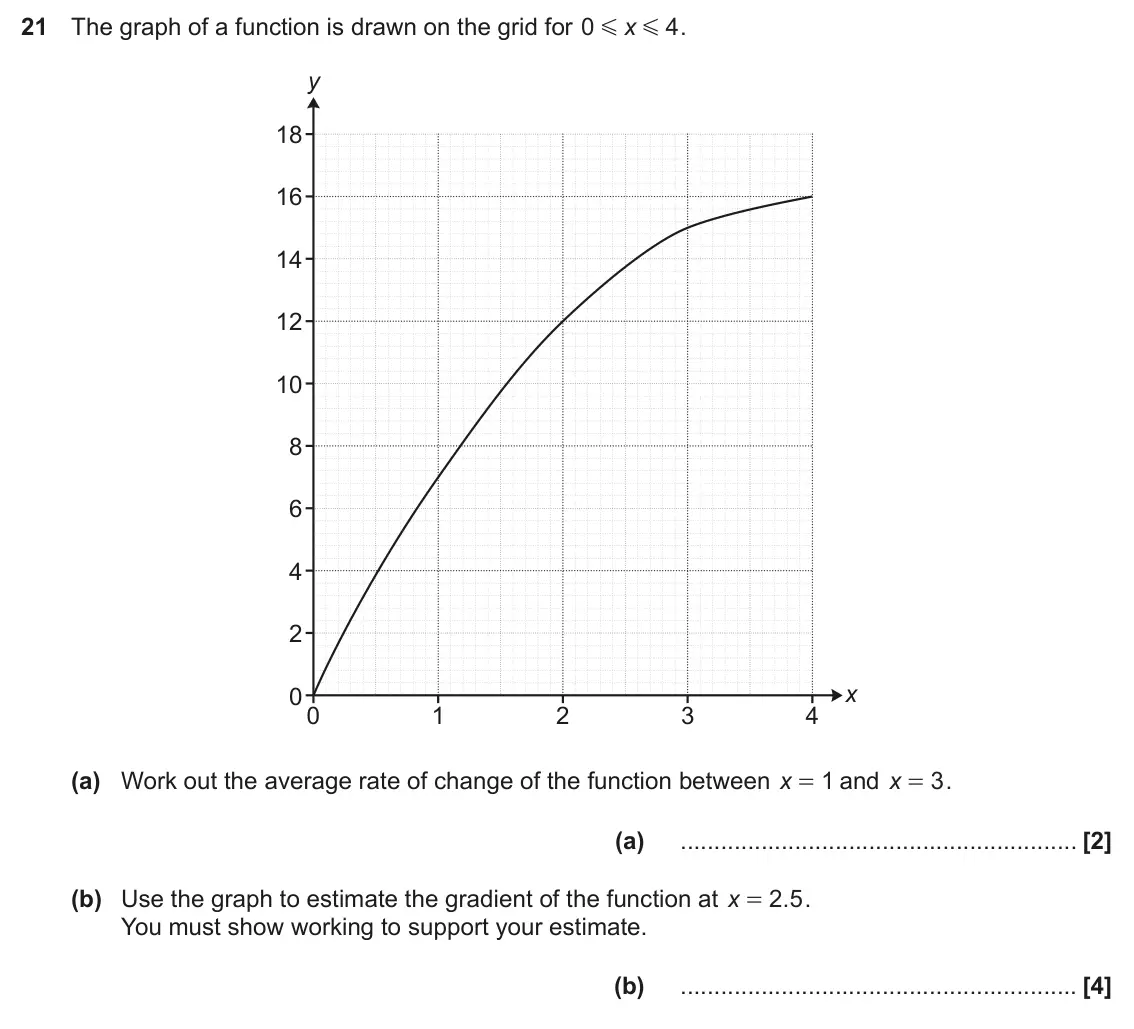
- June 2025, Paper 4, Q21 (6 marks): The graph of a function is drawn on the grid for 0 x 4 . G G y 18 16 14 12 10 8 6 4 2 x 0 0 1 2 3 4 (a) Work out the average rate of change of the function betw
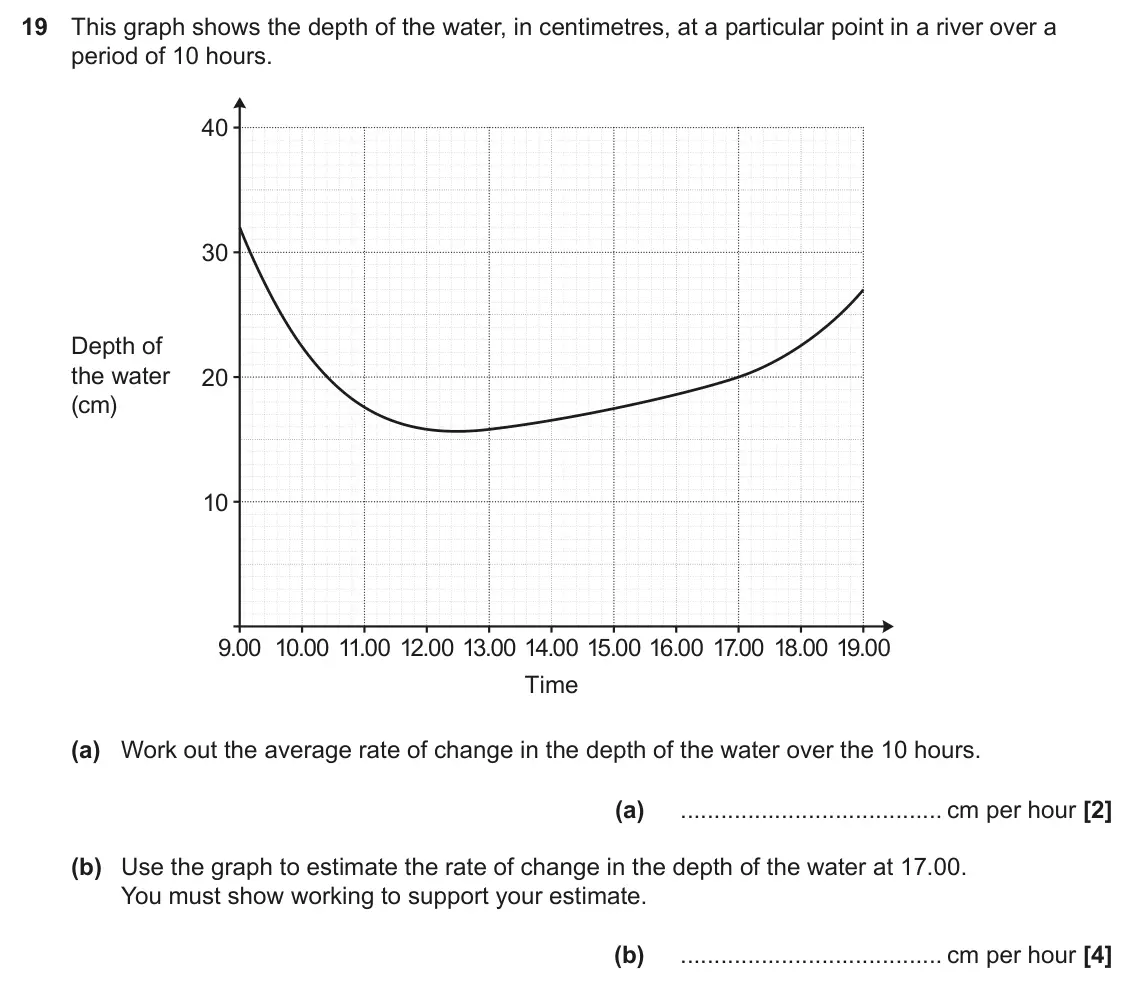
- November 2024, Paper 6, Q19 (6 marks): This graph shows the depth of the water, in centimetres, at a particular point in a river over a period of 10 hours. 40 30 Depth of the water 20 (cm) 10 9.00 10
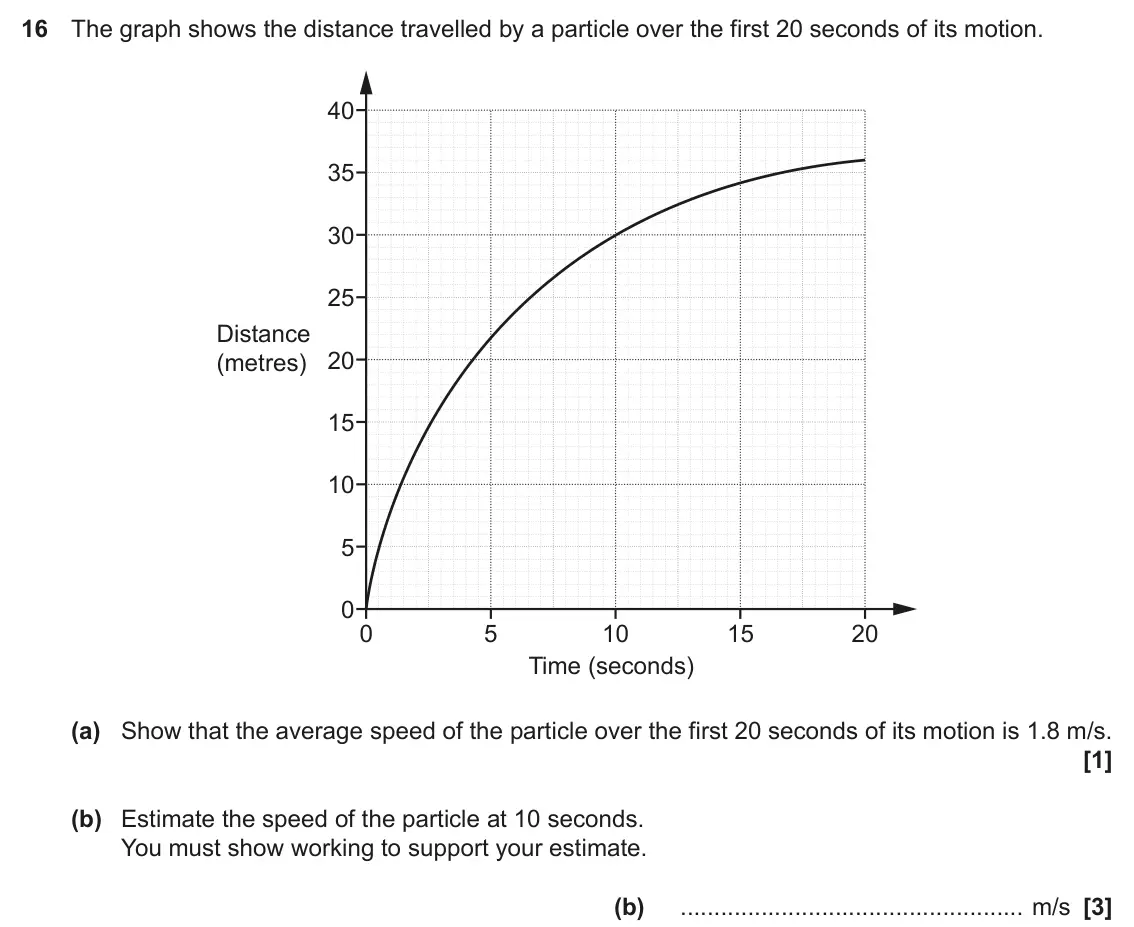
- November 2022, Paper 5, Q16 (4 marks): The graph shows the distance travelled by a particle over the first 20 seconds of its motion. 40 35 30 25 Distance 20 (metres) 15 10 5 0 0 5 10 15 20 Time (seco
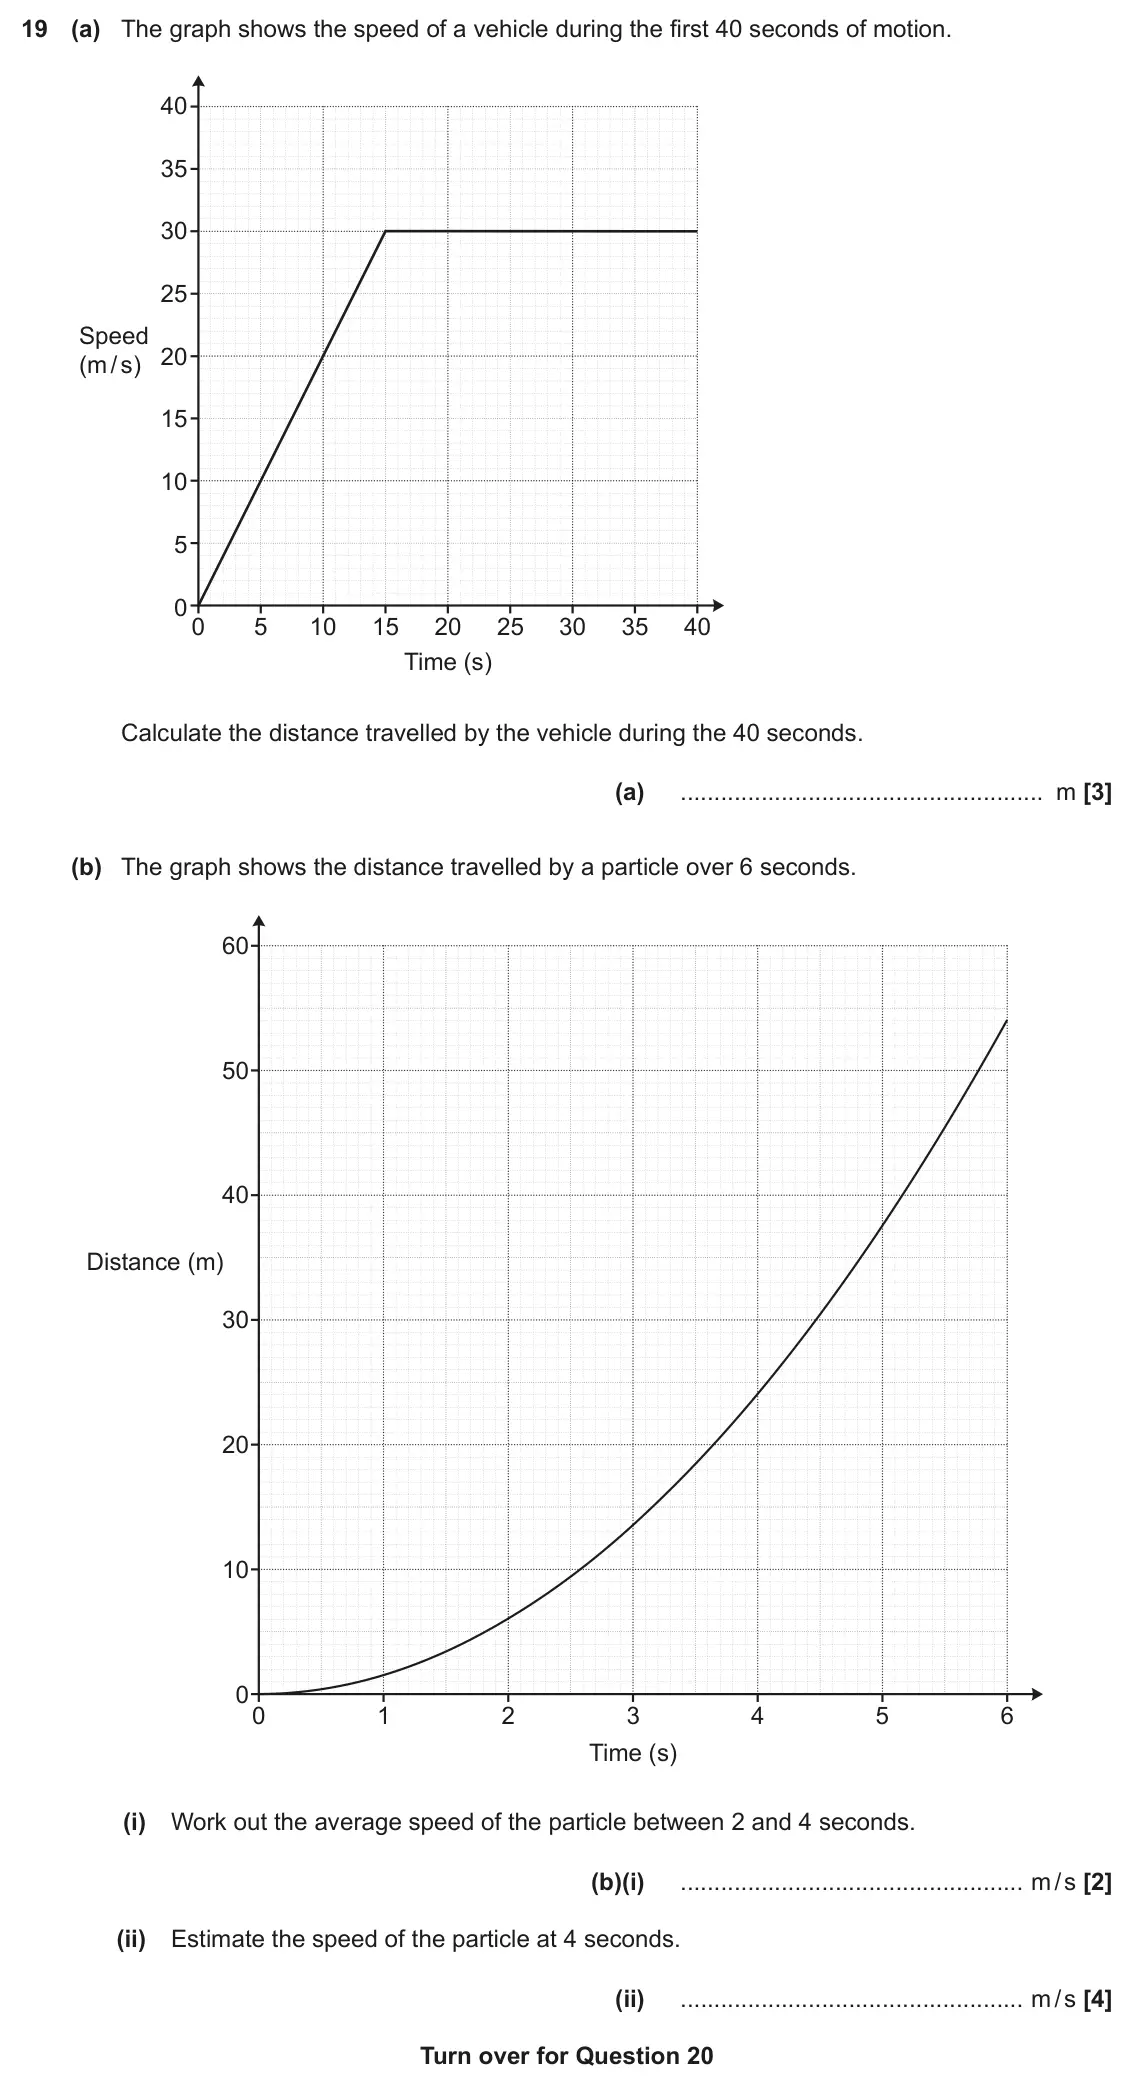
- November 2020, Paper 4, Q19 (9 marks): (a) The graph shows the speed of a vehicle during the first 40 seconds of motion. 40 35 30 25 Speed 20 (m / s) 15 10 5 0 0 5 10 15 20 25 30 35 40 Time (s) Calcu
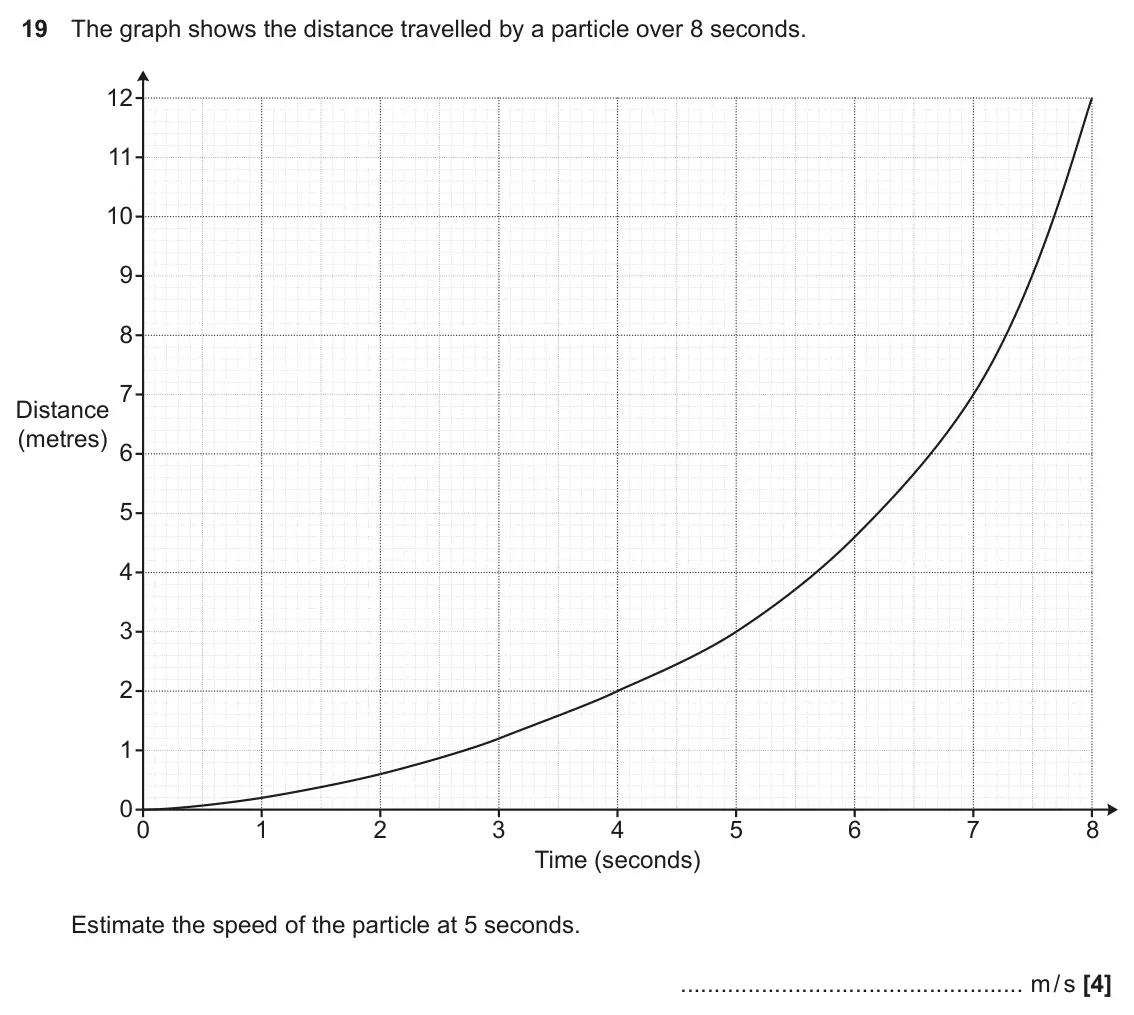
- November 2019, Paper 4, Q19 (4 marks): The graph shows the distance travelled by a particle over 8 seconds. 12 11 10 9 8 7 Distance (metres) 6 5 4 3 2 1 0 0 1 2 3 4 5 6 7 8 Time (seconds) Estimate th
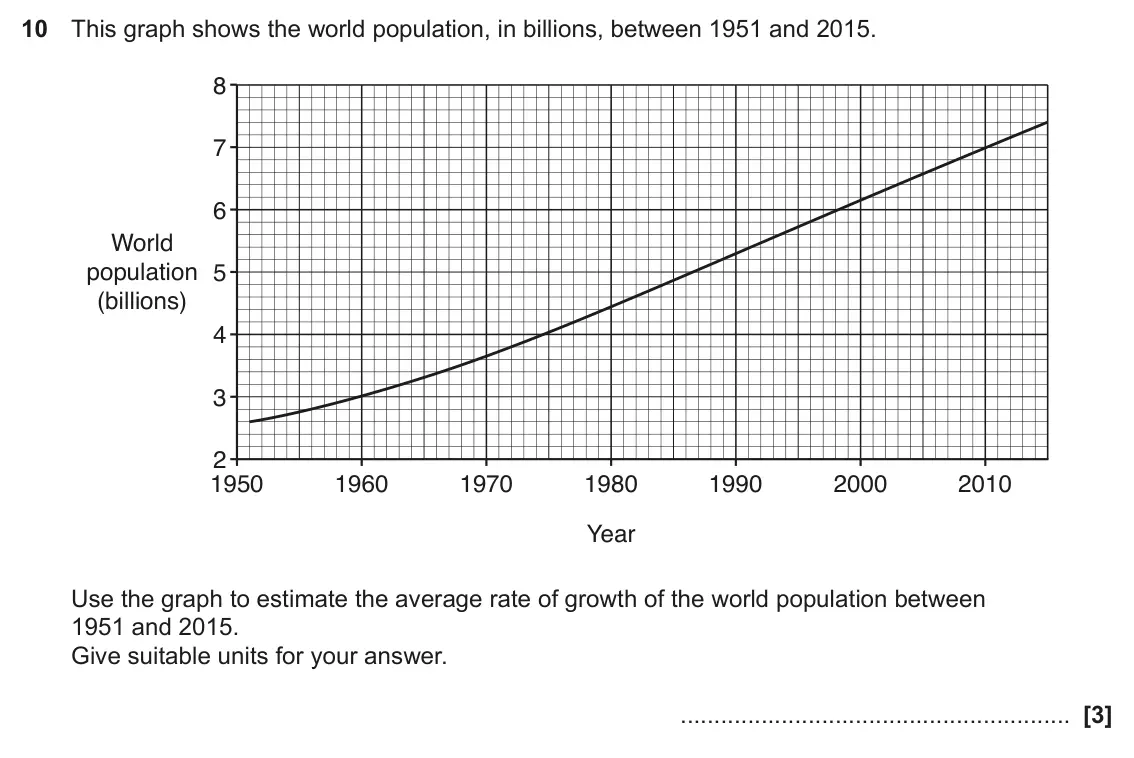
- November 2017, Paper 6, Q10 (3 marks): This graph shows the world population, in billions, between 1951 and 2015. 8 7 6 World population 5 (billions) 4 3 2 1950 1960 1970 1980 1990 2000 2010 Year Use
Questions, mark schemes and examiner’s reports are © OCR, from their published past papers. Plumi isn’t affiliated with any exam board. Want whole papers? Every OCR GCSE Maths paper.
Rather write your answers by hand on iPad? Plumi marks them against the same mark schemes.