 plumi
Inferential statistics: Eduqas A‑Level Psychology questions
Eduqas A-Level Psychology past-paper questions on Inferential statistics, 2017–2025, with mark schemes and examiner’s reports where available.
Paper
All papers
Exam
All years
Calculations
Loading the full question list…
Q2(a)
The whole paper ↗Q2(b)
The whole paper ↗Q2(c)
The whole paper ↗Q6(a)
The whole paper ↗Q10(c)(ii)
The whole paper ↗Q10(c)(iii)
The whole paper ↗Q11(c)
The whole paper ↗Q8(d)
The whole paper ↗Q10(c)(i)
The whole paper ↗Q10(c)(ii)
The whole paper ↗Q10(c)(iii)
The whole paper ↗Q2(a)
The whole paper ↗Q2(b)
The whole paper ↗Q2(c)
The whole paper ↗Q2(d)
The whole paper ↗Q10(c)
The whole paper ↗Q11(c)
The whole paper ↗Q7(d)
The whole paper ↗Q10(c)
The whole paper ↗Q10(d)(i)
The whole paper ↗

















All 38 questions on Inferential statistics, as a list
- June 2025, Component 2, Q2(a) (1 mark): (a) equal to [1]
- June 2025, Component 2, Q2(b) (1 mark): (b) greater than [1]
- June 2025, Component 2, Q2(c) (2 marks): (c) probability of less than 10% [2]
- June 2025, Component 2, Q6(a) (2 marks): 6. (a) Explain the difference between p<0.01 and p<0.05. [2]
- June 2025, Component 2, Q10(c)(ii) (1 mark): (ii) Identify the inferential statistic you used to analyse the data you collected for your correlational study. [1]
- June 2025, Component 2, Q10(c)(iii) (2 marks): (iii) Explain two reasons why the inferential statistic identified in 10(c)(ii) was appropriate. [2]
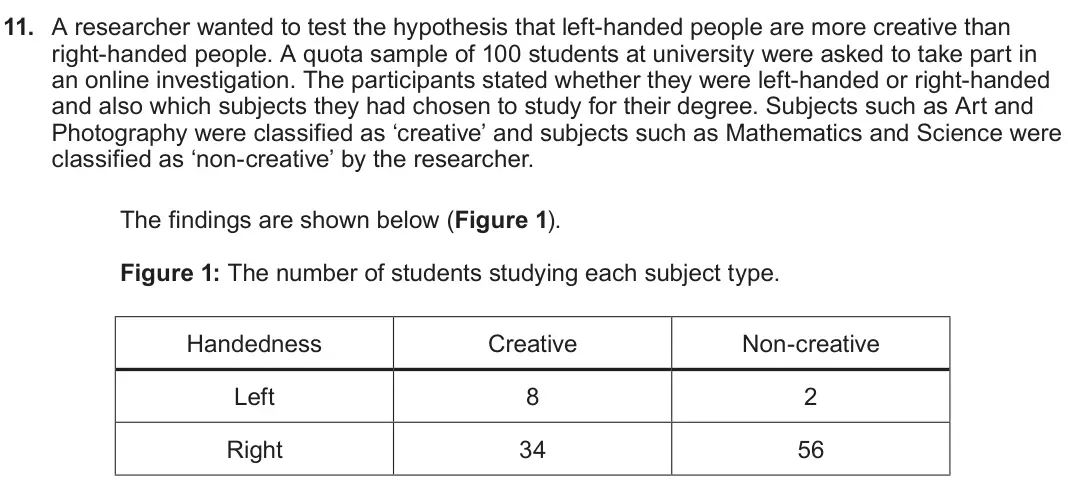
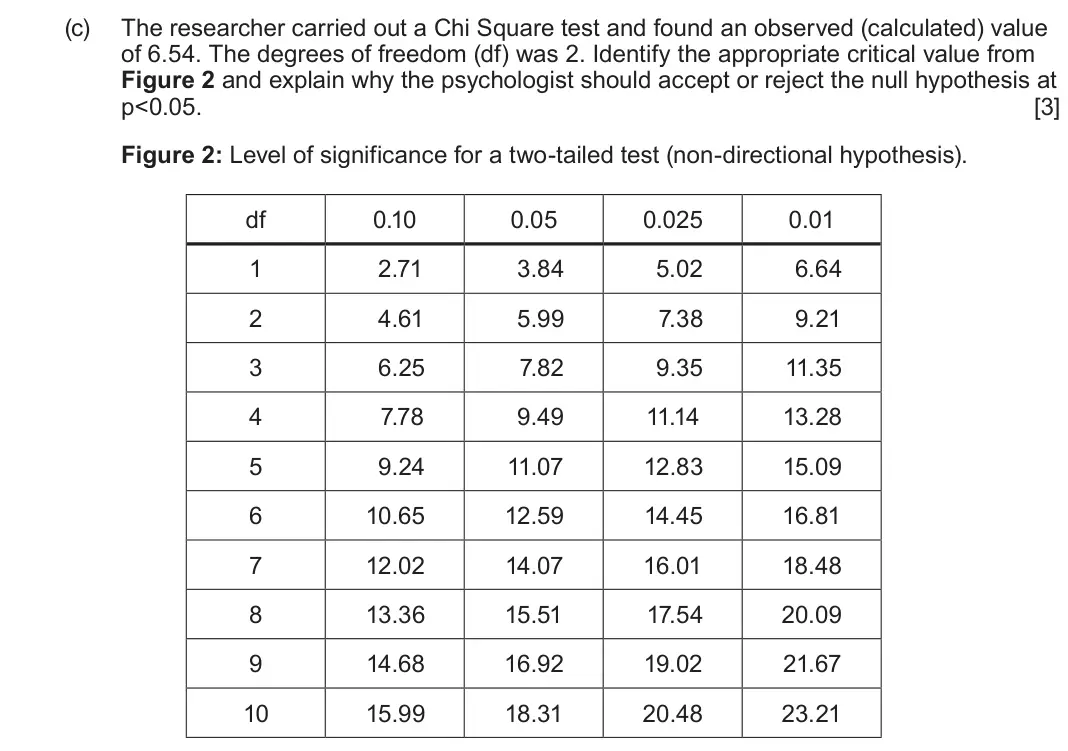
- June 2025, Component 2, Q11(c) (3 marks): (c) The researcher carried out a Chi Square test and found an observed (calculated) value of 6.54. The degrees of freedom (df) was 2. Identify the appropriate c
- June 2024, Component 2, Q8(d) (4 marks): (d) Identify and fully justify the inferential statistic you used to analyse the data in your experiment. [4]
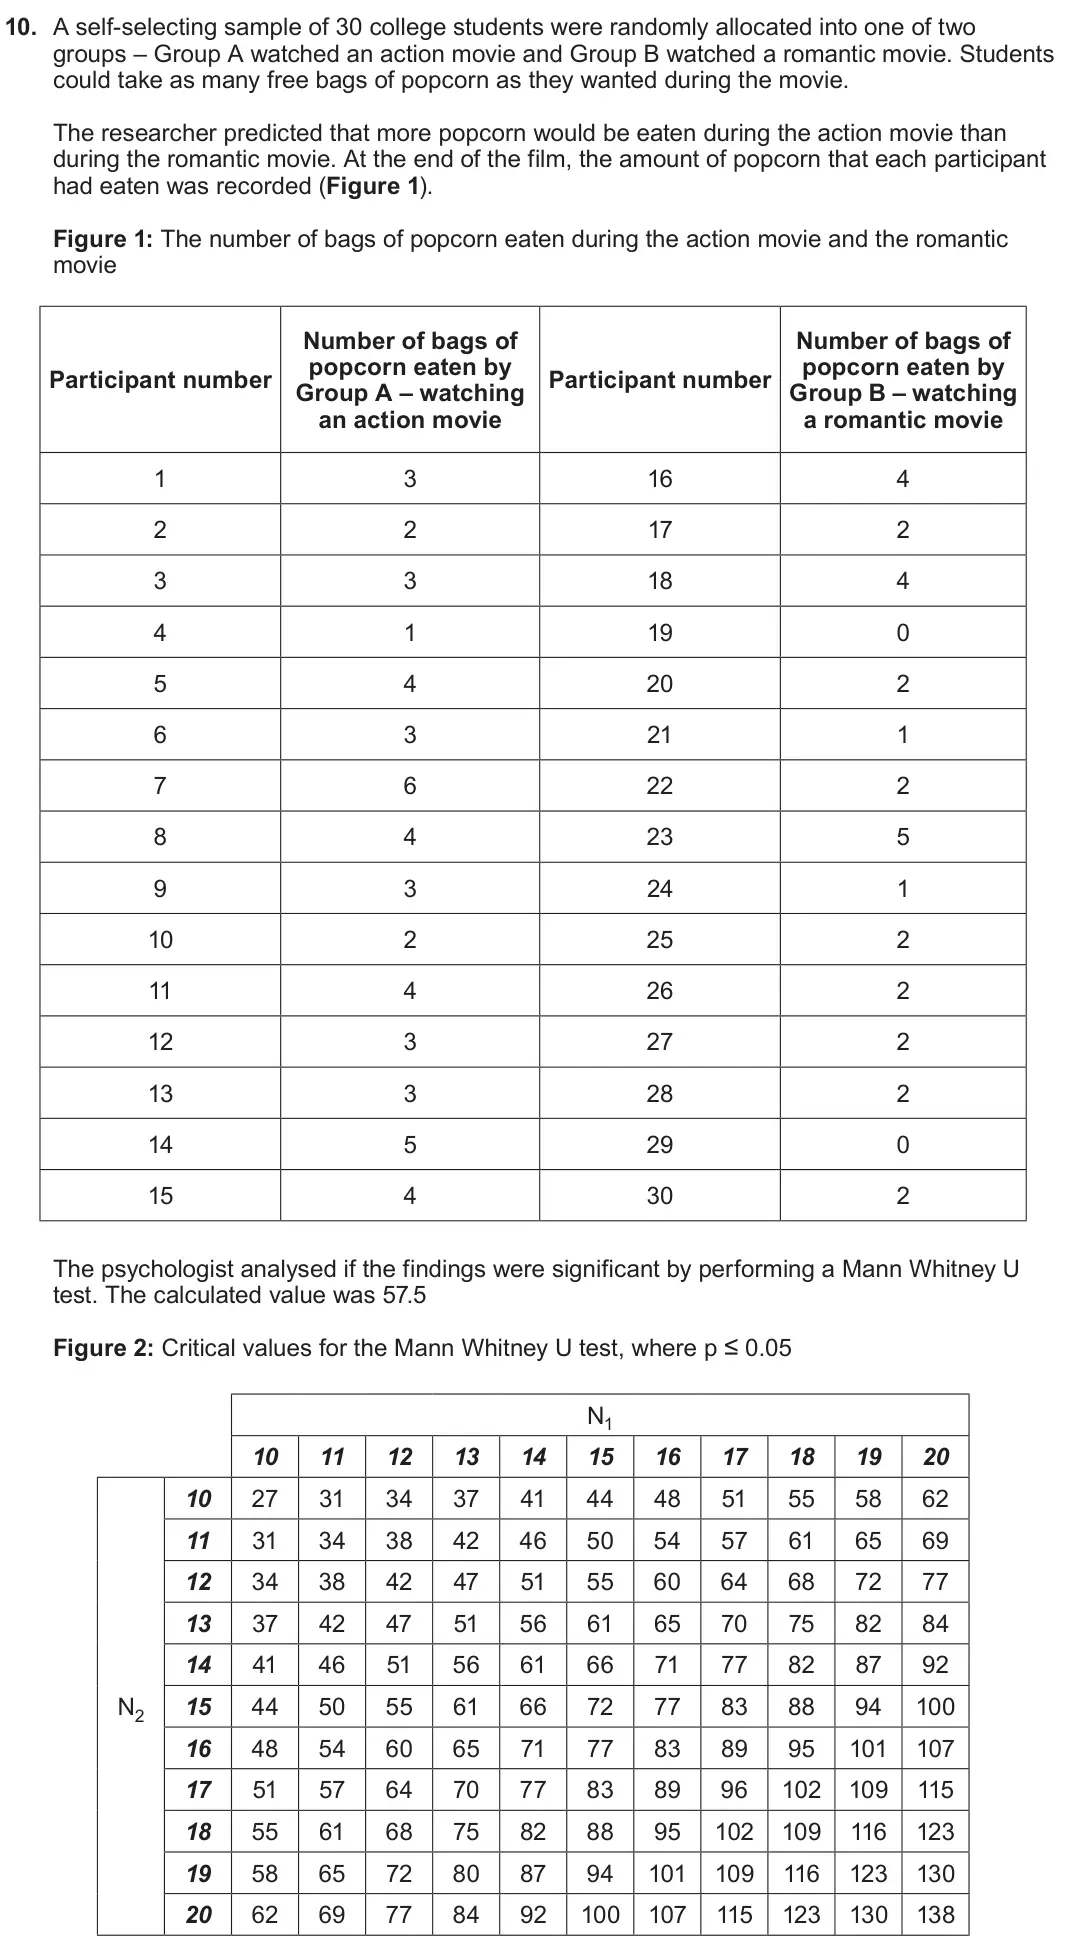
- June 2024, Component 2, Q10(c)(i) (1 mark): (c) (i) Identify the appropriate critical value for this research from Figure 2 above. [1]
- June 2024, Component 2, Q10(c)(ii) (2 marks): (ii) Explain what is meant by ‘p ≤ 0.05’ in this research. [2]
- June 2024, Component 2, Q10(c)(iii) (2 marks): (iii) Explain why the researcher should accept or reject the null hypothesis. [2]
- June 2023, Component 2, Q2(a) (2 marks): 2. (a) Explain what is meant by the term ‘significance level’. [2]
- June 2023, Component 2, Q2(b) (2 marks): (b) Explain what is meant by ‘p≤0.01’. [2]
- June 2023, Component 2, Q2(c) (2 marks): (c) Explain why a psychological researcher might use a p value of p≤0.01 rather than p≤0.05. [2]
- June 2023, Component 2, Q2(d) (1 mark): (d) Explain the difference between the meaning of the symbol ≤ and <. [1]
- June 2023, Component 2, Q10(c) (4 marks): (c) Identify and justify the choice of inferential statistic used to analyse the data in this investigation. [4]
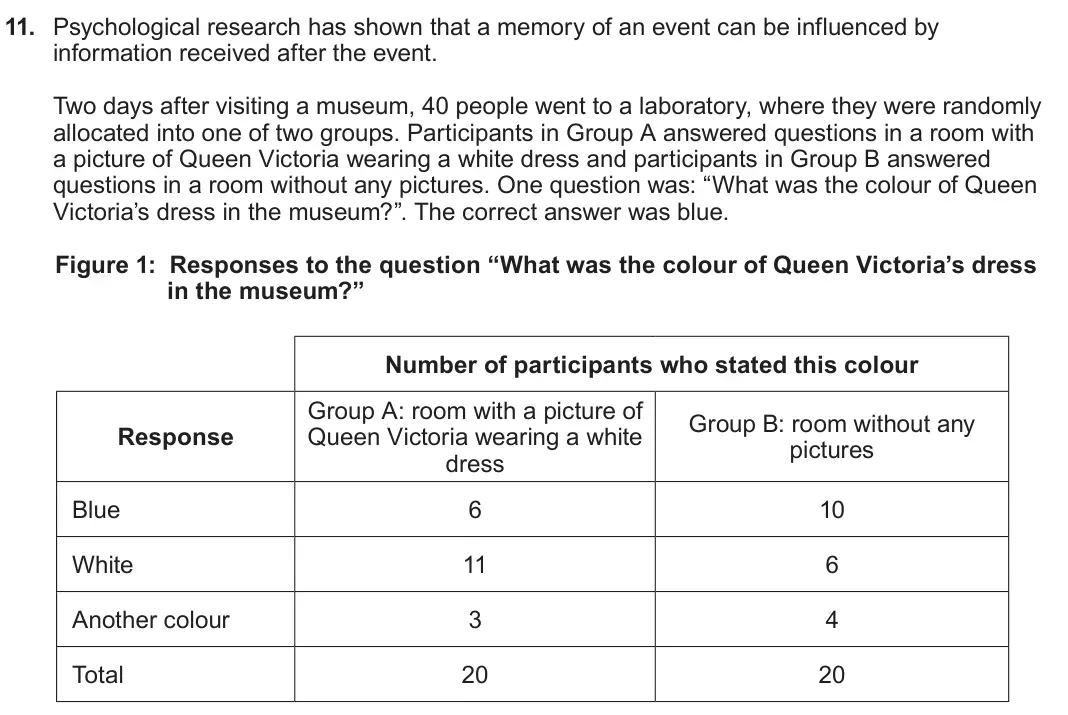
- June 2023, Component 2, Q11(c) (4 marks): (c) A Chi Square test was carried out and the calculated value was 5.78. The degrees of freedom are 2. Using an appropriate critical value from the table below
- June 2022, Component 2, Q7(d) (4 marks): (d) Identify and fully justify the choice of inferential statistical test that you used to analyse the data in your experiment. [4]
- June 2022, Component 2, Q10(c) (4 marks): (c) Apart from using a matched pairs experimental design, explain two reasons why a Wilcoxon matched pairs signed ranks test is appropriate to analyse the data
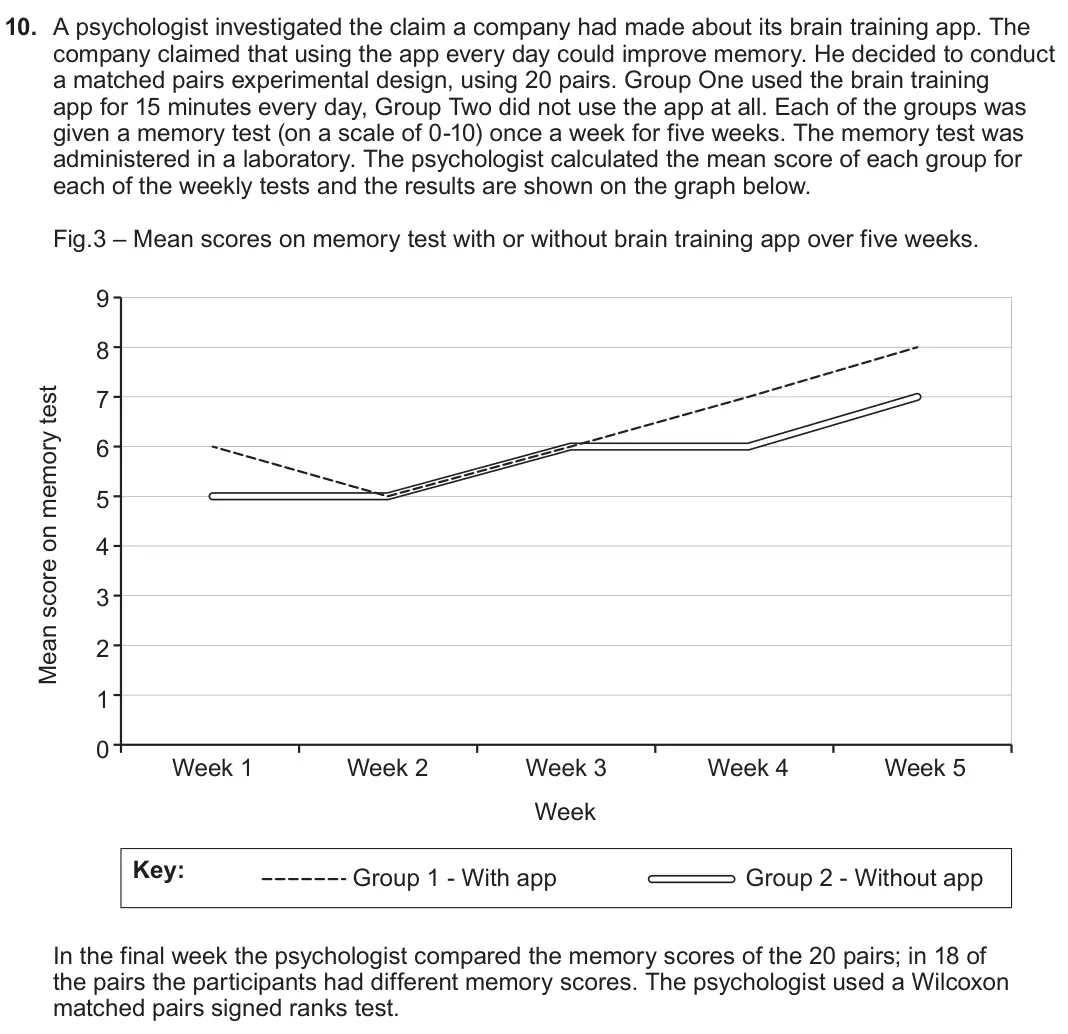
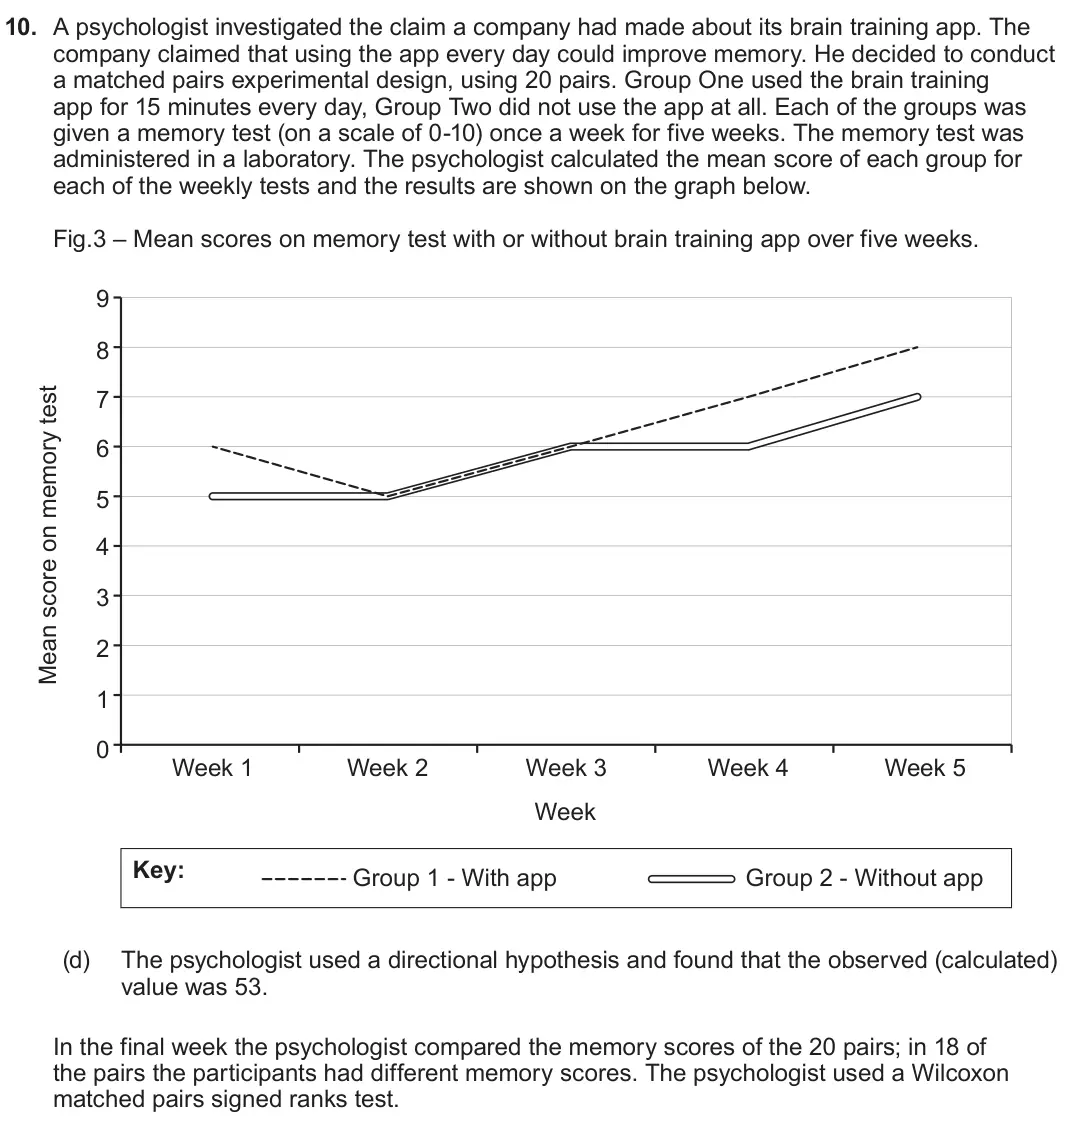
- June 2022, Component 2, Q10(d)(i) (1 mark): (i) Using the critical values table, identify which critical value is appropriate in this research. [1] n 0.01 0.05 18 27 40 19 32 46 20 37 52 21 42 58 22 48 65
- June 2022, Component 2, Q10(d)(ii) (2 marks): (ii) Explain why the psychologist should accept or reject the null hypothesis in this research. [2]
- Autumn 2021, Component 2, Q1(a) (2 marks): 1. (a) Define the term ‘probability value’. [2]
- Autumn 2021, Component 2, Q1(b) (2 marks): (b) Explain why a psychologist would use 0.05 rather than 0.01 as their probability value. [2]
- Autumn 2021, Component 2, Q7(d) (6 marks): (d) Another student carried out correlational research on exercise and wellbeing with five participants. The data collected from these participants is shown in
- Autumn 2021, Component 2, Q8(c)(i) (1 mark): (c) (i) Identify the inferential statistical test that you used when analysing the data collected in your correlational study. [1]
- Autumn 2021, Component 2, Q8(c)(ii) (3 marks): (ii) Fully justify your choice of the inferential statistic identified in 8(c)(i). [3]
- Autumn 2021, Component 2, Q9(e)(i) (1 mark): (i) State whether the sports psychologist should accept or reject the null hypothesis. [1]
- Autumn 2021, Component 2, Q9(e)(ii) (2 marks): (ii) Explain why the sports psychologist should accept or reject the null hypothesis. [2]
- Autumn 2020, Component 2, Q2(i) (1 mark): (i) [1] X
- Autumn 2020, Component 2, Q2(ii) (1 mark): (ii) 1 [1]
- Autumn 2020, Component 2, Q8(d) (4 marks): (d) Identify and fully justify the inferential statistical test that you used when analysing the data collected in your experiment. [1+3]
- Autumn 2020, Component 2, Q10(d) (3 marks): (d) The Occupational Psychologist analysed their data using a Wilcoxon test. Fully justify why this inferential test was appropriate for this research. [3]
- Autumn 2020, Component 2, Q10(e)(i) (1 mark): (i) Identify if the Occupational Psychologist should accept or reject their null hypothesis using the information from the critical value table below: [1] Level
- Autumn 2020, Component 2, Q10(e)(ii) (2 marks): (ii) Justify the answer you gave in (e) (i). [2]
- June 2018, Component 2, Q7(a)(ii) (4 marks): (ii) Identify and fully justify the inferential statistical test that you used when analysing the data collected in your experiment. [4]
- June 2018, Component 2, Q9(c) (4 marks): (c) The psychology teacher analysed her results by using a Chi-Square test. Explain why this test was an appropriate inferential statistical test for this resea
- June 2017, Component 2, Q6(c) (4 marks): (c) Identify and fully justify the inferential statistical test that you used when analysing the data collected in your correlation. [4]
- June 2017, Component 2, Q9(d) (3 marks): (d) The researcher analyses the data using a Sign test. The observed (calculated value) of s was 1. With reference to the table below, explain if the researcher
Questions, mark schemes and examiner’s reports are © WJEC Eduqas, from their published past papers. Plumi isn’t affiliated with any exam board. Want whole papers? Eduqas A-Level Psychology past papers.
The Plumi iPad app also offers exam-style questions with AI feedback on your handwritten working.