 plumi
Descriptive statistics: Eduqas A‑Level Psychology questions
Eduqas A-Level Psychology past-paper questions on Descriptive statistics, 2017–2025, with mark schemes and examiner’s reports where available.
Paper
All papers
Exam
All years
Calculations
Loading the full question list…
Q9(e)
The whole paper ↗Q11(b)
The whole paper ↗Q12(c)(i)
The whole paper ↗Q4(a)
The whole paper ↗Q4(b)
The whole paper ↗Q10(b)(i)
The whole paper ↗Q10(b)(ii)
The whole paper ↗Q11(b)(i)
The whole paper ↗Q11(b)(ii)
The whole paper ↗Q11(b)(iii)
The whole paper ↗Q12(c)(i)
The whole paper ↗Q12(c)(ii)
The whole paper ↗Q4(a)
The whole paper ↗Q4(b)
The whole paper ↗Q9(d)(i)
The whole paper ↗Q9(d)(ii)
The whole paper ↗Q9(a)
The whole paper ↗Q9(b)(ii)
The whole paper ↗Q10(b)
The whole paper ↗




















All 31 questions on Descriptive statistics, as a list
- June 2025, Component 2, Q5 (2 marks): 5. Explain how you would calculate the mean value of a set of data. [2]
- June 2025, Component 2, Q9(e) (3 marks): (e) Identify and justify the descriptive statistic you used to describe the data in your quasi-experiment. [1 + 2]
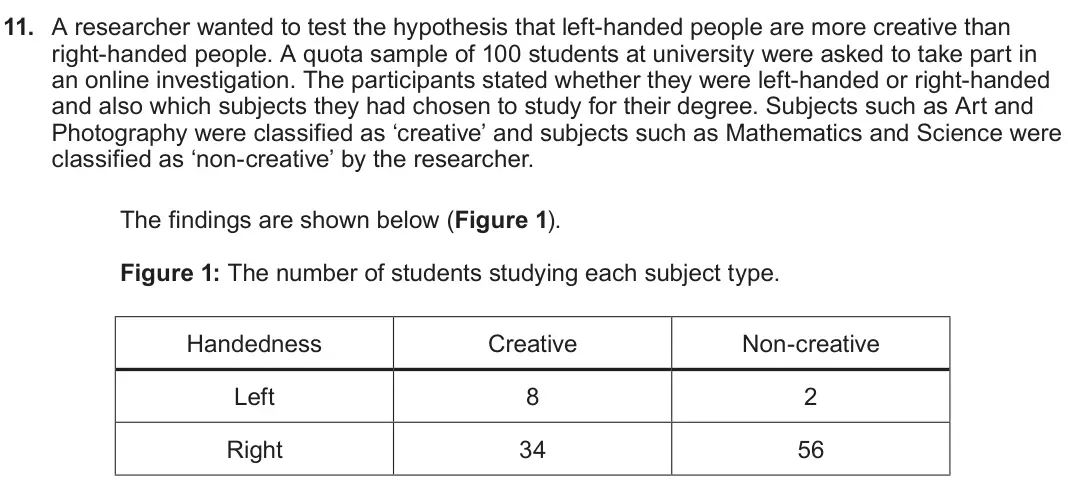
- June 2025, Component 2, Q11(b) (3 marks): (b) Identify an appropriate measure of central tendency for this data and explain why this measure is suitable for the data in Figure 1. [3]
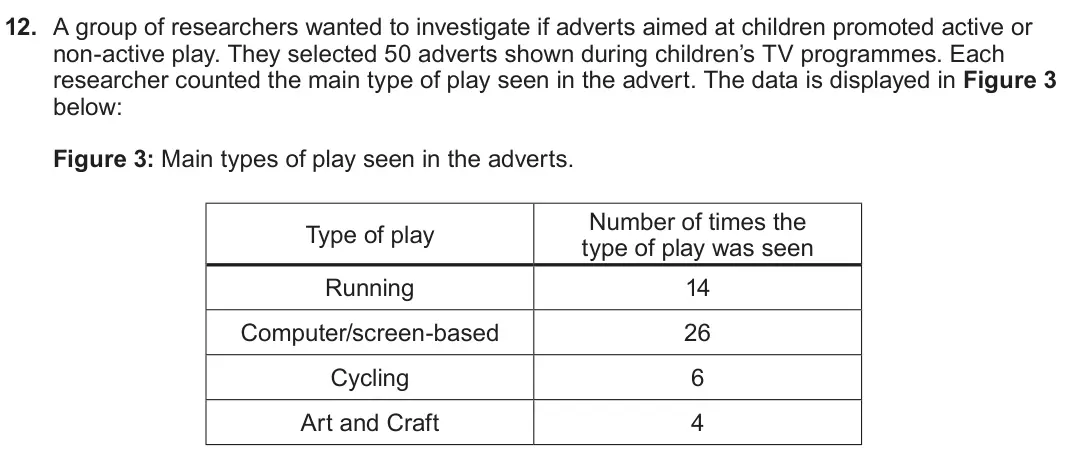
- June 2025, Component 2, Q12(c)(i) (2 marks): (c) (i) Calculate the percentage of adverts that contained computer/screen-based activity. Show your workings. [2]
- June 2024, Component 2, Q4(a) (2 marks): 4. (a) Explain why a psychological researcher might use standard deviation for measuring dispersion in a set of data. [2]
- June 2024, Component 2, Q4(b) (2 marks): (b) Explain why a psychological researcher might use range for measuring dispersion in a set of data. [2]
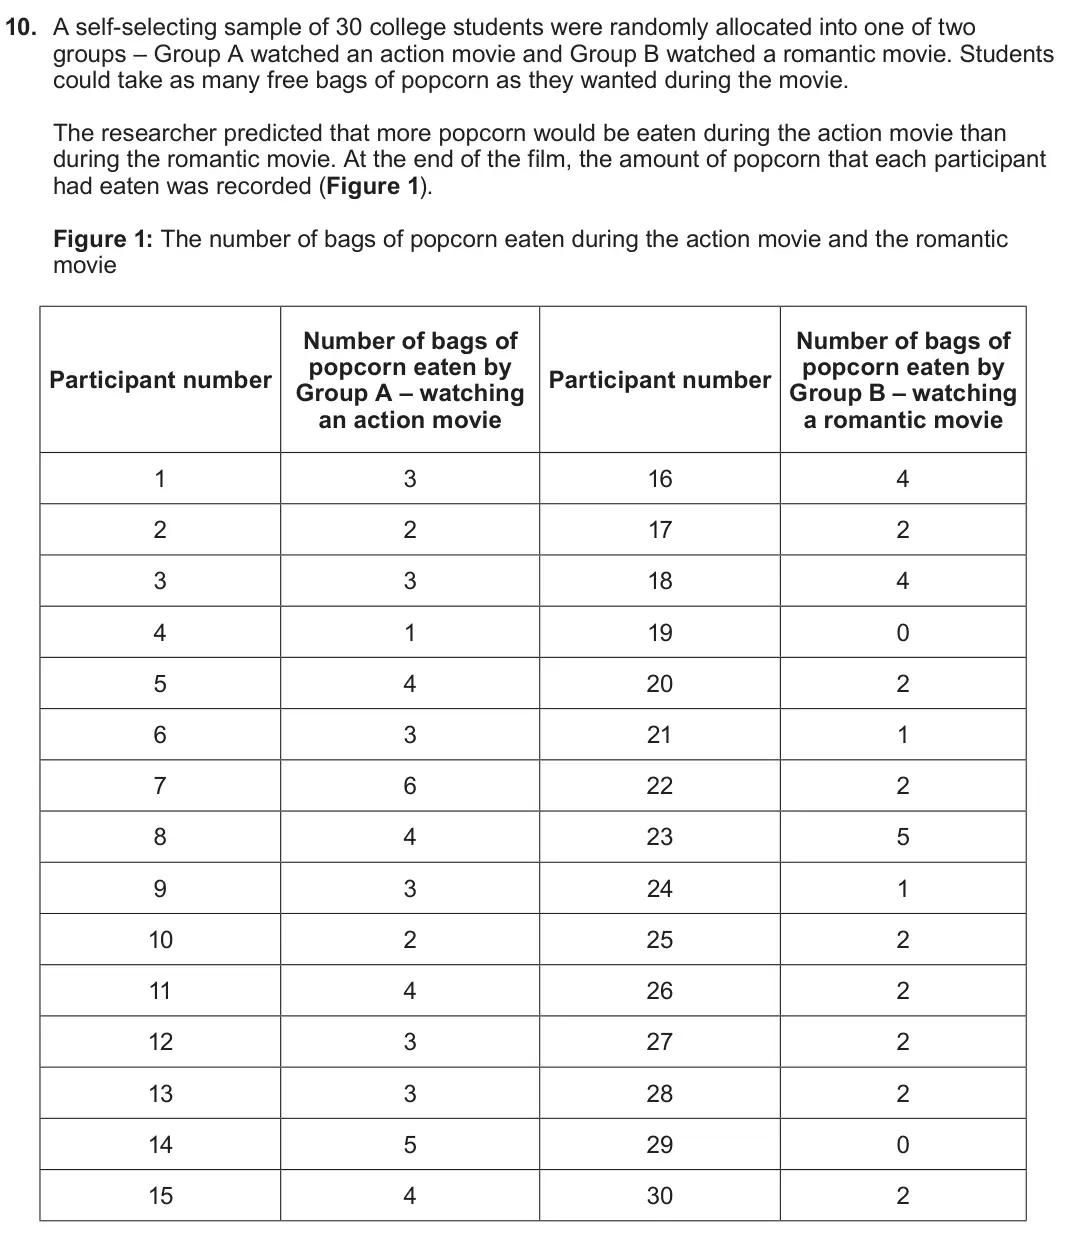
- June 2024, Component 2, Q10(b)(i) (3 marks): (b) (i) Suggest an appropriate measure of central tendency to describe the number of bags of popcorn eaten and fully justify why this is appropriate in this res
- June 2024, Component 2, Q10(b)(ii) (2 marks): (ii) Calculate the measure of central tendency identified in 10(b)(i) for Group A. Show your workings. [2]
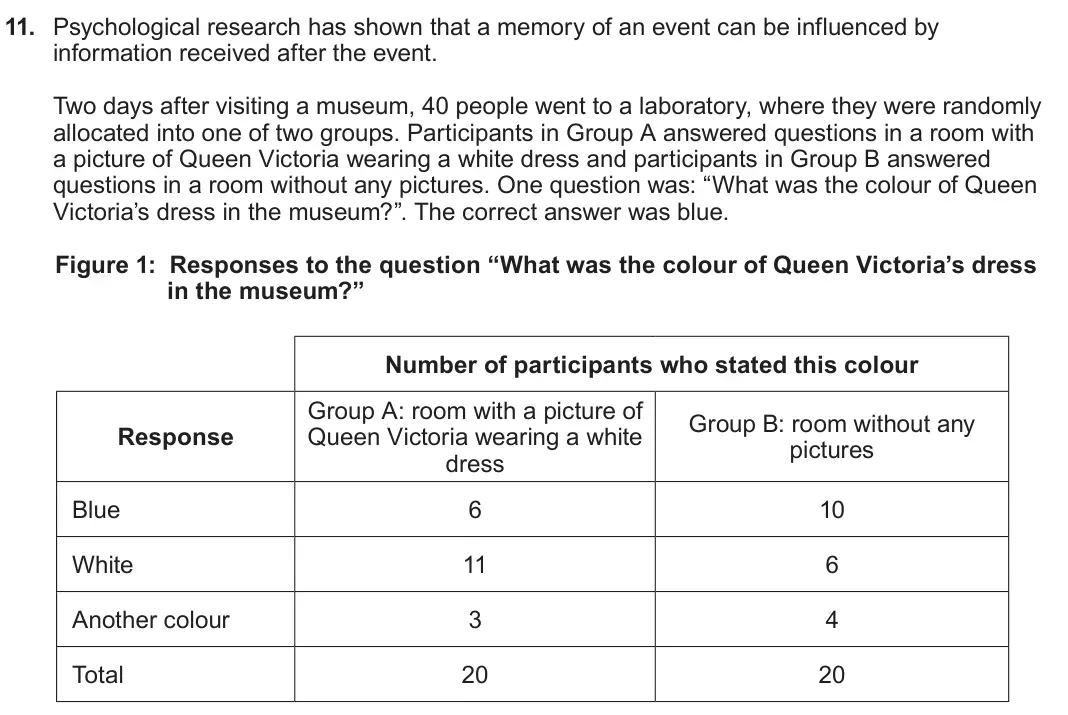
- June 2023, Component 2, Q11(b)(i) (1 mark): (b) (i) Identify which measure of central tendency would be appropriate to describe this data (as displayed in Figure 1). [1]
- June 2023, Component 2, Q11(b)(ii) (2 marks): (ii) Explain why this is the most appropriate measure of central tendency for this data. [2]
- June 2023, Component 2, Q11(b)(iii) (2 marks): (iii) Analyse the data in Group B using the measure of central tendency identified in (b)(i). [2]
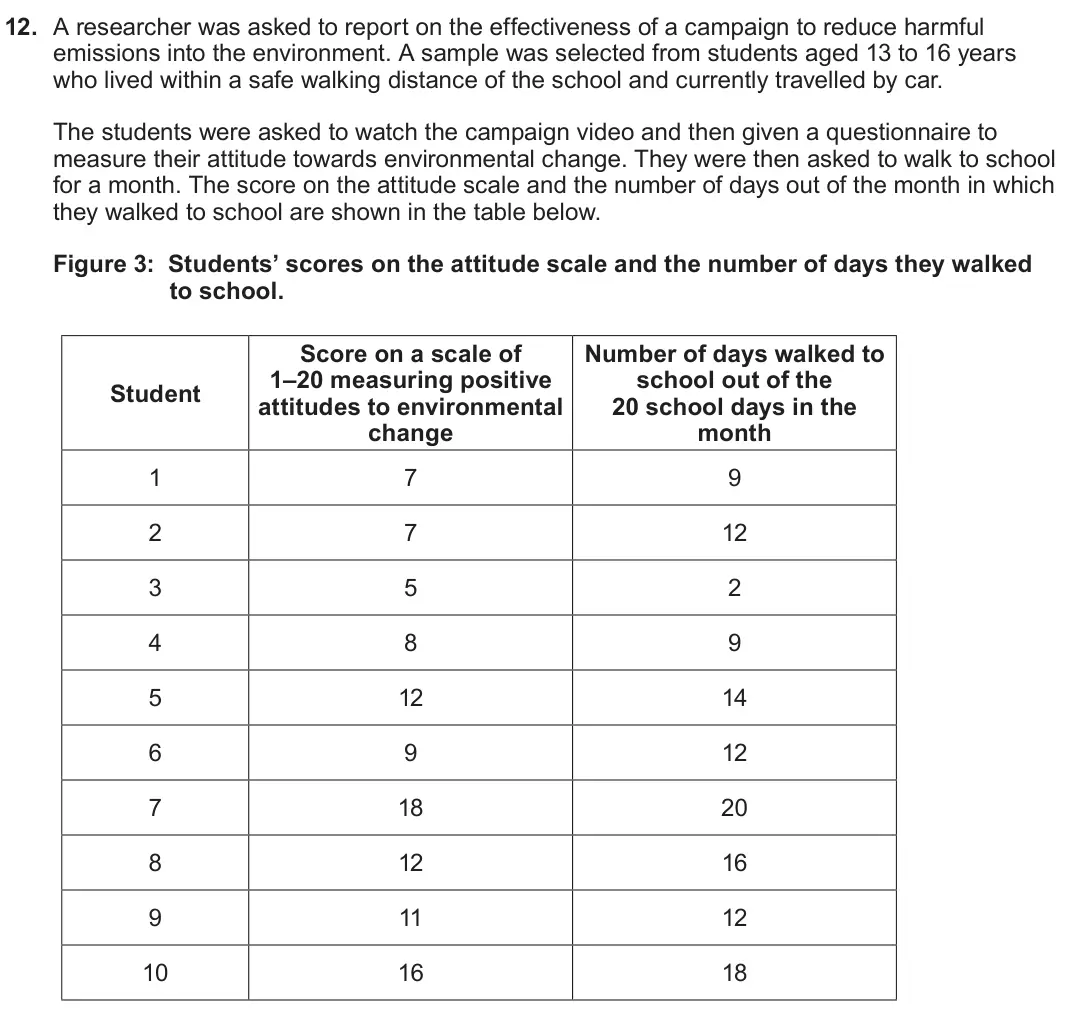
- June 2023, Component 2, Q12(c)(i) (1 mark): (c) (i) Identify one appropriate measure of dispersion for the data ‘number of days walked to school’ in this research. [1]
- June 2023, Component 2, Q12(c)(ii) (2 marks): (ii) Justify why the measure of dispersion identified in (c) (i) is appropriate for ‘number of days walked to school’. [2]
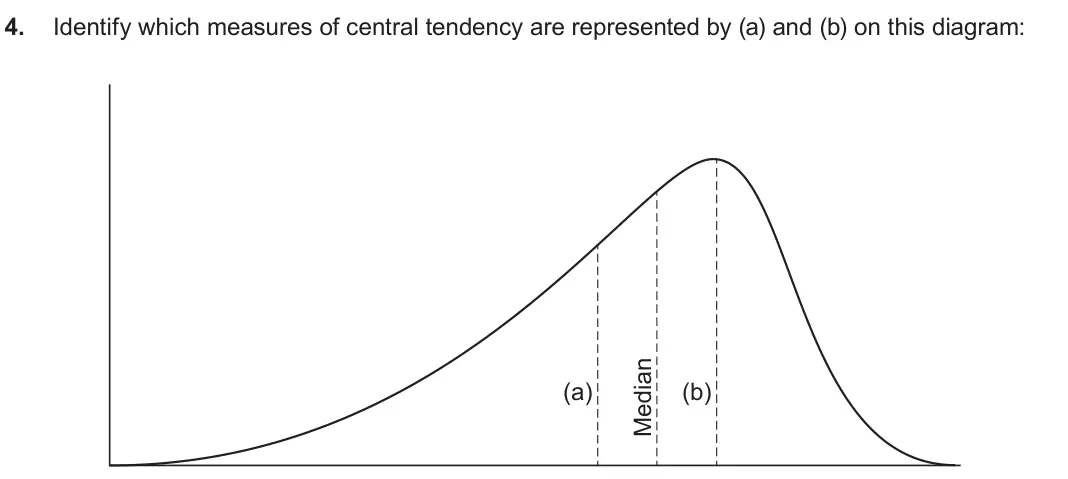
- June 2022, Component 2, Q4(a) (1 mark): (a) [1]
- June 2022, Component 2, Q4(b) (1 mark): (b) [1]
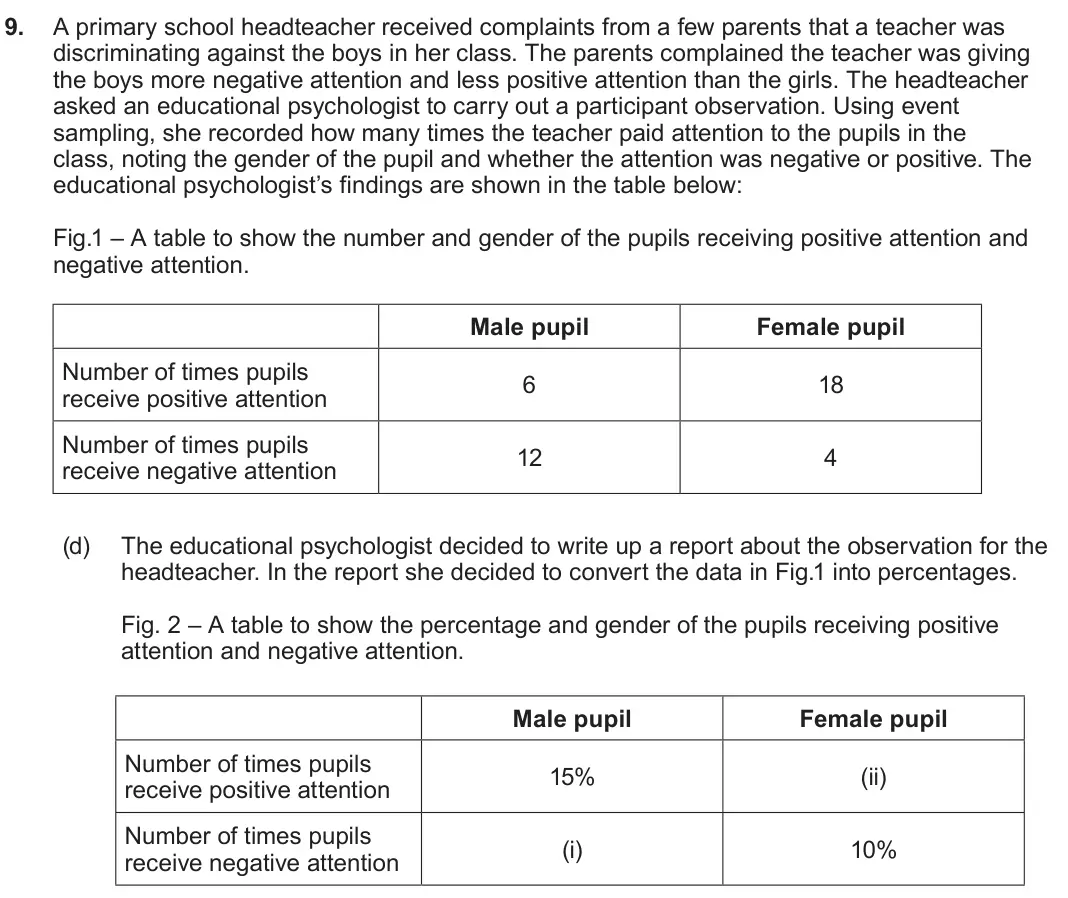
- June 2022, Component 2, Q9(d)(i) (2 marks): (i) Showing your workings, calculate the percentage for the number of times negative attention was received by a male pupil. [2]
- June 2022, Component 2, Q9(d)(ii) (2 marks): (ii) Showing your workings, calculate the percentage for the number of times positive attention was received by a female pupil. [2]
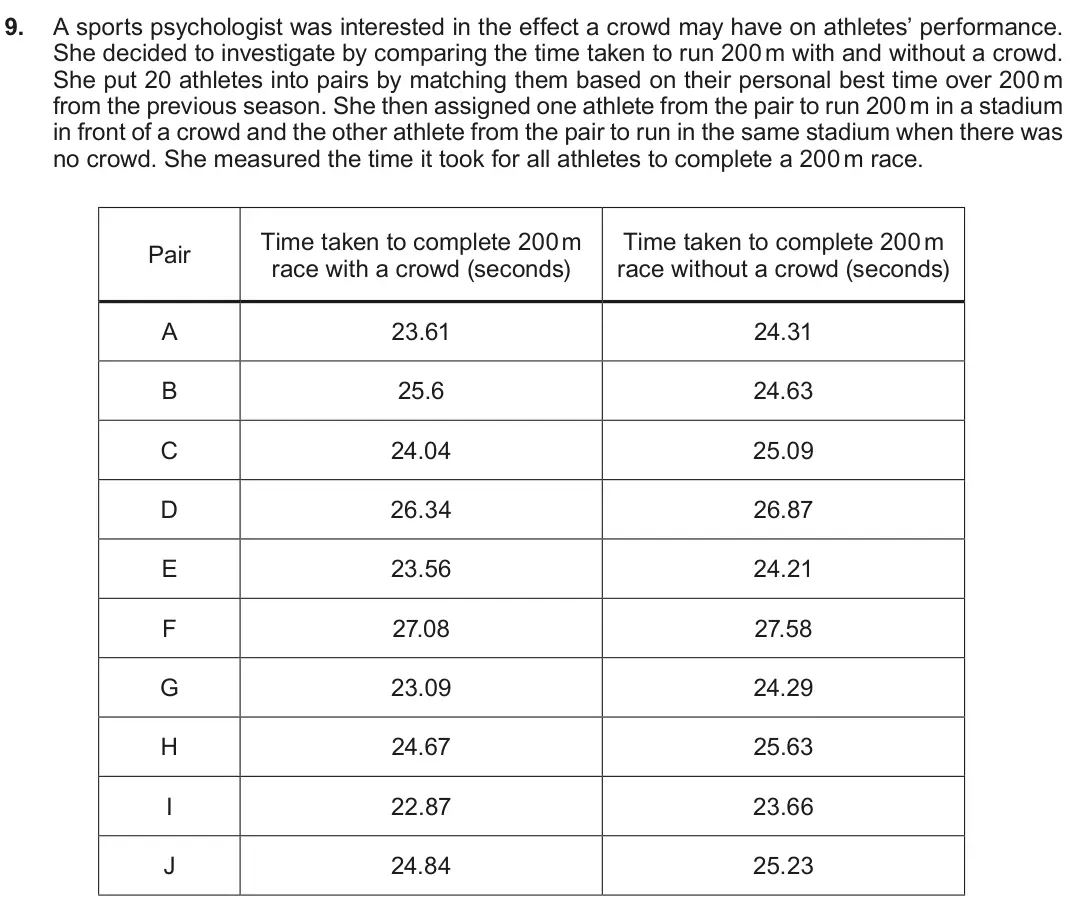
- Autumn 2021, Component 2, Q9(a) (2 marks): (a) The sports psychologist found that the mean time taken to complete the 200 m race with a crowd was 24.57 seconds. Showing your workings, calculate the mean
- Autumn 2020, Component 2, Q9(b)(ii) (3 marks): (ii) Identify and explain the choice of descriptive statistics that you used to describe the data collected from your content analysis. [1+2]
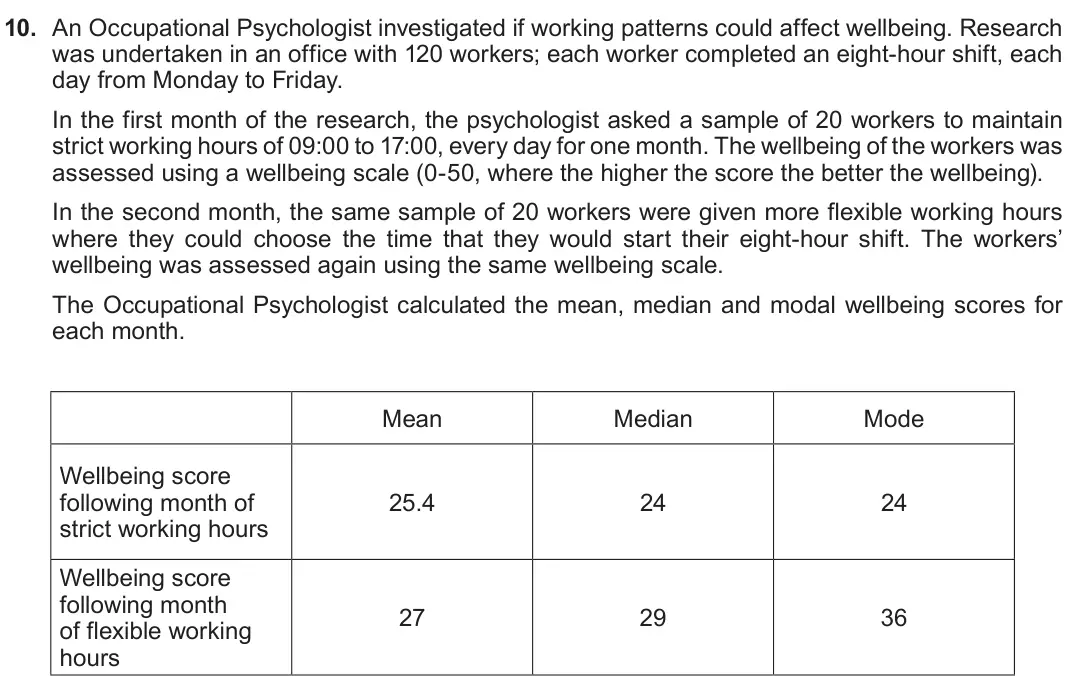
- Autumn 2020, Component 2, Q10(b) (2 marks): (b) State one conclusion that can be drawn from the median scores in this research. [2]
- June 2019, Component 2, Q1 (3 marks): 1. Identify the measures of central tendency from the calculations presented below. [1+1+1] (i) 3, 3, 3, 4, 5, 6, 7, 7, 9, 10. 5 + 6 = 11 11 = 5.5 2 (ii) 3 + 3
- June 2019, Component 2, Q3(a) (6 marks): 3. (a) Explain the steps you would follow to calculate a standard deviation. [6] ∑ (x − x)2 n −1
- June 2019, Component 2, Q3(b) (4 marks): (b) Explain one strength and one weakness of using standard deviations in psychology. [2+2]
- June 2019, Component 2, Q8(b) (6 marks): (b) Explain how you chose to display and analyse the data from your research. You should include your justification for choosing the graphical representations a
- June 2019, Component 2, Q9(f)(i) (2 marks): (f) (i) Draw one conclusion from the range scores in this research. [2]
- June 2019, Component 2, Q9(f)(ii) (2 marks): (ii) Explain one weakness of using the range scores in this research. [2]
- June 2018, Component 2, Q10(c)(i) (2 marks): (c) (i) Showing your calculations, calculate the mean anxiety ratings of the 12 participants after the First Class flight. [2]
- June 2018, Component 2, Q10(c)(ii) (4 marks): (ii) Give one advantage and one disadvantage of using the mean as a measure of central tendency in this research. [2+2]
- June 2017, Component 2, Q3 (2 marks): 3. Explain how you would calculate the median value in a set of data. [2]
- June 2017, Component 2, Q8(d) (1 mark): (d) The total of the loneliness ratings given by the ten pensioners was 45. State the mean of the loneliness ratings. [1]
- June 2017, Component 2, Q8(e) (2 marks): (e) Explain why the mode might be an appropriate measure of central tendency for describing these loneliness ratings. [2]
Questions, mark schemes and examiner’s reports are © WJEC Eduqas, from their published past papers. Plumi isn’t affiliated with any exam board. Want whole papers? Eduqas A-Level Psychology past papers.
The Plumi iPad app also offers exam-style questions with AI feedback on your handwritten working.