Skip to content
Android waitlistTry on iPad
Get started

Graphical representation: Eduqas A‑Level Psychology questions

Eduqas A-Level Psychology past-paper questions on Graphical representation, 2017–2025, with mark schemes and examiner’s reports where available.

Paper
All papers
Exam
All years
Calculations

Loading the full question list…

522 questions

  1. Q10(c)(i)

    June 2025 · Component 2

    The whole paper ↗

    1
    Setup for original question 10(c)(i)

    Loading the question setup…

    Original question 10(c)(i): (c) (i) Identify an appropriate graphical representation which could be drawn from the data you collected in your correlational study. [1]

    Loading the question…

  2. Q12(c)(ii)

    June 2025 · Component 2

    The whole paper ↗
    2
    Setup for original question 12(c)(ii)

    Loading the question setup…

    Original question 12(c)(ii): (ii) Identify the type of graphical representation used in Figure 4 below and then complete the labels of the three blank segments on Figure 4. [4] Figure 4: Gr

    Loading the question…

  3. Q12(c)(iii)

    June 2025 · Component 2

    The whole paper ↗
    3
    Setup for original question 12(c)(iii)

    Loading the question setup…

    Original question 12(c)(iii): (iii) Apart from the type of graphical representation used in Figure 4, identify an alternative appropriate graphical representation that could be used to displ

    Loading the question…

  4. Q2(a)

    June 2024 · Component 2

    The whole paper ↗
    4
    Original question 2(a): 2. (a) Identify the type of skewed distribution in this diagram. [1]

    Loading the question…

  5. Q2(b)

    June 2024 · Component 2

    The whole paper ↗

    5
    Original question 2(b): (b) Identify the type of skewed distribution in this diagram. [1]

    Loading the question…

  6. Q10(a)

    June 2024 · Component 2

    The whole paper ↗

    6
    Setup for original question 10(a)

    Loading the question setup…

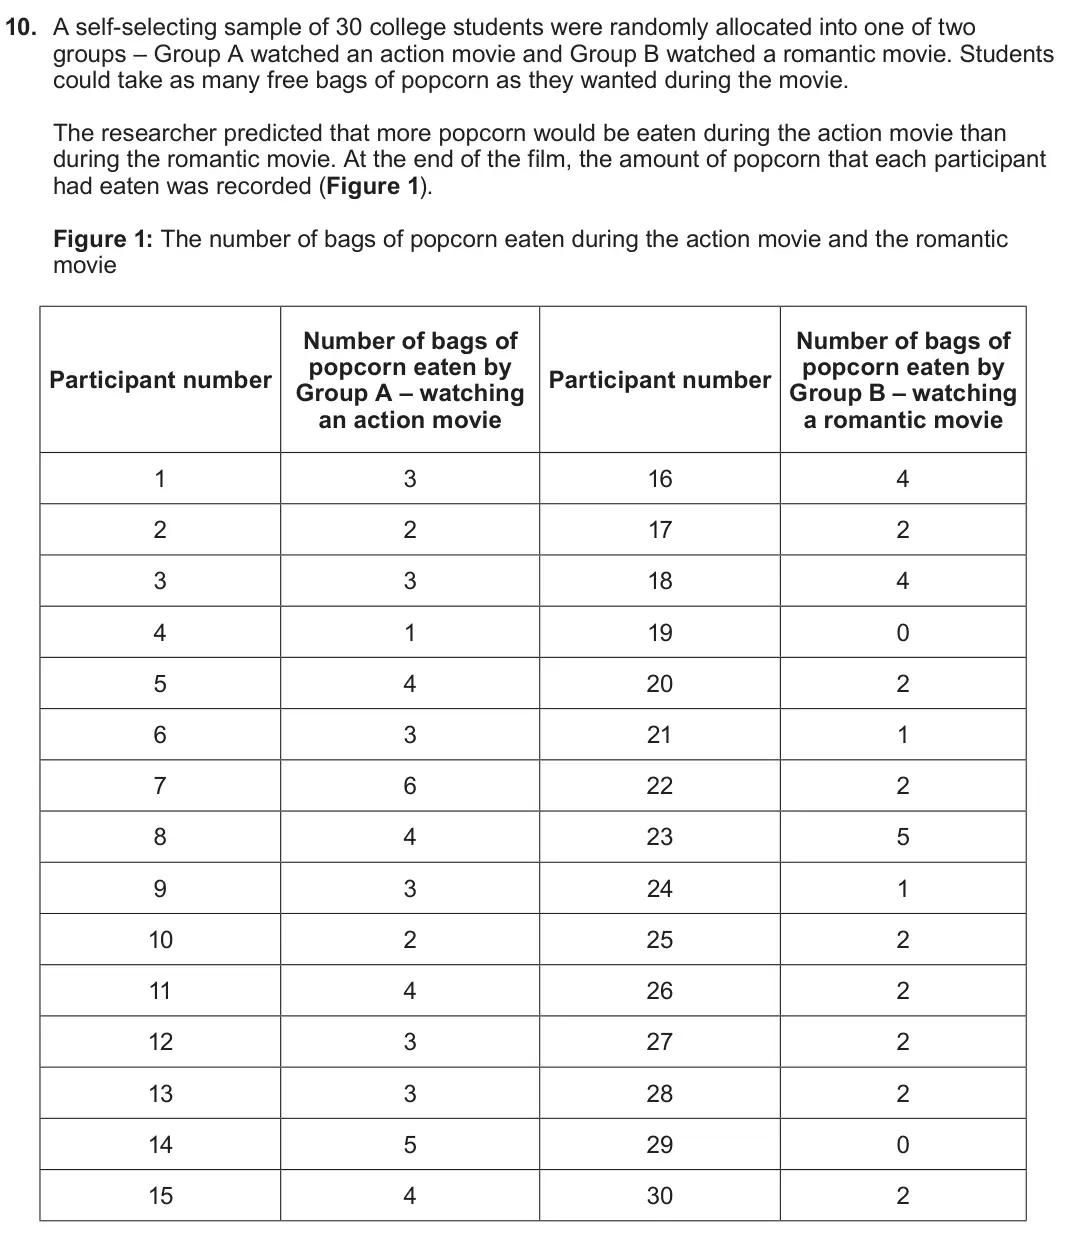
    Original question 10(a): (a) Using an appropriate graphical representation, display the data from Figure 1. [4]

    Loading the question…

  7. Q11(a)

    June 2023 · Component 2

    The whole paper ↗
    7
    Setup for original question 11(a)

    Loading the question setup…

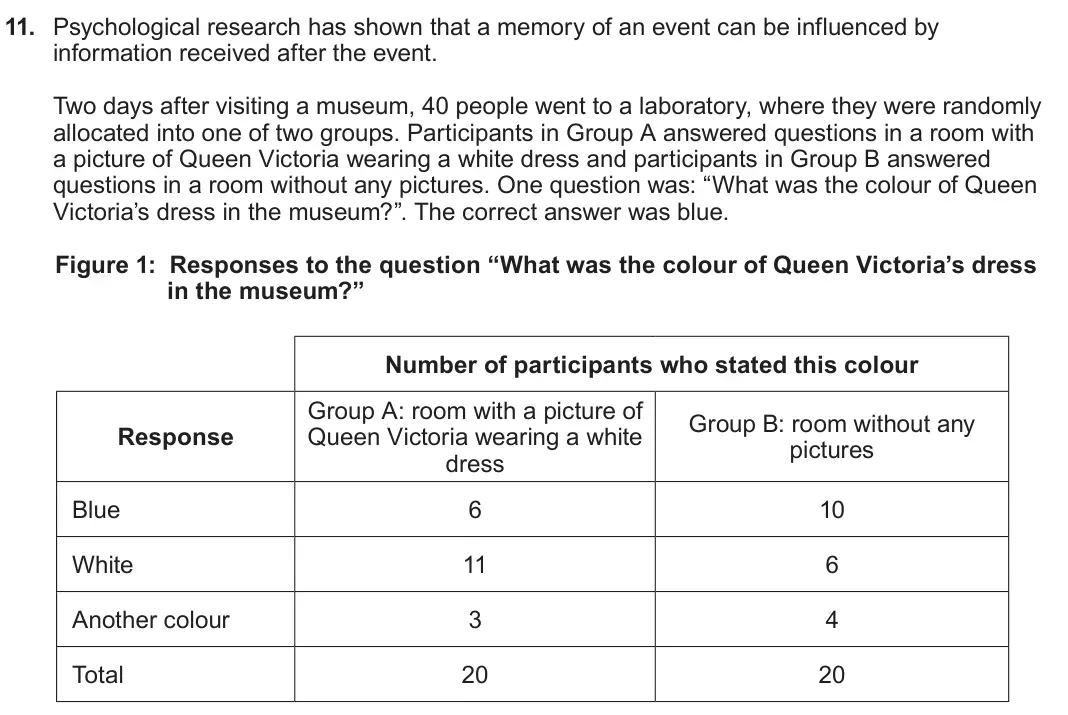
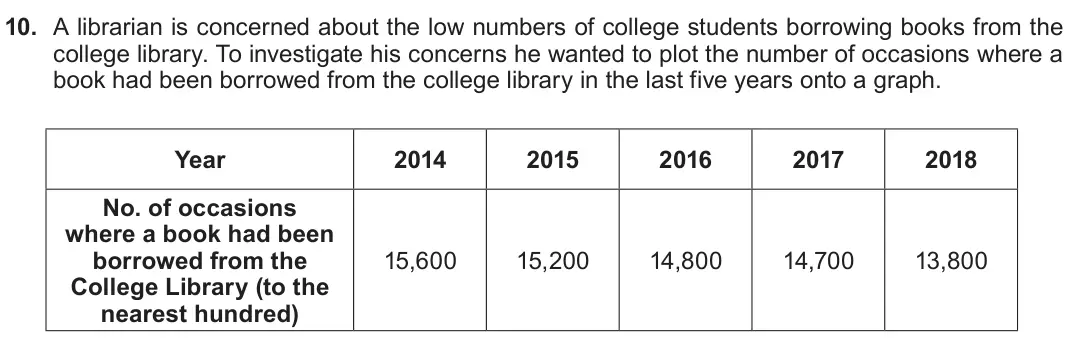
    Original question 11(a): (a) State one appropriate conclusion that can be drawn from the findings in this research (displayed in Figure 1). [2]

    Loading the question…

  8. Q12(a)(i)

    June 2023 · Component 2

    The whole paper ↗
    8
    Setup for original question 12(a)(i)

    Loading the question setup…

    Original question 12(a)(i): (a) (i) Identify one appropriate graphical representation that could be used to display the data in this research. [1]

    Loading the question…

  9. Q12(a)(ii)

    June 2023 · Component 2

    The whole paper ↗
    9
    Setup for original question 12(a)(ii)

    Loading the question setup…

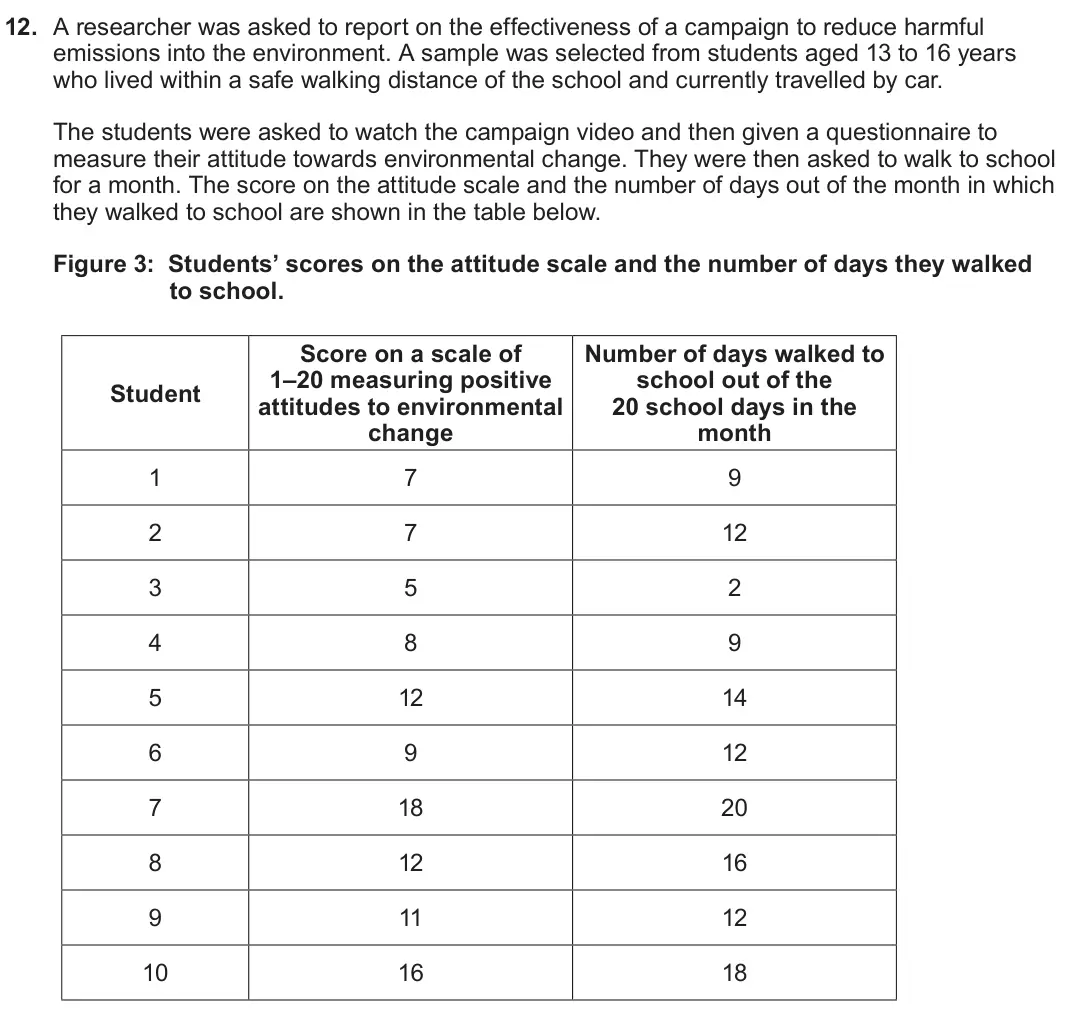
    Original question 12(a)(ii): (ii) Using the graphical representation that you identified in (a)(i), display the data in this research. [4]

    Loading the question…

  10. Q10(a)(i)

    June 2022 · Component 2

    The whole paper ↗

    10
    Setup for original question 10(a)(i)

    Loading the question setup…

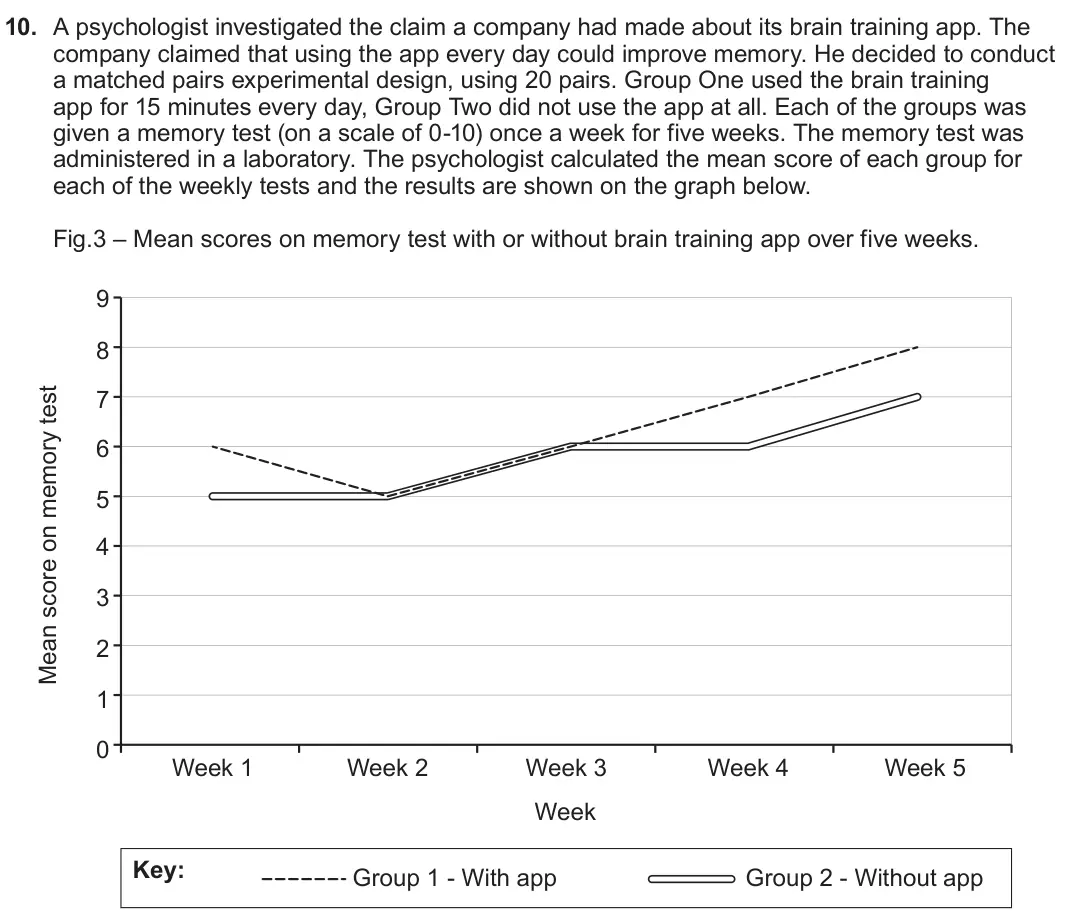
    Original question 10(a)(i): (a) (i) Identify the graphical representation used by the psychologist in Fig.3. [1]

    Loading the question…

  11. Q10(a)(ii)

    June 2022 · Component 2

    The whole paper ↗
    11
    Setup for original question 10(a)(ii)

    Loading the question setup…

    Original question 10(a)(ii): (ii) Explain why the graphical representation used by the psychologist in Fig.3 is appropriate in this research. [2]

    Loading the question…

  12. Q10(a)(iii)

    June 2022 · Component 2

    The whole paper ↗
    12
    Setup for original question 10(a)(iii)

    Loading the question setup…

    Original question 10(a)(iii): (iii) What conclusion can be drawn from the information in Fig.3? [2]

    Loading the question…

  13. Q10(c)(i)

    Autumn 2021 · Component 2

    The whole paper ↗
    13
    Setup for original question 10(c)(i)

    Loading the question setup…

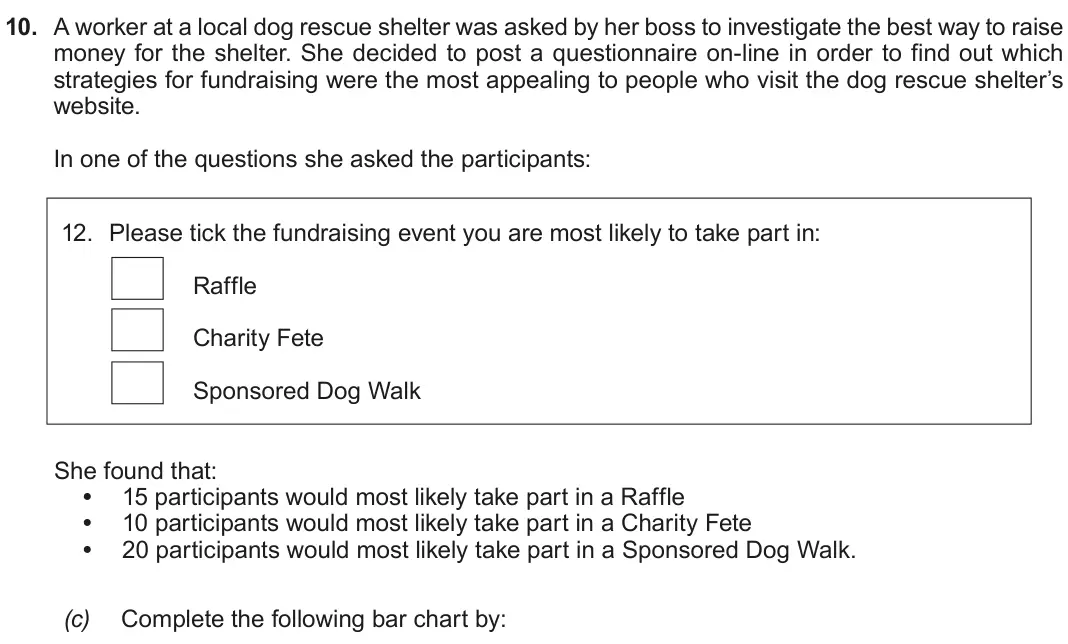
    Original question 10(c)(i): (i) Accurately plotting the data. [1]

    Loading the question…

  14. Q10(c)(ii)

    Autumn 2021 · Component 2

    The whole paper ↗
    14
    Setup for original question 10(c)(ii)

    Loading the question setup…

    Original question 10(c)(ii): (ii) Labelling both of the axes. [1] 25 0 Raffle Charity Fete Sponsored Dog Walk

    Loading the question…

  15. Q9(b)(i)

    Autumn 2020 · Component 2

    The whole paper ↗
    15
    Setup for original question 9(b)(i)

    Loading the question setup…

    Original question 9(b)(i): (b) (i) Identify and explain the choice of graphical representation that you used to display the data collected from your content analysis. [1+2]

    Loading the question…

  16. Q11(b)

    Autumn 2020 · Component 2

    The whole paper ↗
    16
    Setup for original question 11(b)

    Loading the question setup…

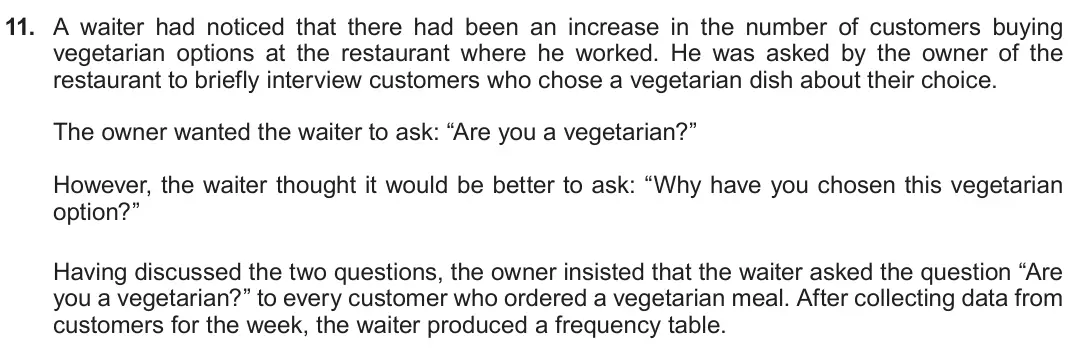
    Original question 11(b): (b) Using the information from the frequency table, construct a bar chart to represent the data. [4] Yes 56 No 9

    Loading the question…

  17. Q8(b)

    June 2019 · Component 2

    The whole paper ↗
    17
    Setup for original question 8(b)

    Loading the question setup…

    Original question 8(b): (b) Explain how you chose to display and analyse the data from your research. You should include your justification for choosing the graphical representations a

    Loading the question…

  18. Q10(a)(i)

    June 2019 · Component 2

    The whole paper ↗
    18
    Setup for original question 10(a)(i)

    Loading the question setup…

    Original question 10(a)(i): (a) (i) Identify one appropriate graphical representation that could be used to display the data in this research. [1]

    Loading the question…

  19. Q10(a)(ii)

    June 2019 · Component 2

    The whole paper ↗
    19
    Setup for original question 10(a)(ii)

    Loading the question setup…

    Original question 10(a)(ii): (ii) Using the graphical representation that you identified in (a) (i) display the data in this research. [4]

    Loading the question…

  20. Q3(a)

    June 2018 · Component 2

    The whole paper ↗
    20
    Setup for original question 3(a)

    Loading the question setup…

    Original question 3(a): (a) Normal distribution [1]

    Loading the question…

All 22 questions on Graphical representation, as a list
  1. June 2025, Component 2, Q10(c)(i) (1 mark): (c) (i) Identify an appropriate graphical representation which could be drawn from the data you collected in your correlational study. [1]
  2. June 2025, Component 2, Q12(c)(ii) (4 marks): (ii) Identify the type of graphical representation used in Figure 4 below and then complete the labels of the three blank segments on Figure 4. [4] Figure 4: Gr
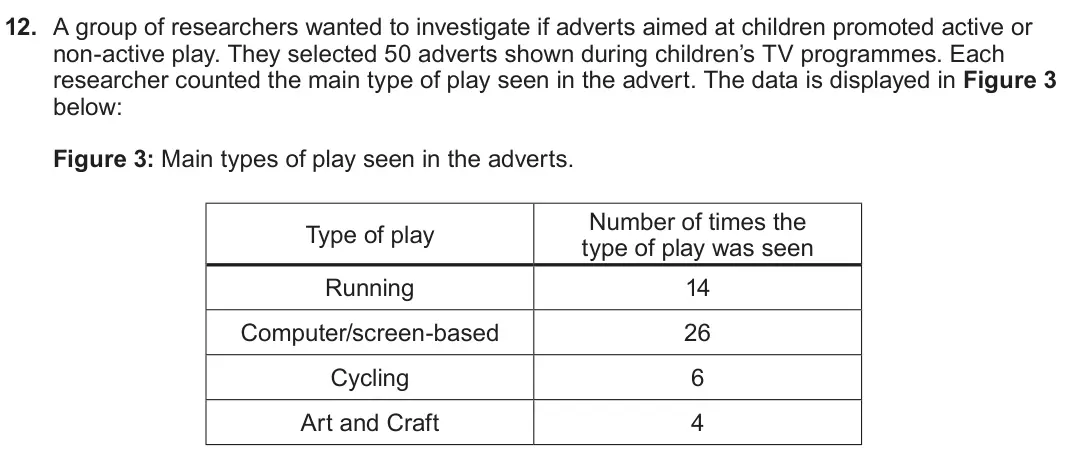
  3. June 2025, Component 2, Q12(c)(iii) (1 mark): (iii) Apart from the type of graphical representation used in Figure 4, identify an alternative appropriate graphical representation that could be used to displ
  4. June 2024, Component 2, Q2(a) (1 mark): 2. (a) Identify the type of skewed distribution in this diagram. [1]
  5. June 2024, Component 2, Q2(b) (1 mark): (b) Identify the type of skewed distribution in this diagram. [1]
  6. June 2024, Component 2, Q10(a) (4 marks): (a) Using an appropriate graphical representation, display the data from Figure 1. [4]
  7. June 2023, Component 2, Q11(a) (2 marks): (a) State one appropriate conclusion that can be drawn from the findings in this research (displayed in Figure 1). [2]
  8. June 2023, Component 2, Q12(a)(i) (1 mark): (a) (i) Identify one appropriate graphical representation that could be used to display the data in this research. [1]
  9. June 2023, Component 2, Q12(a)(ii) (4 marks): (ii) Using the graphical representation that you identified in (a)(i), display the data in this research. [4]
  10. June 2022, Component 2, Q10(a)(i) (1 mark): (a) (i) Identify the graphical representation used by the psychologist in Fig.3. [1]
  11. June 2022, Component 2, Q10(a)(ii) (2 marks): (ii) Explain why the graphical representation used by the psychologist in Fig.3 is appropriate in this research. [2]
  12. June 2022, Component 2, Q10(a)(iii) (2 marks): (iii) What conclusion can be drawn from the information in Fig.3? [2]
  13. Autumn 2021, Component 2, Q10(c)(i) (1 mark): (i) Accurately plotting the data. [1]
  14. Autumn 2021, Component 2, Q10(c)(ii) (1 mark): (ii) Labelling both of the axes. [1] 25 0 Raffle Charity Fete Sponsored Dog Walk
  15. Autumn 2020, Component 2, Q9(b)(i) (3 marks): (b) (i) Identify and explain the choice of graphical representation that you used to display the data collected from your content analysis. [1+2]
  16. Autumn 2020, Component 2, Q11(b) (4 marks): (b) Using the information from the frequency table, construct a bar chart to represent the data. [4] Yes 56 No 9
  17. June 2019, Component 2, Q8(b) (6 marks): (b) Explain how you chose to display and analyse the data from your research. You should include your justification for choosing the graphical representations a
  18. June 2019, Component 2, Q10(a)(i) (1 mark): (a) (i) Identify one appropriate graphical representation that could be used to display the data in this research. [1]
  19. June 2019, Component 2, Q10(a)(ii) (4 marks): (ii) Using the graphical representation that you identified in (a) (i) display the data in this research. [4]
  20. June 2018, Component 2, Q3(a) (1 mark): (a) Normal distribution [1]
  21. June 2018, Component 2, Q3(b) (1 mark): (b) Positive skew [1]
  22. June 2018, Component 2, Q3(c) (1 mark): (c) Negative skew [1]

Questions, mark schemes and examiner’s reports are © WJEC Eduqas, from their published past papers. Plumi isn’t affiliated with any exam board. Want whole papers? Eduqas A-Level Psychology past papers.

The Plumi iPad app also offers exam-style questions with AI feedback on your handwritten working.