 plumi
Maxwell–Boltzmann distribution: AQA A‑Level Chemistry questions
AQA A-Level Chemistry past-paper questions on 3.1.5.2 Maxwell–Boltzmann distribution, 2008–2025, with mark schemes and examiner’s reports where available.
Paper
All papers
Exam
All years
Calculations
Q09.4
The whole paper ↗
- Your answer
Q01.6
The whole paper ↗
Q01.1
The whole paper ↗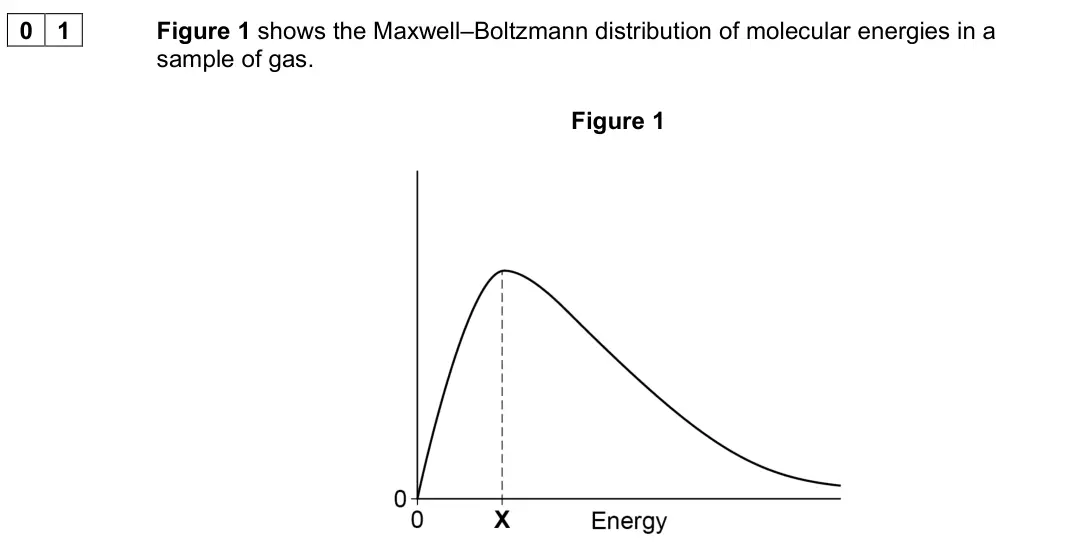
Q01.2
The whole paper ↗Q01.3
The whole paper ↗Q01.4
The whole paper ↗Q01.1
The whole paper ↗
Q01.2
The whole paper ↗
All 40 questions on Maxwell–Boltzmann distribution, as a list
- June 2025, AS Paper 2, Q19 (1 mark): The Maxwell–Boltzmann distribution of molecular energies for a sample of gas at two different temperatures is shown. Which letter represents the mean energy of
- June 2024, Paper 3, Q14 (1 mark): The Maxwell–Boltzmann distribution curve is shown for a gaseous reaction mixture. What is represented by the total area under the curve? [1 mark] A The total en
- June 2023, Paper 2, Q09.4 (5 marks): Sketch the Maxwell–Boltzmann distribution of molecular energies for gaseous ethanoic anhydride at temperature T1 and at a higher temperature T2 Include a label
- June 2023, Paper 3, Q11 (1 mark): This is a Maxwell–Boltzmann distribution for a gaseous reactant. What is represented by the total area under the curve? [1 mark] A total energy of the particles
- June 2023, AS Paper 2, Q08 (6 marks): Draw the Maxwell–Boltzmann distribution curves for a fixed mass of a gas at two different temperatures. This gas decomposes when heated. By reference to these d
- June 2022, Paper 3, Q09 (1 mark): Consider the change that occurs in the shape of the curve for the distribution of molecular energies in a gas when the temperature of the gas is increased. Whic
- June 2022, AS Paper 2, Q01.6 (2 marks): The investigation shows that increasing the temperature causes the rate of reaction to increase. Explain why a small increase in temperature causes a large incr
- June 2022, AS Paper 2, Q14 (1 mark): Which statement about molecules in a gas is correct? [1 mark] A At a fixed temperature they all move at the same speed. B At a fixed temperature their average k
- November 2021, Paper 3, Q19 (1 mark): Which statement about the distribution curve of molecular energies in an ideal gas at a given temperature is correct? [1 mark] A There are no molecules with zer
- November 2021, AS Paper 2, Q01.1 (1 mark): Label the y-axis on Figure 1. [1 mark]
- November 2021, AS Paper 2, Q01.2 (1 mark): State why the curve starts at the origin. [1 mark]
- November 2021, AS Paper 2, Q01.3 (1 mark): State what X indicates on Figure 1. [1 mark] X indicates
- November 2021, AS Paper 2, Q01.4 (2 marks): Half of the gas molecules in the sample are removed. The remaining gas molecules are kept at the same temperature. Draw the new distribution of molecular energi
- November 2020, AS Paper 2, Q20 (1 mark): Which statement about the molecules in a sample of a gas is correct? [1 mark] A At a given temperature they all move at the same speed. B At a given temperature
- June 2019, AS Paper 2, Q11 (1 mark): Which statement is correct for the distribution curve of molecular energies in a gas? [1 mark] A The curve is symmetrical about the maximum. B There are always
- June 2018, AS Paper 2, Q16 (1 mark): The Maxwell–Boltzmann distribution of molecular energies in a sample of gas at a fixed temperature is shown. Which letter represents the mean energy of the mole
- June 2017, Paper 3, Q16 (1 mark): The diagram shows the Maxwell−Boltzmann distribution of molecular energies in a gas at two different temperatures. Which letter represents the most probable ene
- June 2017, AS Paper 2, Q01.1 (1 mark): Label the horizontal axis in Figure 1. [1 mark]
- June 2017, AS Paper 2, Q01.2 (2 marks): On Figure 1, sketch a distribution of molecular energies for this sample of gas at a higher temperature. [2 marks]
- June 2016, AS Paper 2, Q16 (1 mark): Figure 7 shows a typical energy distribution for particles of an ideal gas in a sealed container at a fixed temperature. Figure 7 Which of the following stateme
- June 2016, CHEM2 (old spec), Q5(a)(i) (1 mark): Sketch a second curve on Figure 2 to show the distribution of molecular energies in this mixture at a higher temperature. [1 mark]
- June 2014, CHEM2 (old spec), Q2(a) (1 mark): One of the axes is labelled. Label the other axis. [1 mark]
- June 2014, CHEM2 (old spec), Q2(b) (1 mark): State why the curve starts at the origin. [1 mark]
- June 2014, CHEM2 (old spec), Q2(c) (1 mark): Which of the following, A, B or C, describes what the value of Y represents in Figure 2? Write the correct letter, A, B or C, in the box. [1 mark] A The energy
- June 2014, CHEM2 (old spec), Q2(d) (2 marks): On Figure 2, draw a distribution of molecular energies in this sample of gas at a higher temperature. [2 marks]
- June 2014, CHEM2 (old spec), Q2(e) (1 mark): The pressure of the original sample of gas is doubled at temperature T. State the effect, if any, of this change on the value of Y. [1 mark]
- June 2013, CHEM2 (old spec), Q3(a) (3 marks): On the appropriate axis of this diagram, mark the value of Emp for this distribution. On this diagram, sketch a new distribution for the same sample of gas at a
- June 2013, CHEM2 (old spec), Q3(b) (2 marks): With reference to the Maxwell–Boltzmann distribution, explain why a decrease in temperature decreases the rate of decomposition of this gas.
- January 2012, CHEM2 (old spec), Q3(a) (1 mark): One of the axes is labelled. Complete the diagram by labelling the other axis. (1 mark)
- January 2012, CHEM2 (old spec), Q3(b) (1 mark): State the effect, if any, of a solid catalyst on the shape of either of these distributions. (1 mark)
- January 2012, CHEM2 (old spec), Q3(c) (1 mark): In the box, write the letter, V, W, X or Y, that represents the most probable energy of the molecules at the lower temperature. (1 mark)
- June 2011, CHEM2 (old spec), Q1(c)(i) (1 mark): State how, if at all, the value of the most probable energy (Emp) changes as the total number of molecules is increased at constant temperature. (1 mark)
- June 2011, CHEM2 (old spec), Q1(c)(ii) (1 mark): State how, if at all, the number of molecules with the most probable energy (Emp) changes as the temperature is decreased without changing the total number of m
- June 2011, CHEM2 (old spec), Q1(c)(iv) (1 mark): State how, if at all, the area under the molecular energy distribution curve changes as a catalyst is introduced without changing the temperature or the total n
- January 2011, CHEM2 (old spec), Q2(a)(i) (2 marks): On this diagram, sketch the distribution for the same sample of gas at a higher temperature. (2 marks)
- June 2008, CHM2 (2008 spec), Q5(b) (4 marks): 5 (b) State what Q represents and what the total area under the curve represents. Explain why the curve starts at the origin and why the shaded area is very sma
- June 2008, CHM2 (2008 spec), Q5(c) (7 marks): 5 (c) Describe how the shape of the curve, the area under the curve, the value of Ea and the value of Q change if the temperature is increased. Explain why a sm
- June 2008, CHM6W (2008 spec), Q24 (1 mark): 24 Correct statements at constant volume include 1 the change shown in diagram P occurs when the temperature is decreased. 2 the change shown in diagram Q occur
- January 2008, CHM2 (2008 spec), Q4(a) (2 marks): (a) On Figure 1 below draw a curve to show the distribution of energies for one mole of gas at a higher temperature. Figure 1 (2 marks) Energy Number of molecul
- January 2008, CHM2 (2008 spec), Q4(b) (2 marks): (b) On Figure 2 below draw a curve to show the distribution of energies for two moles of gas at 300 K. Figure 2 (2 marks) Energy Number of molecules with a give
Questions, mark schemes and examiner’s reports are © AQA, from their published past papers. Plumi isn’t affiliated with any exam board. Want whole papers? AQA A-Level Chemistry past papers.
The Plumi iPad app also offers exam-style questions with AI feedback on your handwritten working.