 plumi
Effect of temperature on reaction rate: AQA A‑Level Chemistry questions
AQA A-Level Chemistry past-paper questions on 3.1.5.3 Effect of temperature on reaction rate, 2008–2025, with mark schemes and examiner’s reports where available.
Paper
All papers
Exam
All years
Calculations
Q09.1
The whole paper ↗
Q09.2
The whole paper ↗Q02.2
The whole paper ↗
Q02.1
The whole paper ↗
Q02.6
The whole paper ↗Q06.2
The whole paper ↗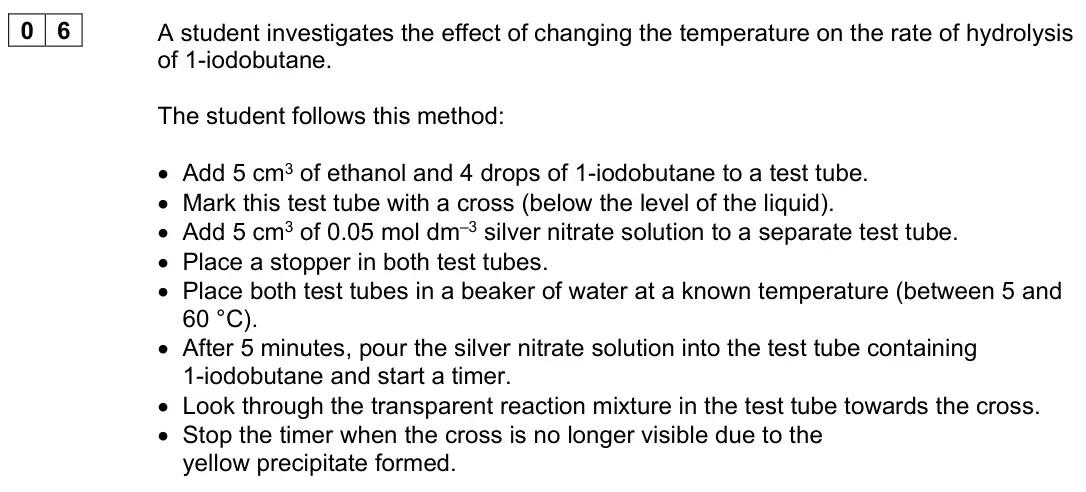
Q01.1
The whole paper ↗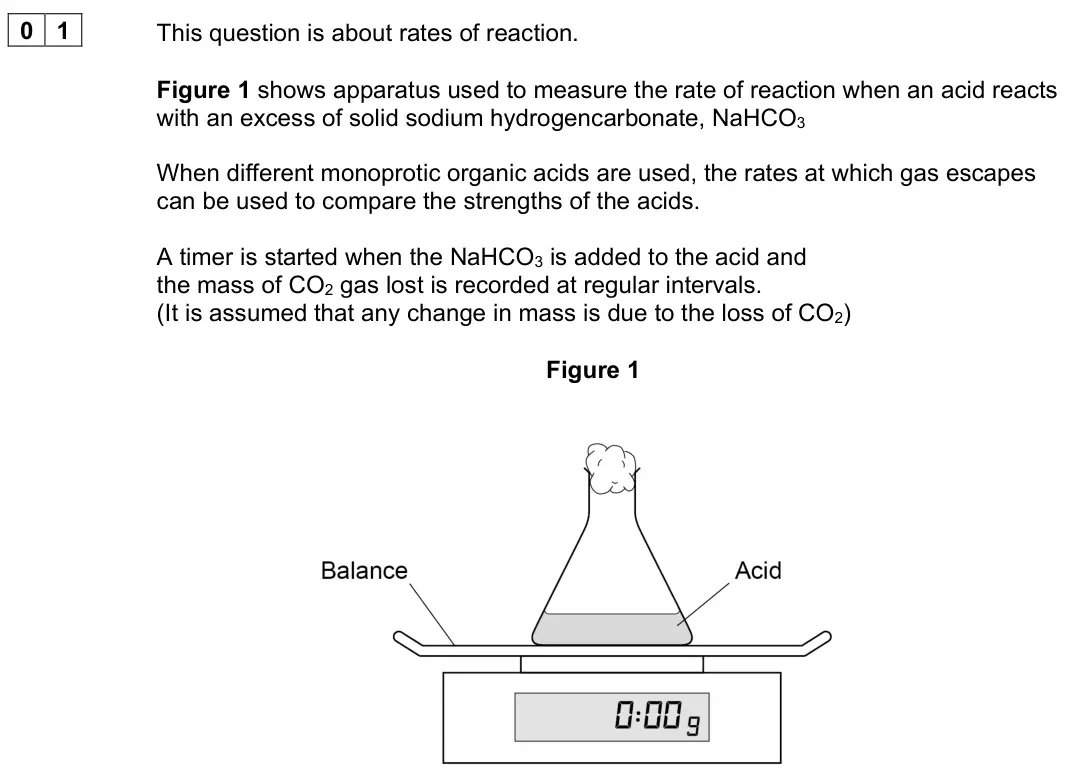
Q01.2
The whole paper ↗Q09.4
The whole paper ↗
Q01.5
The whole paper ↗
Q01.6
The whole paper ↗Q01.1
The whole paper ↗
Q01.2
The whole paper ↗Q01.3
The whole paper ↗Q01.4
The whole paper ↗Q01.5
The whole paper ↗Q01.6
The whole paper ↗Q02.1
The whole paper ↗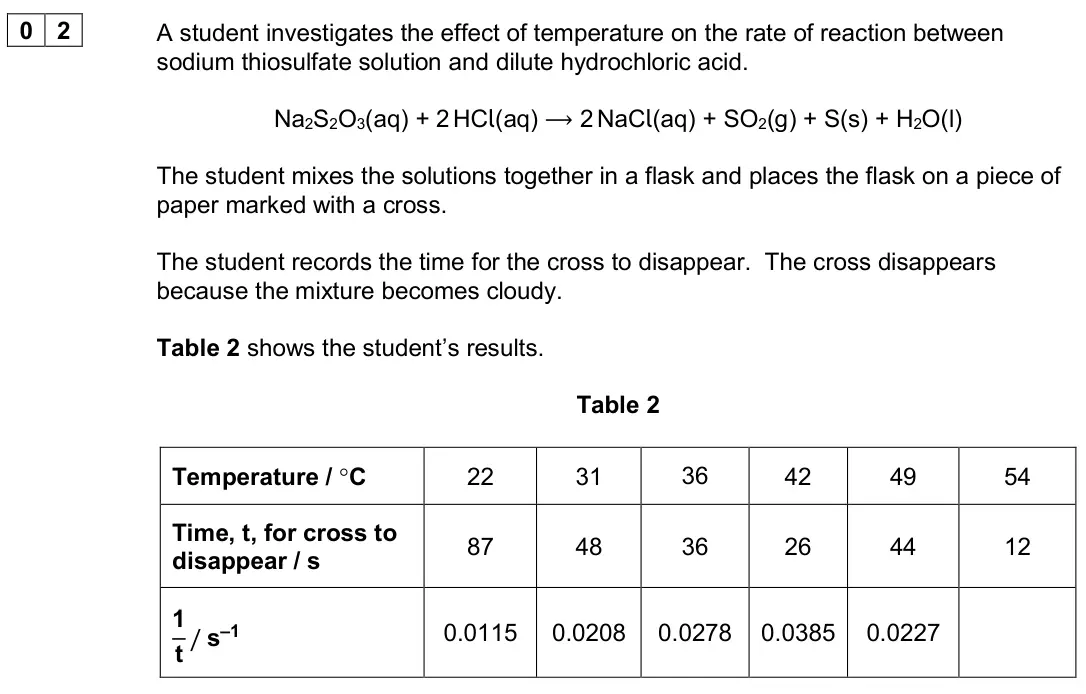
All 49 questions on Effect of temperature on reaction rate, as a list
- June 2025, Paper 2, Q09.1 (1 mark): State why the cross on the boiling tube becomes invisible. [1 mark]
- June 2025, Paper 2, Q09.2 (1 mark): The volume and concentration of each substance used at each temperature is kept constant. Identify one other variable that should be kept constant to ensure tha
- June 2025, AS Paper 2, Q02.2 (3 marks): Explain why the rate of a reaction increases as the temperature increases. [3 marks]
- June 2024, Paper 3, Q02.1 (2 marks): Suggest why a loose cotton wool plug is placed in the neck of the flask, instead of leaving the flask open or inserting a bung. [2 marks] Instead of leaving the
- June 2024, Paper 3, Q02.6 (2 marks): In this experiment the variable measured is mass loss. The rate of this reaction at a constant temperature can be investigated in other ways. Suggest two other
- June 2024, Paper 3, Q15 (1 mark): A student investigated the reaction between magnesium and hydrochloric acid. Mg(s) + 2 HCl(aq) ⟶ MgCl2(aq) + H2(g) The results are plotted on this graph. Which
- June 2024, AS Paper 2, Q06.2 (3 marks): Plot the values of 1 t against temperature on the grid. Draw a line of best fit. Use your graph to predict the time, in s, when the cross is no longer visible a
- June 2023, Paper 2, Q01.1 (1 mark): Suggest a reason why using a conical flask instead of a beaker would give more accurate results in this experiment. [1 mark] Figure 2 shows the results of this
- June 2023, Paper 2, Q01.2 (3 marks): Use Figure 2 to calculate the rate of reaction at 2 minutes. Deduce the units of your calculated rate. [3 marks] Rate Units
- June 2023, Paper 2, Q09.4 (5 marks): Sketch the Maxwell–Boltzmann distribution of molecular energies for gaseous ethanoic anhydride at temperature T1 and at a higher temperature T2 Include a label
- June 2023, AS Paper 2, Q08 (6 marks): Draw the Maxwell–Boltzmann distribution curves for a fixed mass of a gas at two different temperatures. This gas decomposes when heated. By reference to these d
- June 2022, Paper 2, Q01.5 (3 marks): Describe and explain the shape of the graph in Figure 1. [3 marks]
- June 2022, Paper 2, Q01.6 (1 mark): Deduce the time taken for the reaction at 35 oC [1 mark] Time s
- June 2022, AS Paper 2, Q01.1 (1 mark): Complete Table 1. [1 mark]
- June 2022, AS Paper 2, Q01.2 (1 mark): State the independent variable in this investigation. [1 mark]
- June 2022, AS Paper 2, Q01.3 (1 mark): The student noticed that the temperature of each reaction mixture decreased during each experiment. Suggest how the student calculated the temperature values in
- June 2022, AS Paper 2, Q01.4 (3 marks): 0 1 This question is about rates of reaction. Potassium manganate(VII), KMnO4, reacts with sodium ethanedioate, Na2C2O4, in the presence of dilute sulfuric acid
- June 2022, AS Paper 2, Q01.5 (1 mark): Use your graph in Question 01.4 to find the time taken for the mixture to go colourless at 60 °C Show your working. [1 mark] Time t s
- June 2022, AS Paper 2, Q01.6 (2 marks): The investigation shows that increasing the temperature causes the rate of reaction to increase. Explain why a small increase in temperature causes a large incr
- November 2020, AS Paper 2, Q02.1 (1 mark): The student uses a stopwatch to measure the time. The stopwatch shows each time to the nearest 0.01 s Suggest why the student records the times to the nearest s
- November 2020, AS Paper 2, Q02.2 (1 mark): The rate of reaction is proportional to 1 t Complete Table 2. [1 mark]
- November 2020, AS Paper 2, Q02.3 (2 marks): Plot the values of 1 t against temperature on Figure 1. Draw a line of best fit. [2 marks] Figure 1
- November 2020, AS Paper 2, Q02.4 (1 mark): Use your line of best fit to estimate the time for the cross to disappear at 40 °C Show your working. [1 mark] Time s
- November 2020, AS Paper 2, Q02.5 (1 mark): Suggest, by considering the products of this reaction, why small amounts of reactants are used in this experiment. [1 mark]
- November 2020, AS Paper 2, Q02.6 (1 mark): The student could do the experiment at lower temperatures using an ice bath. Suggest why the student chose not to carry out experiments at temperatures in the r
- June 2019, Paper 3, Q01.4 (6 marks): The initial rate of the reaction between sodium thiosulfate and hydrochloric acid can be monitored by measuring the time taken for a fixed amount of sulfur to b
- June 2017, AS Paper 2, Q01.2 (2 marks): On Figure 1, sketch a distribution of molecular energies for this sample of gas at a higher temperature. [2 marks]
- June 2017, AS Paper 2, Q01.3 (2 marks): This gas decomposes on heating. Explain why an increase in temperature increases the rate at which this gas decomposes. [2 marks]
- Specimen, Paper 2, Q01.4 (3 marks): The rate equation for a reaction is rate = k[E] Explain qualitatively why doubling the temperature has a much greater effect on the rate of the reaction than do
- June 2016, CHEM2 (old spec), Q5(a)(i) (1 mark): Sketch a second curve on Figure 2 to show the distribution of molecular energies in this mixture at a higher temperature. [1 mark]
- June 2016, CHEM2 (old spec), Q5(a)(ii) (2 marks): Explain with reference to both curves in Figure 2 how a small change in temperature leads to a large change in the rate of reaction. [2 marks]
- June 2015, CHEM5 (old spec), Q3(c) (1 mark): The temperature used for this manufacture of hydrogen is usually about 1300 K. Suggest one reason, other than changing the position of equilibrium, why this tem
- June 2014, CHEM2 (old spec), Q2(d) (2 marks): On Figure 2, draw a distribution of molecular energies in this sample of gas at a higher temperature. [2 marks]
- June 2013, CHEM2 (old spec), Q3(a) (3 marks): On the appropriate axis of this diagram, mark the value of Emp for this distribution. On this diagram, sketch a new distribution for the same sample of gas at a
- June 2013, CHEM2 (old spec), Q3(b) (2 marks): With reference to the Maxwell–Boltzmann distribution, explain why a decrease in temperature decreases the rate of decomposition of this gas.
- June 2012, CHEM2 (old spec), Q1(c) (2 marks): Draw a curve on Figure 3 to show how the total volume of oxygen collected will change with time if the original experiment is repeated at a temperature higher t
- January 2012, CHEM2 (old spec), Q3(e) (1 mark): Explain why a small increase in temperature has a large effect on the initial rate of a reaction.
- June 2011, CHEM2 (old spec), Q1(c)(iii) (1 mark): State how, if at all, the number of molecules with energy greater than the activation energy (Ea) changes as the temperature is increased without changing the t
- January 2011, CHEM4 (old spec), Q1(a)(vi) (2 marks): State the effect, if any, on the value of the rate constant k when the temperature is lowered but all other conditions are kept constant. Explain your answer. E
- January 2011, CHEM2 (old spec), Q2(a)(i) (2 marks): On this diagram, sketch the distribution for the same sample of gas at a higher temperature. (2 marks)
- January 2011, CHEM2 (old spec), Q2(a)(ii) (2 marks): With reference to the Maxwell–Boltzmann distribution, explain why an increase in temperature increases the rate of a chemical reaction.
- January 2010, CHEM4 (old spec), Q1(b)(ii) (1 mark): the time taken to reach equilibrium (1 mark)
- January 2010, CHEM2 (old spec), Q4(b) (3 marks): Calcium carbonate is an insoluble solid that can be used in a reaction to lower the acidity of the water in a lake. Explain why the rate of this reaction decrea
- June 2008, CHM2 (2008 spec), Q5(c) (7 marks): 5 (c) Describe how the shape of the curve, the area under the curve, the value of Ea and the value of Q change if the temperature is increased. Explain why a sm
- June 2008, CHM5 (2008 spec), Q5(b) (2 marks): 5 (b) On the axes above, sketch a curve to show how the results will change if the experiment leading to curve B is repeated under the same conditions of concen
- June 2008, CHM6W (2008 spec), Q24 (1 mark): 24 Correct statements at constant volume include 1 the change shown in diagram P occurs when the temperature is decreased. 2 the change shown in diagram Q occur
- June 2008, CHM6W (2008 spec), Q25 (1 mark): 25 Diagrams that illustrate changes which alter the value of the rate constant for the decomposition of gas G include 1 P 2 Q 3 R 4 S Directions summarised A B
- January 2008, CHM2 (2008 spec), Q4(a) (2 marks): (a) On Figure 1 below draw a curve to show the distribution of energies for one mole of gas at a higher temperature. Figure 1 (2 marks) Energy Number of molecul
- January 2008, CHM2 (2008 spec), Q4(c) (5 marks): (c) Gases A and B react together. (i) Explain why collisions between molecules of A and B do not always lead to a reaction. (ii) Explain why increasing the temp
Questions, mark schemes and examiner’s reports are © AQA, from their published past papers. Plumi isn’t affiliated with any exam board. Want whole papers? AQA A-Level Chemistry past papers.
The Plumi iPad app also offers exam-style questions with AI feedback on your handwritten working.