Skip to content

Scatter graphs and correlation: OCR GCSE Maths questions

Every OCR GCSE Maths exam question on S6 Scatter graphs and correlation, 2017–2025, with its mark scheme and examiner’s report.

Find questions921
Exam
All years
Calculator
921 questions

  1. Q4

    June 2025 · Paper 4

    The whole paper ↗
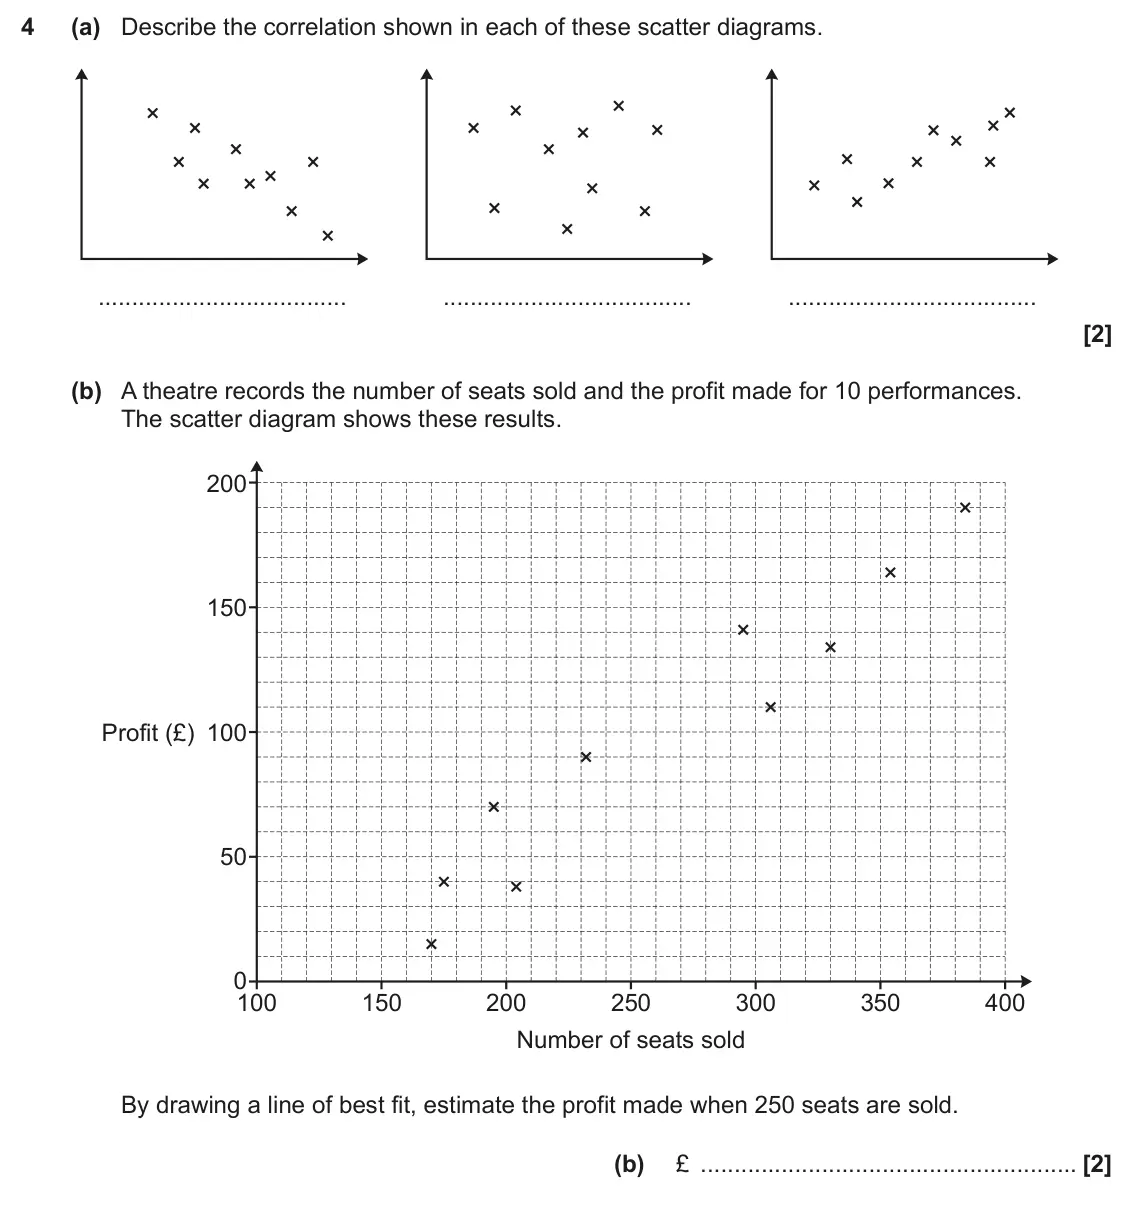
    June 2025 Paper 4, question 4: (a) Describe the correlation shown in each of these scatter diagrams. (b) A theatre records the number of seats sold and the profit made for 10 performances. Th
  2. Q4

    November 2024 · Paper 4

    The whole paper ↗
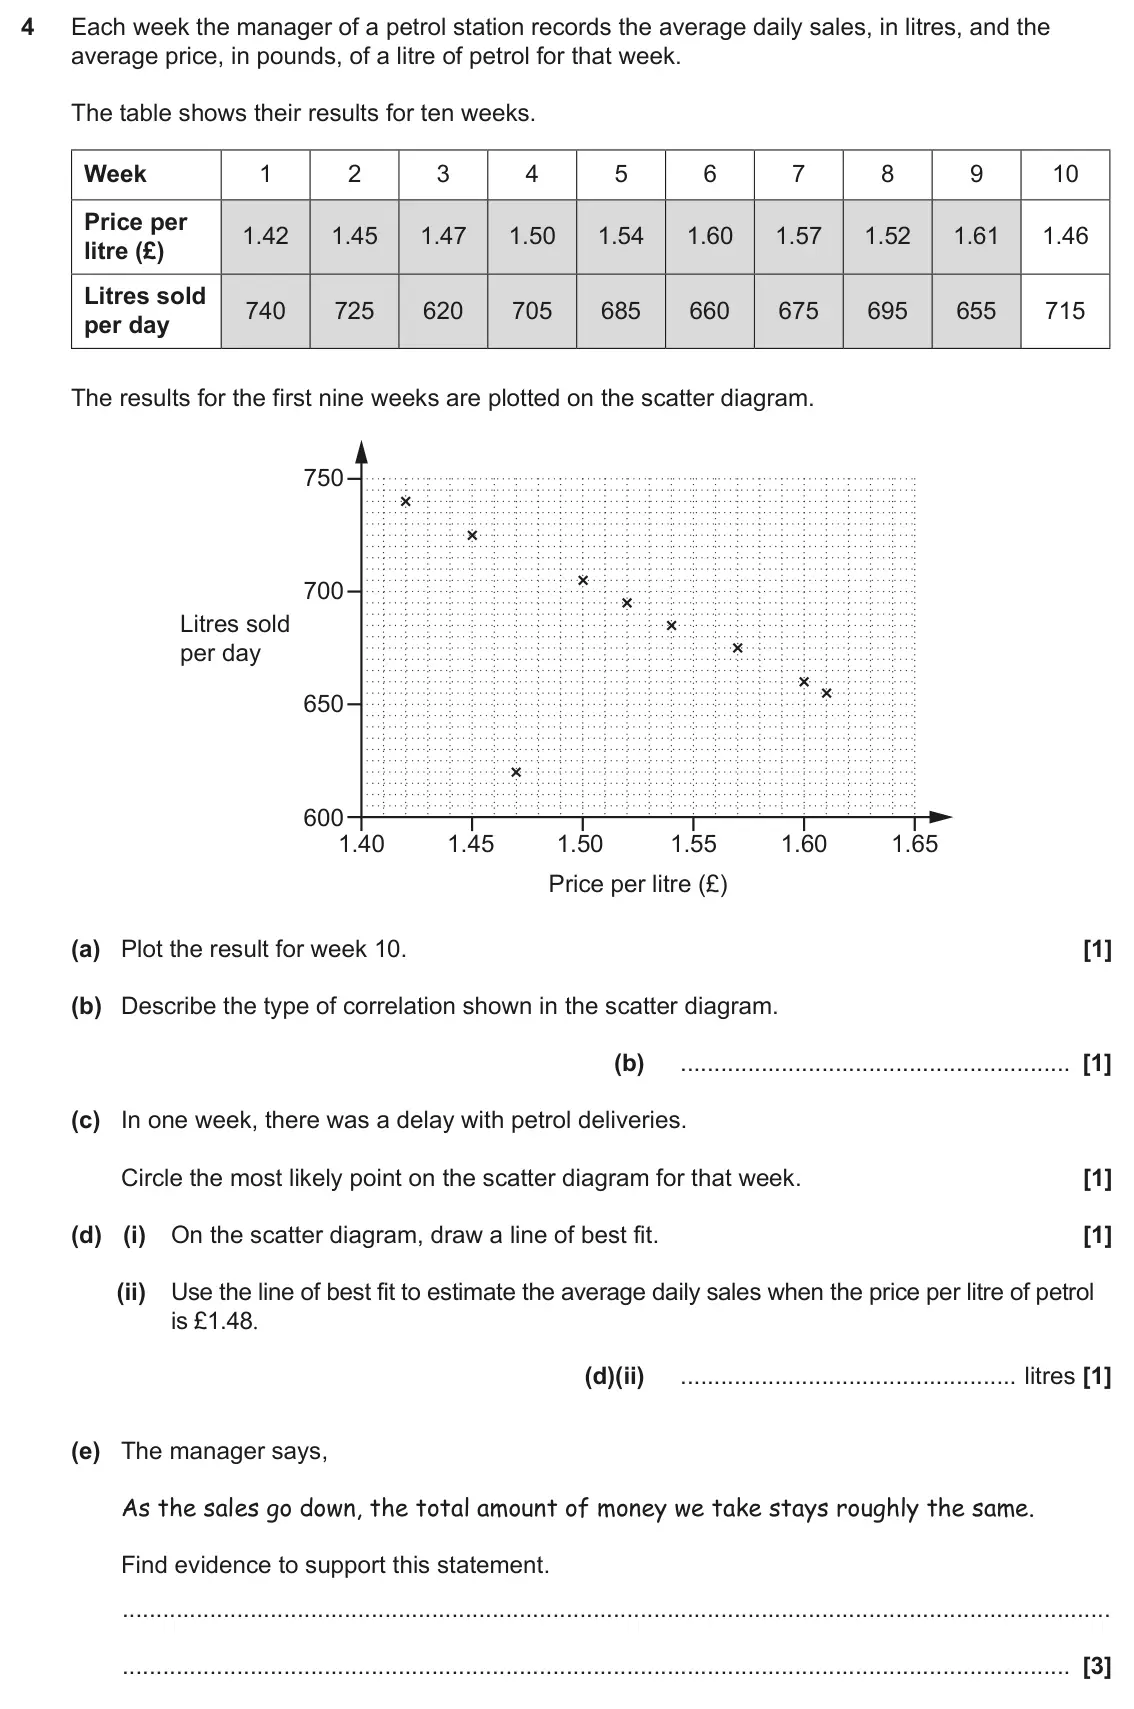
    November 2024 Paper 4, question 4: Each week the manager of a petrol station records the average daily sales, in litres, and the average price, in pounds, of a litre of petrol for that week. The
  3. Q4

    June 2024 · Paper 5

    The whole paper ↗
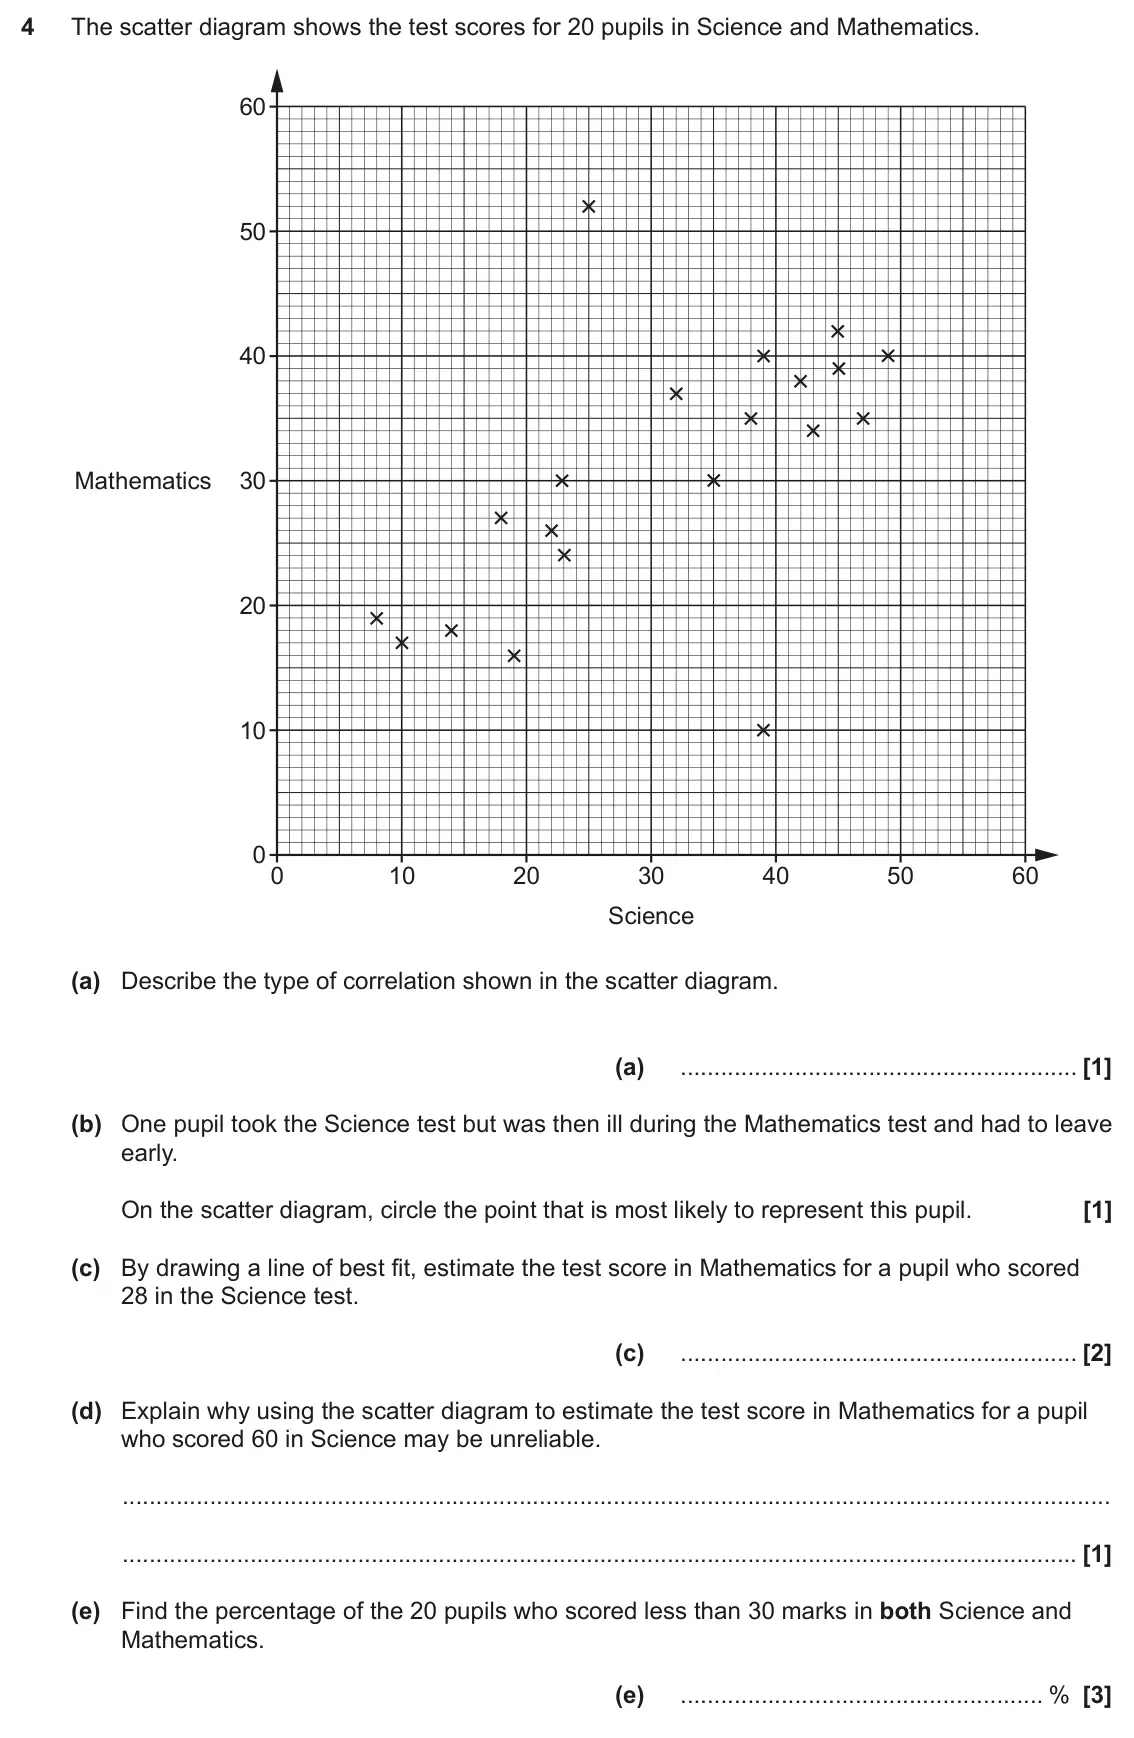
    June 2024 Paper 5, question 4: The scatter diagram shows the test scores for 20 pupils in Science and Mathematics. 60 50 40 Mathematics 30 20 10 0 0 10 20 30 40 50 60 Science (a) Describe the
  4. Q1

    November 2023 · Paper 6

    The whole paper ↗
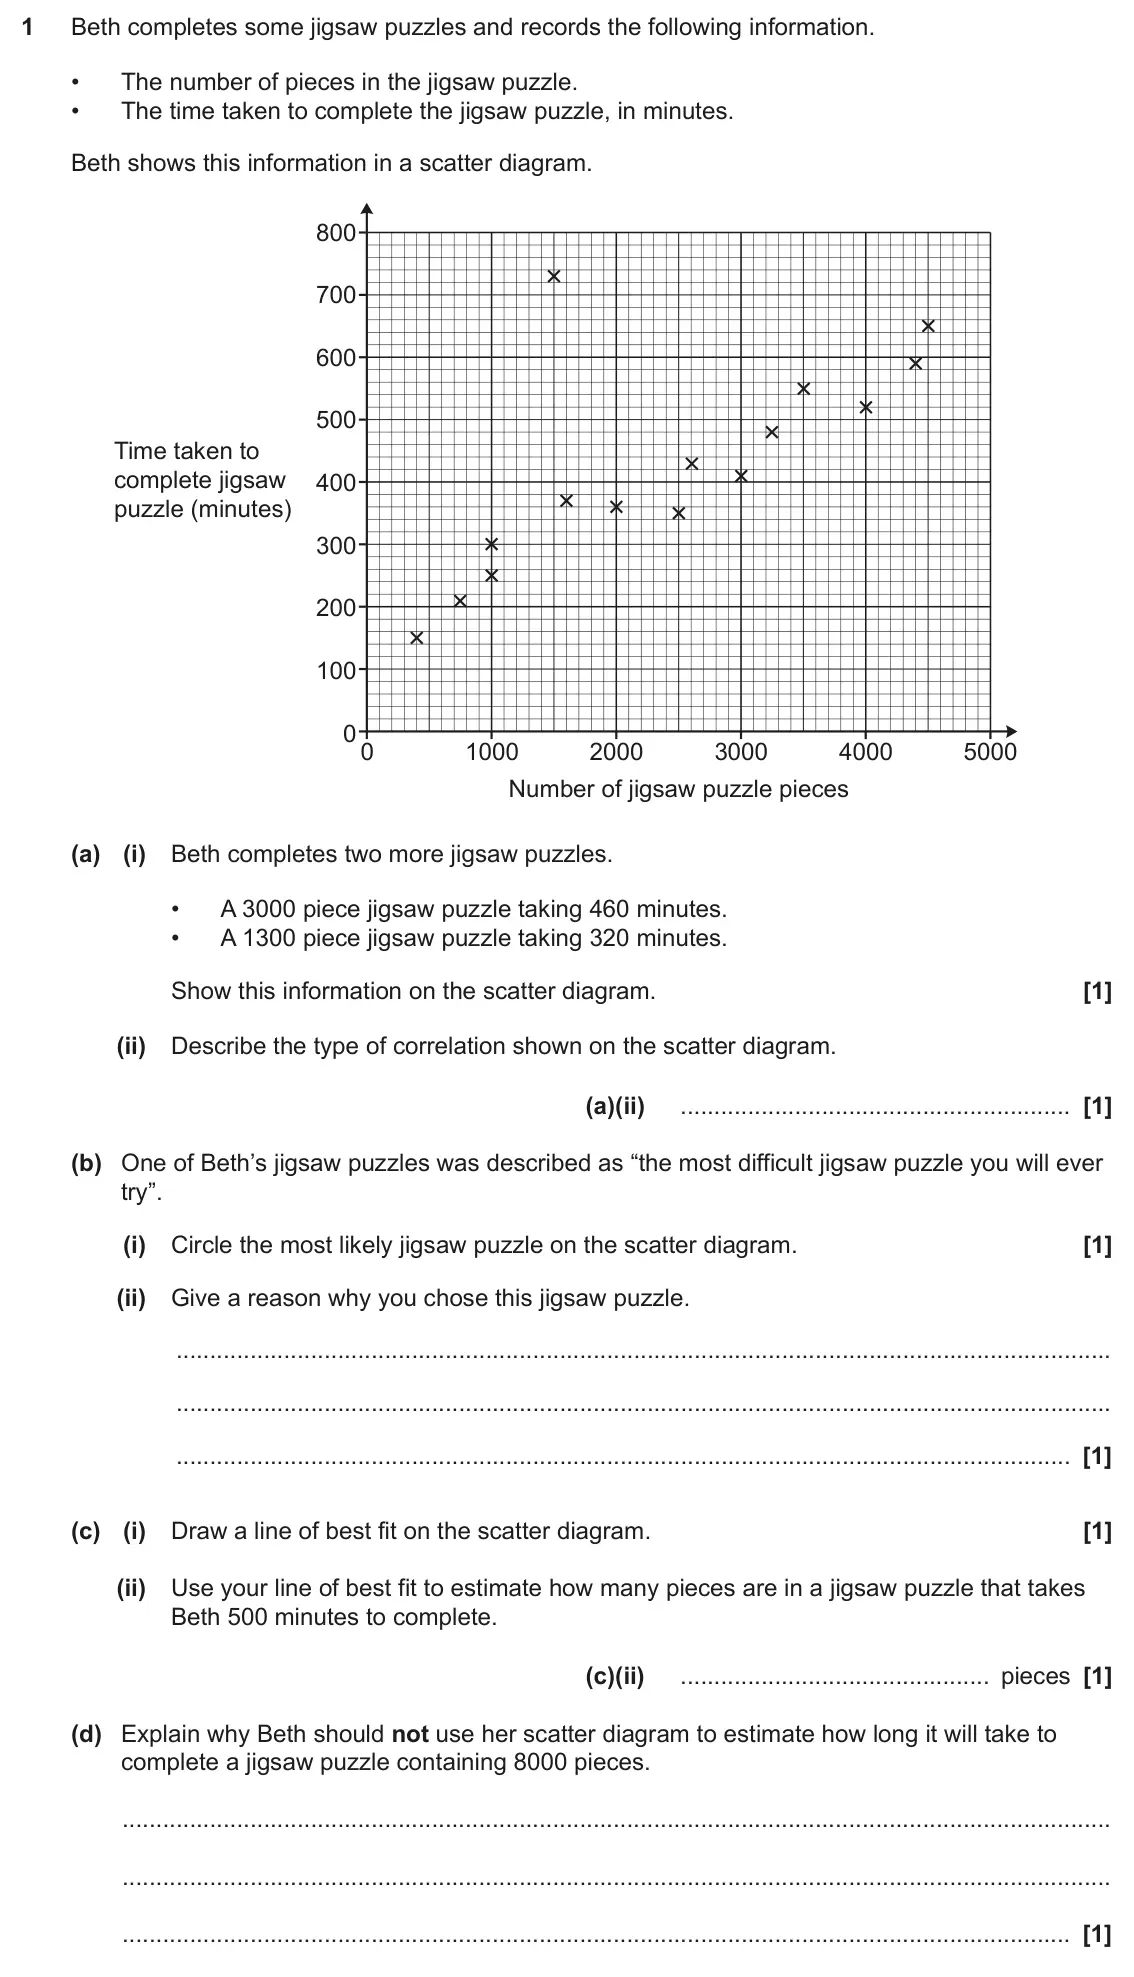
    November 2023 Paper 6, question 1: Beth completes some jigsaw puzzles and records the following information. • The number of pieces in the jigsaw puzzle. • The time taken to complete the jigsaw p
  5. Q5

    June 2023 · Paper 5

    The whole paper ↗
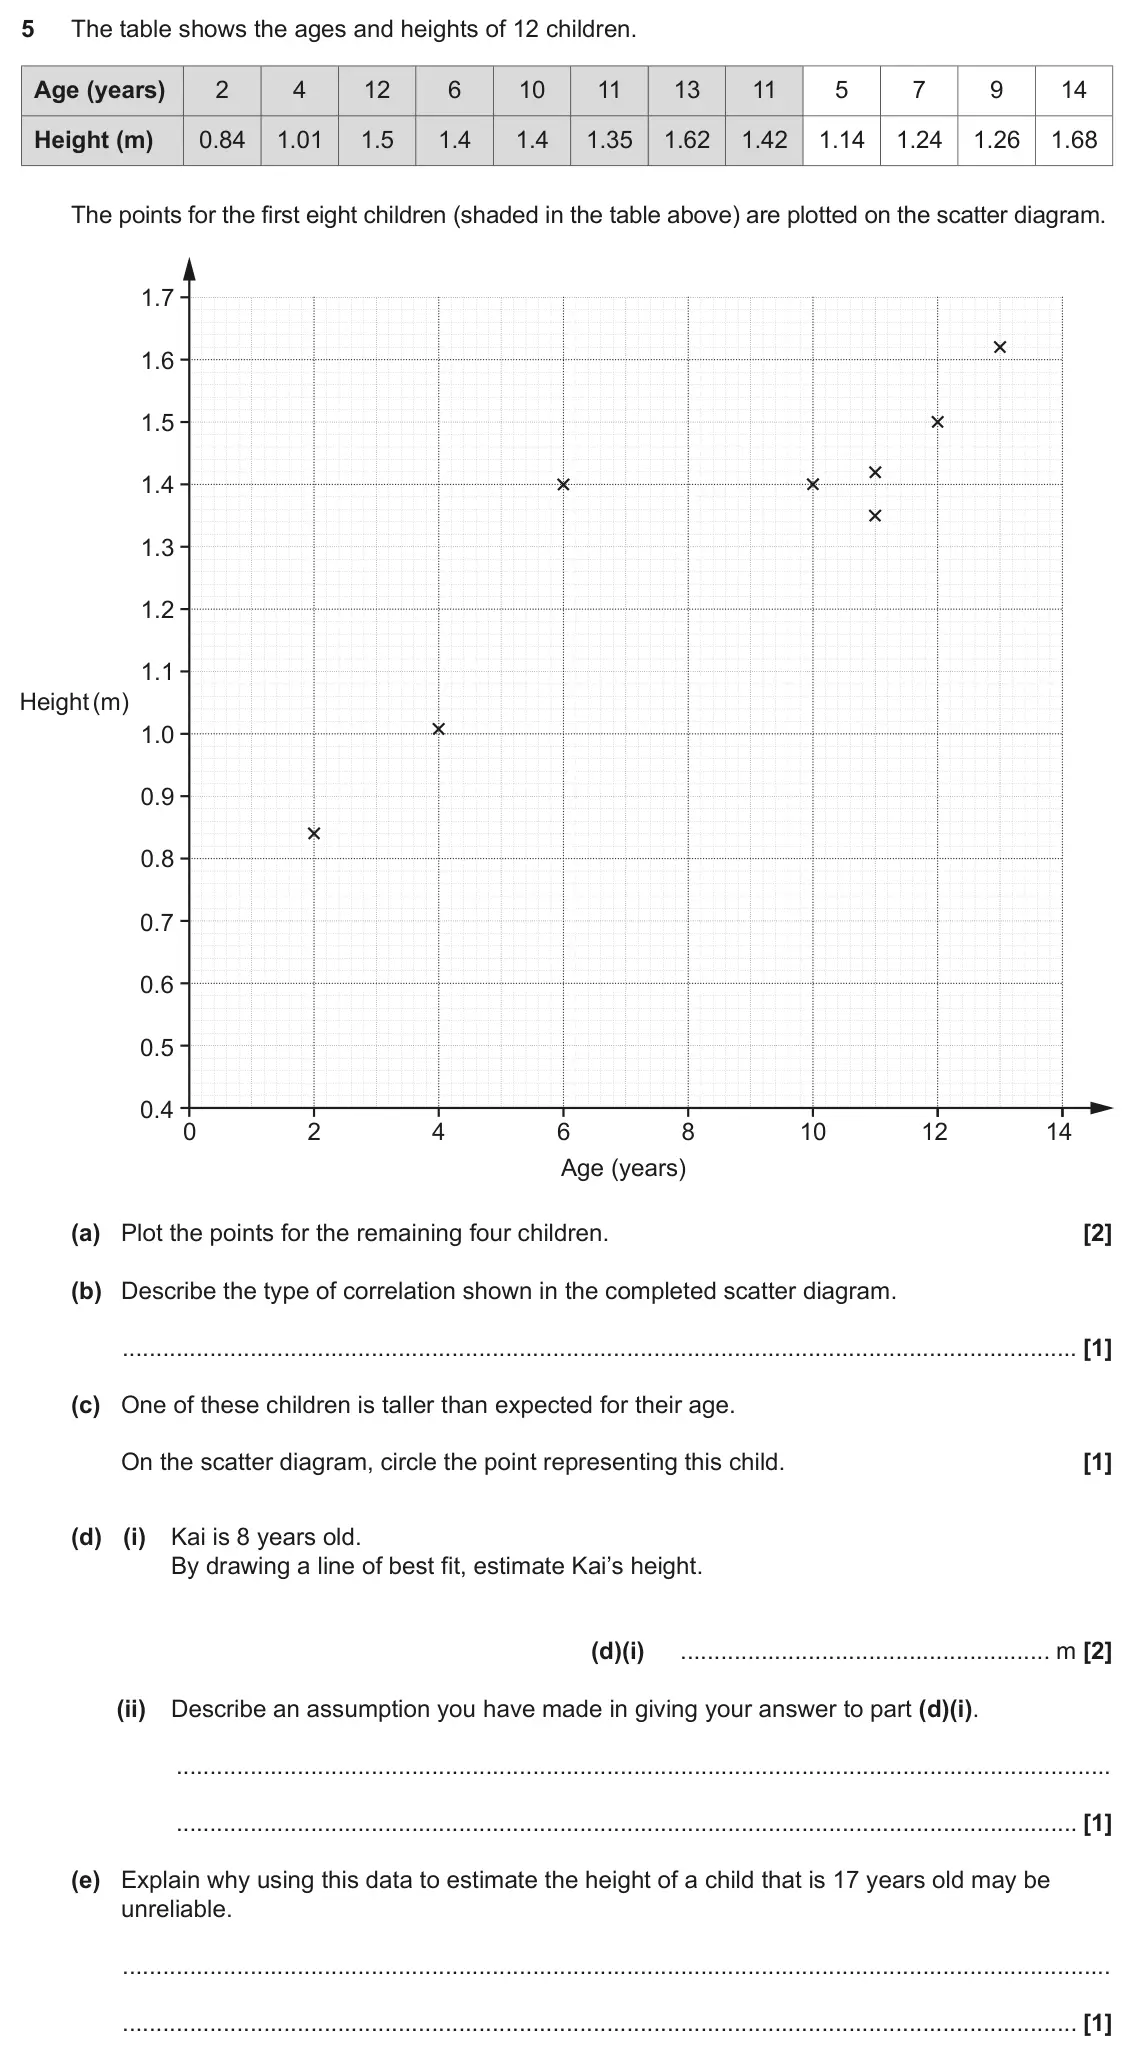
    June 2023 Paper 5, question 5: The table shows the ages and heights of 12 children. Age (years) 2 4 12 6 10 11 13 11 5 7 9 14 Height (m) 0.84 1.01 1.5 1.4 1.4 1.35 1.62 1.42 1.14 1.24 1.26 1.
  6. Q6

    November 2022 · Paper 6

    The whole paper ↗
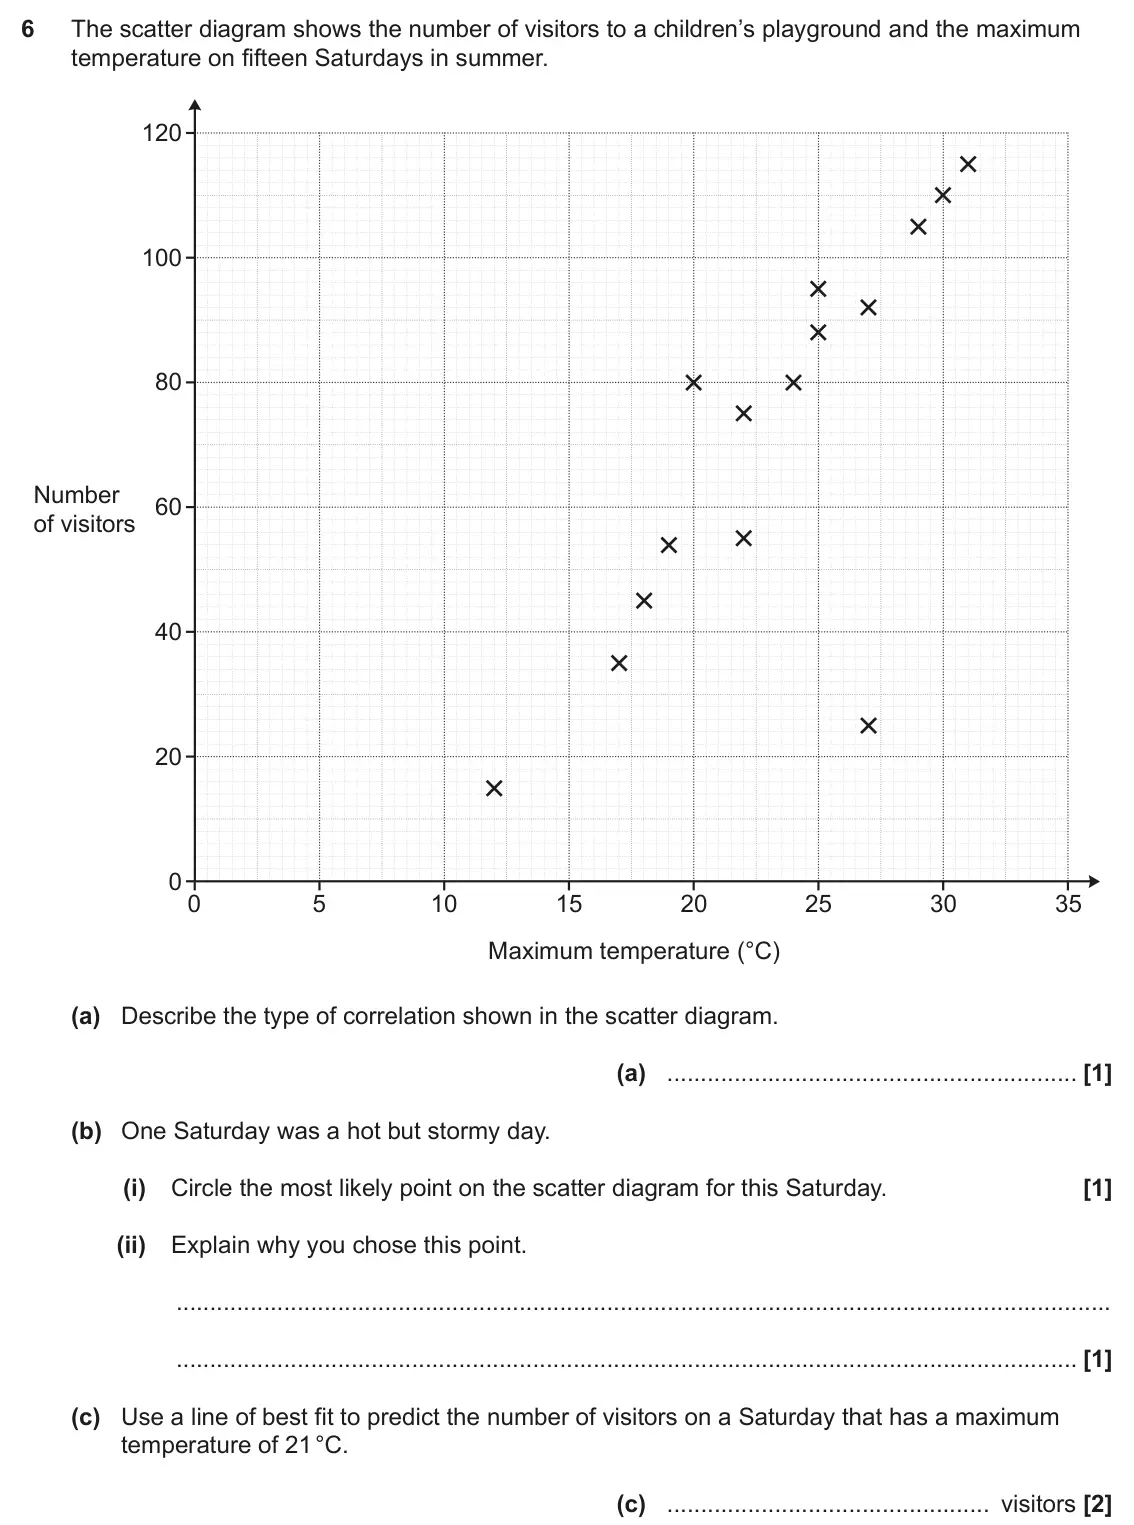
    November 2022 Paper 6, question 6: The scatter diagram shows the number of visitors to a children’s playground and the maximum temperature on fifteen Saturdays in summer. 120 100 80 Number 60 of
  7. Q5

    June 2022 · Paper 4

    The whole paper ↗
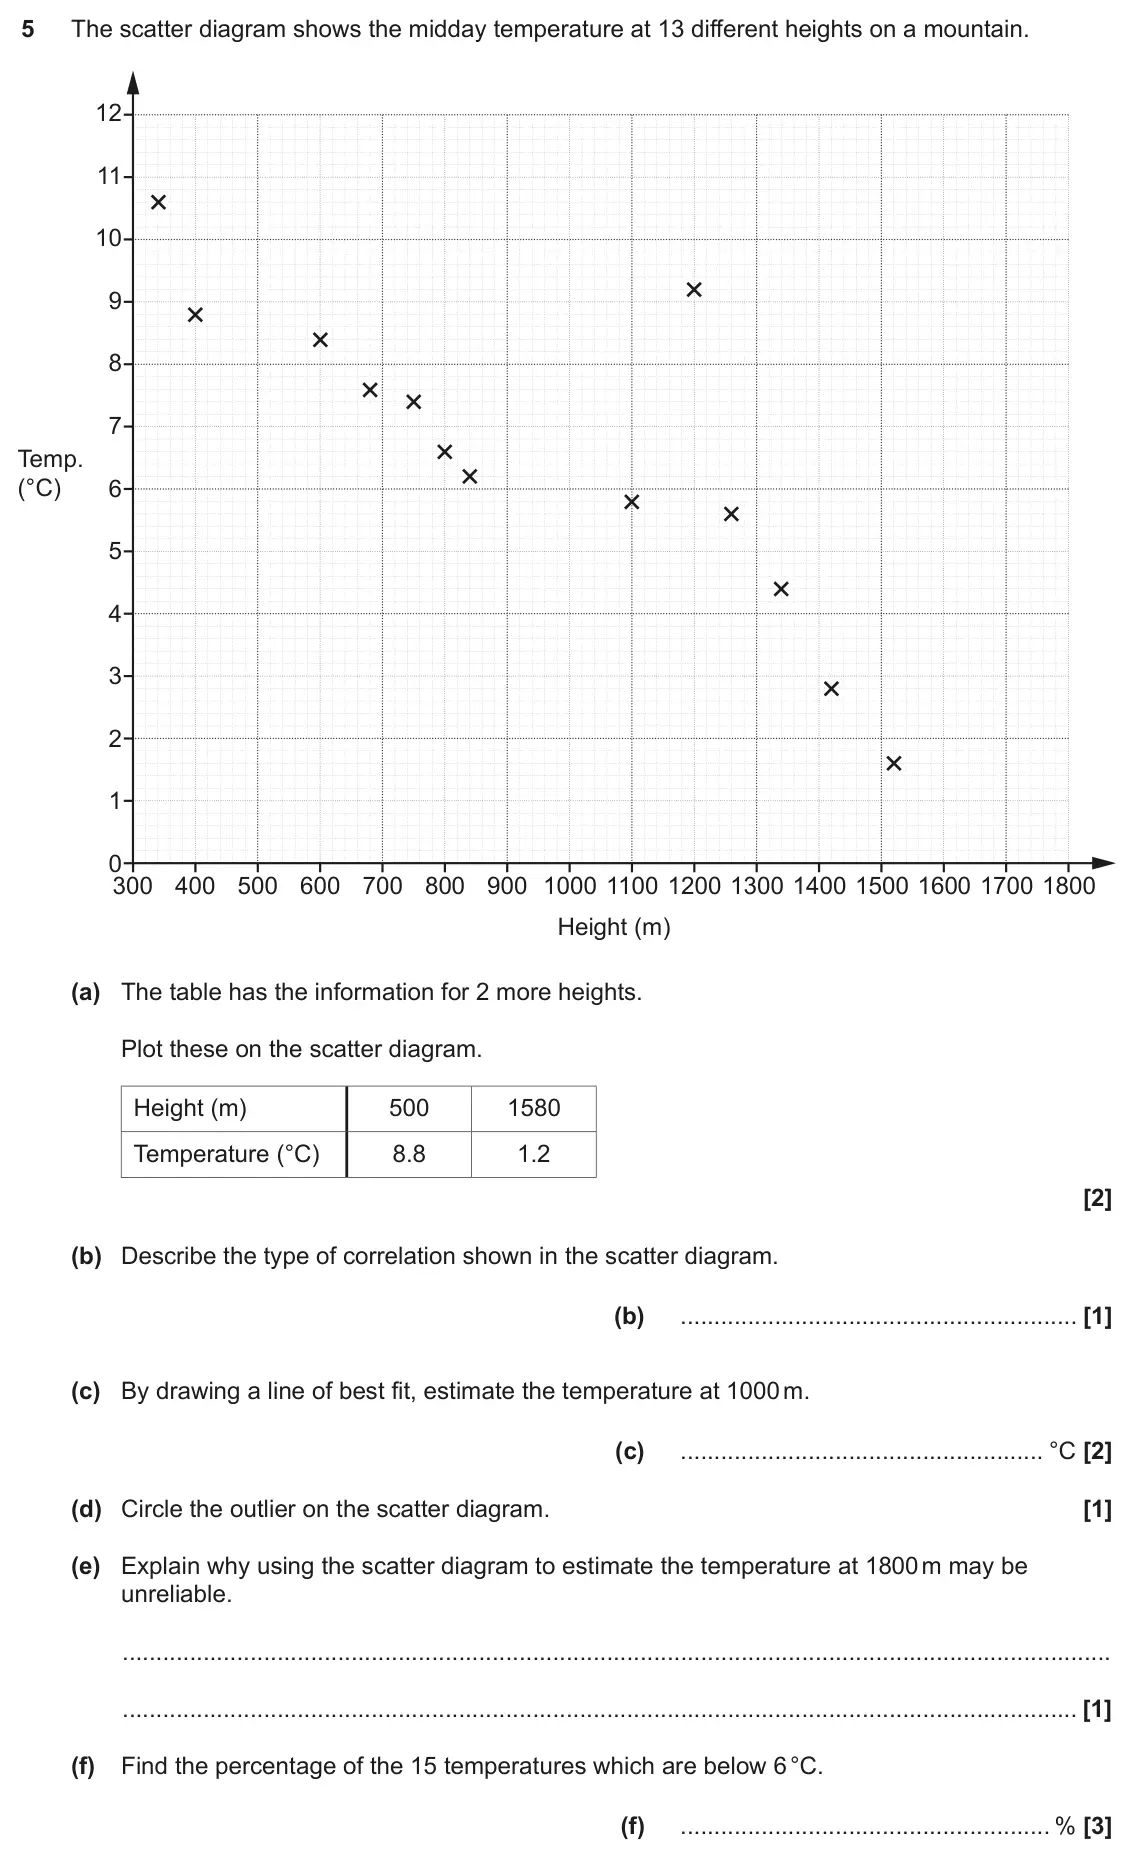
    June 2022 Paper 4, question 5: The scatter diagram shows the midday temperature at 13 different heights on a mountain. 12 11 10 9 8 7 Temp. (°C) 6 5 4 3 2 1 0 300 400 500 600 700 800 900 1000
  8. Q4

    November 2021 · Paper 5

    The whole paper ↗
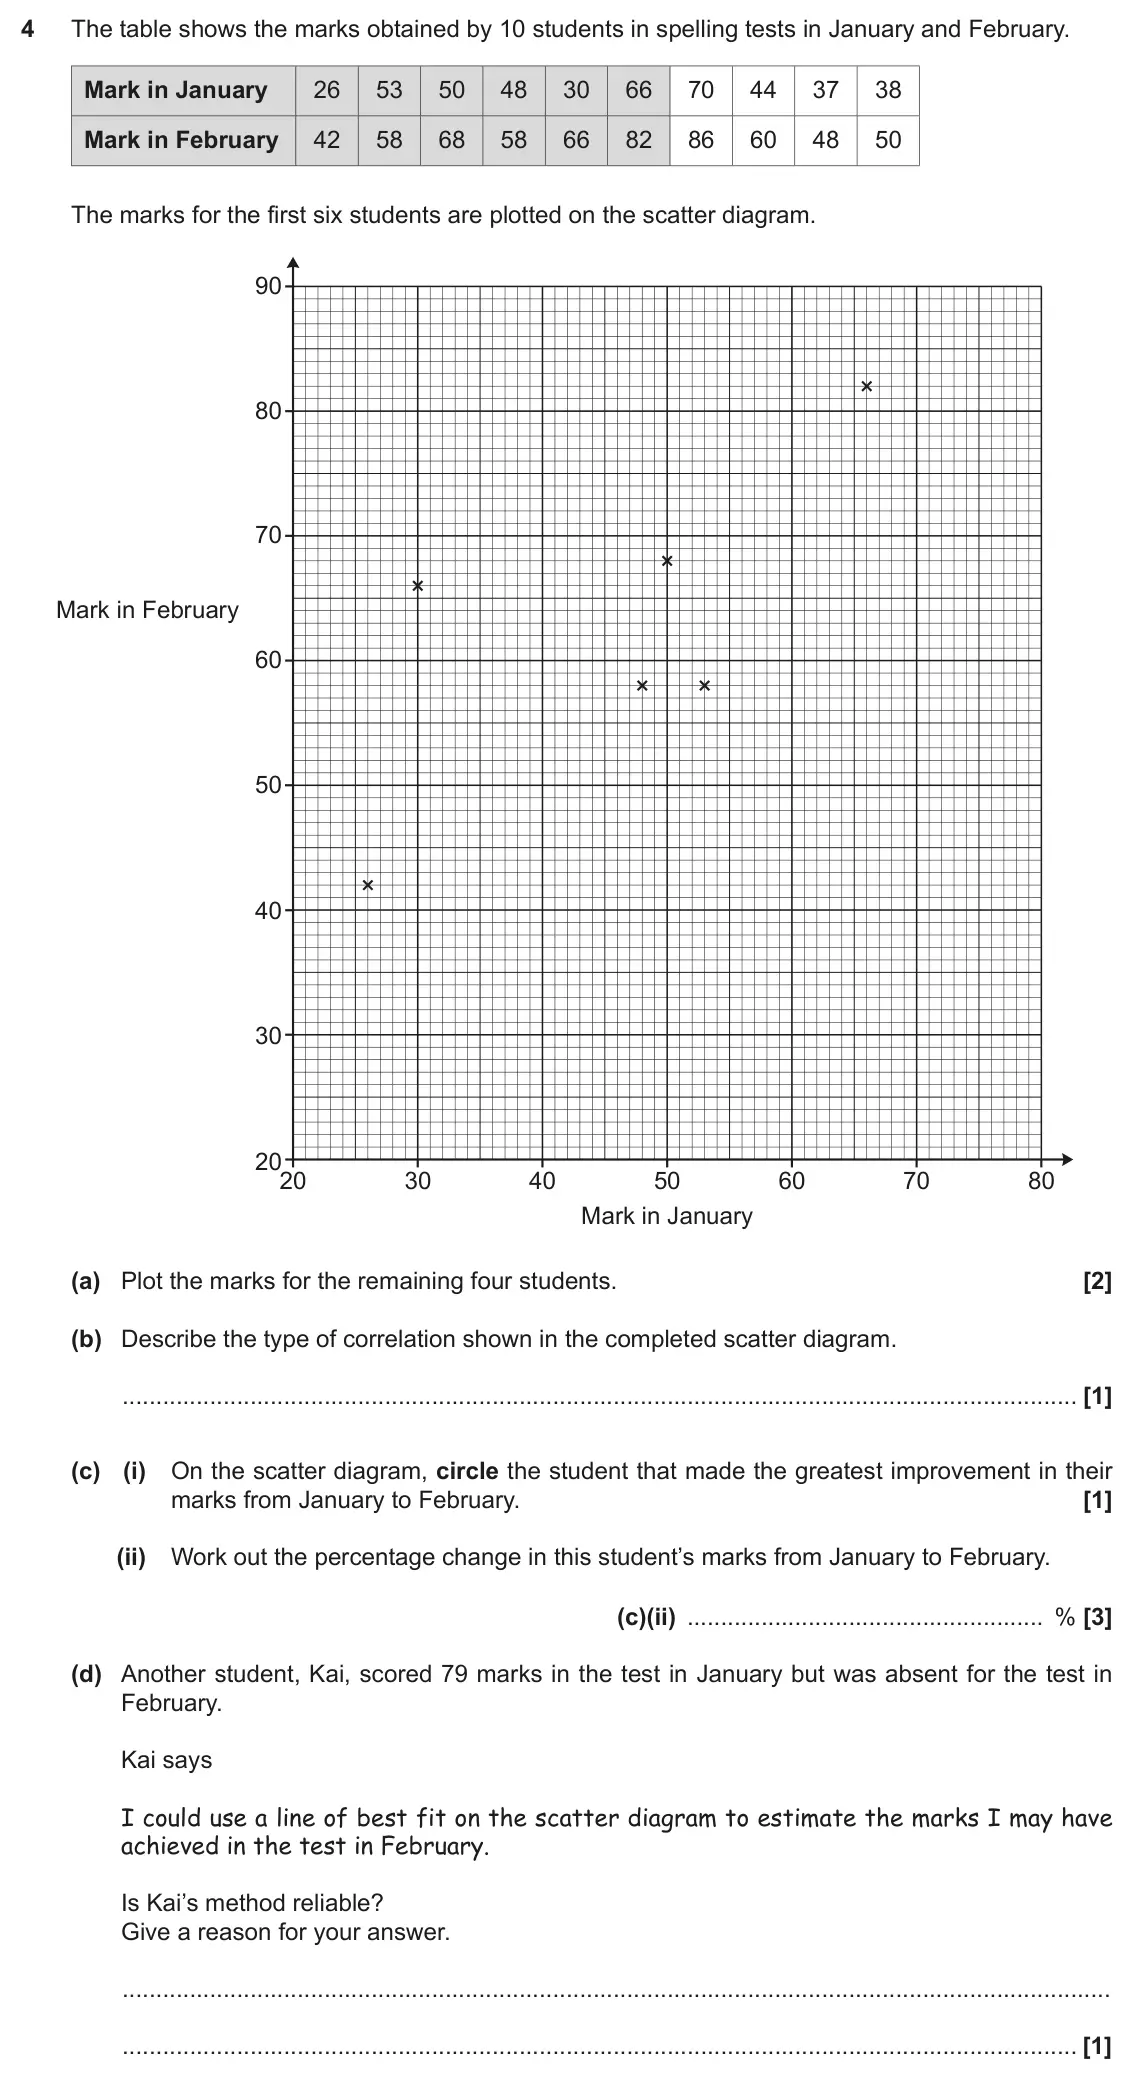
    November 2021 Paper 5, question 4: The table shows the marks obtained by 10 students in spelling tests in January and February. Mark in January 26 53 50 48 30 66 70 44 37 38 Mark in February 42 5
  9. Q1

    November 2020 · Paper 6

    The whole paper ↗
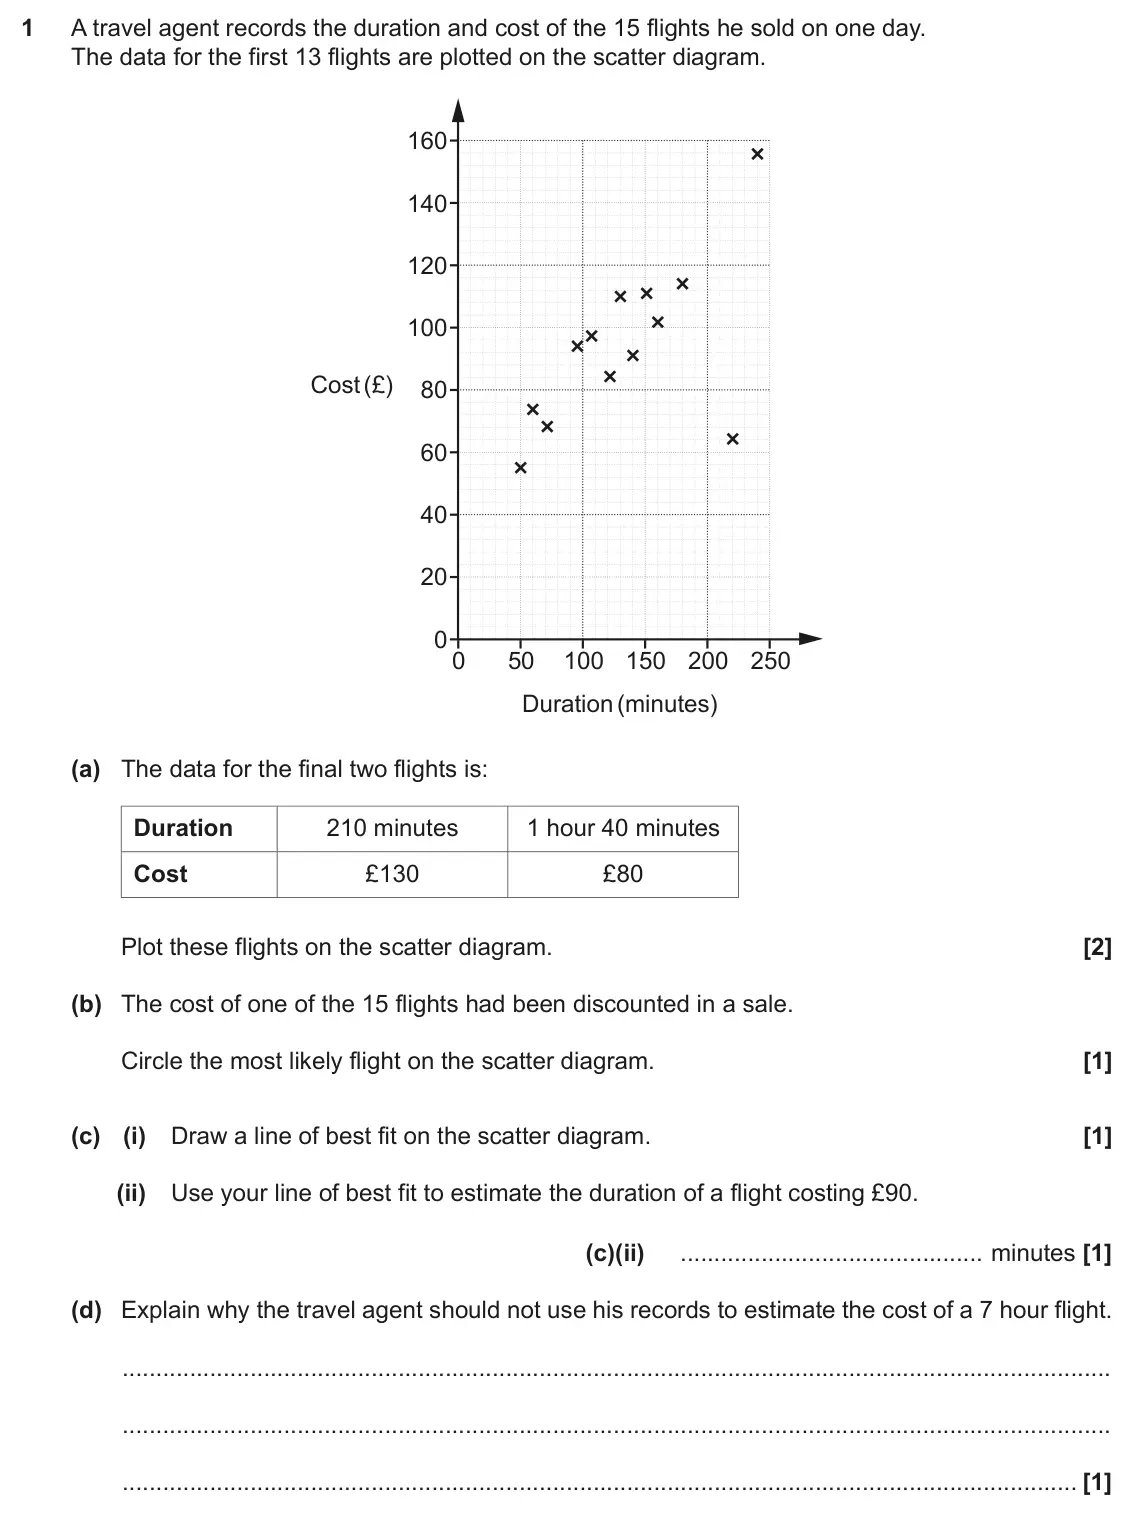
    November 2020 Paper 6, question 1: A travel agent records the duration and cost of the 15 flights he sold on one day. The data for the first 13 flights are plotted on the scatter diagram. 160 140
  10. Q7

    November 2019 · Paper 4

    The whole paper ↗
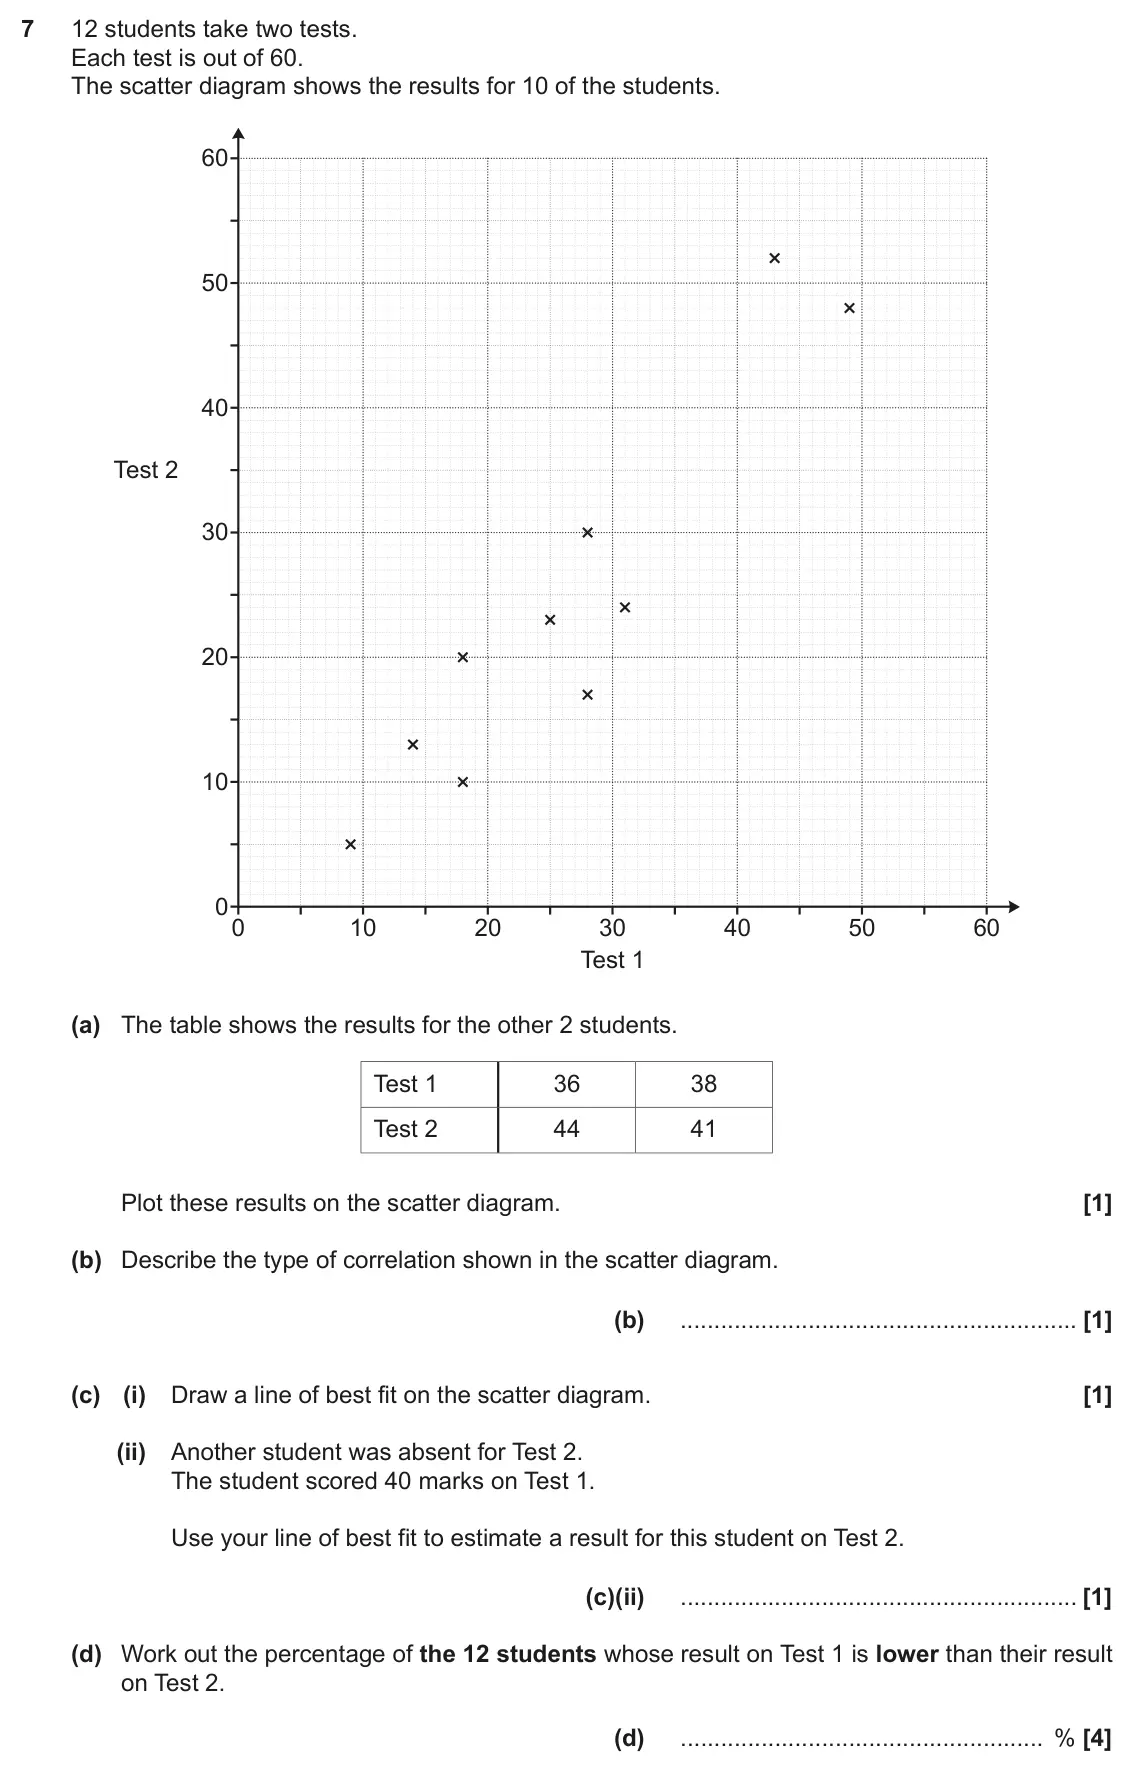
    November 2019 Paper 4, question 7: 12 students take two tests. Each test is out of 60. The scatter diagram shows the results for 10 of the students. 60 50 40 Test 2 30 20 10 0 0 10 20 30 40 50 60
  11. Q5

    June 2019 · Paper 5

    The whole paper ↗
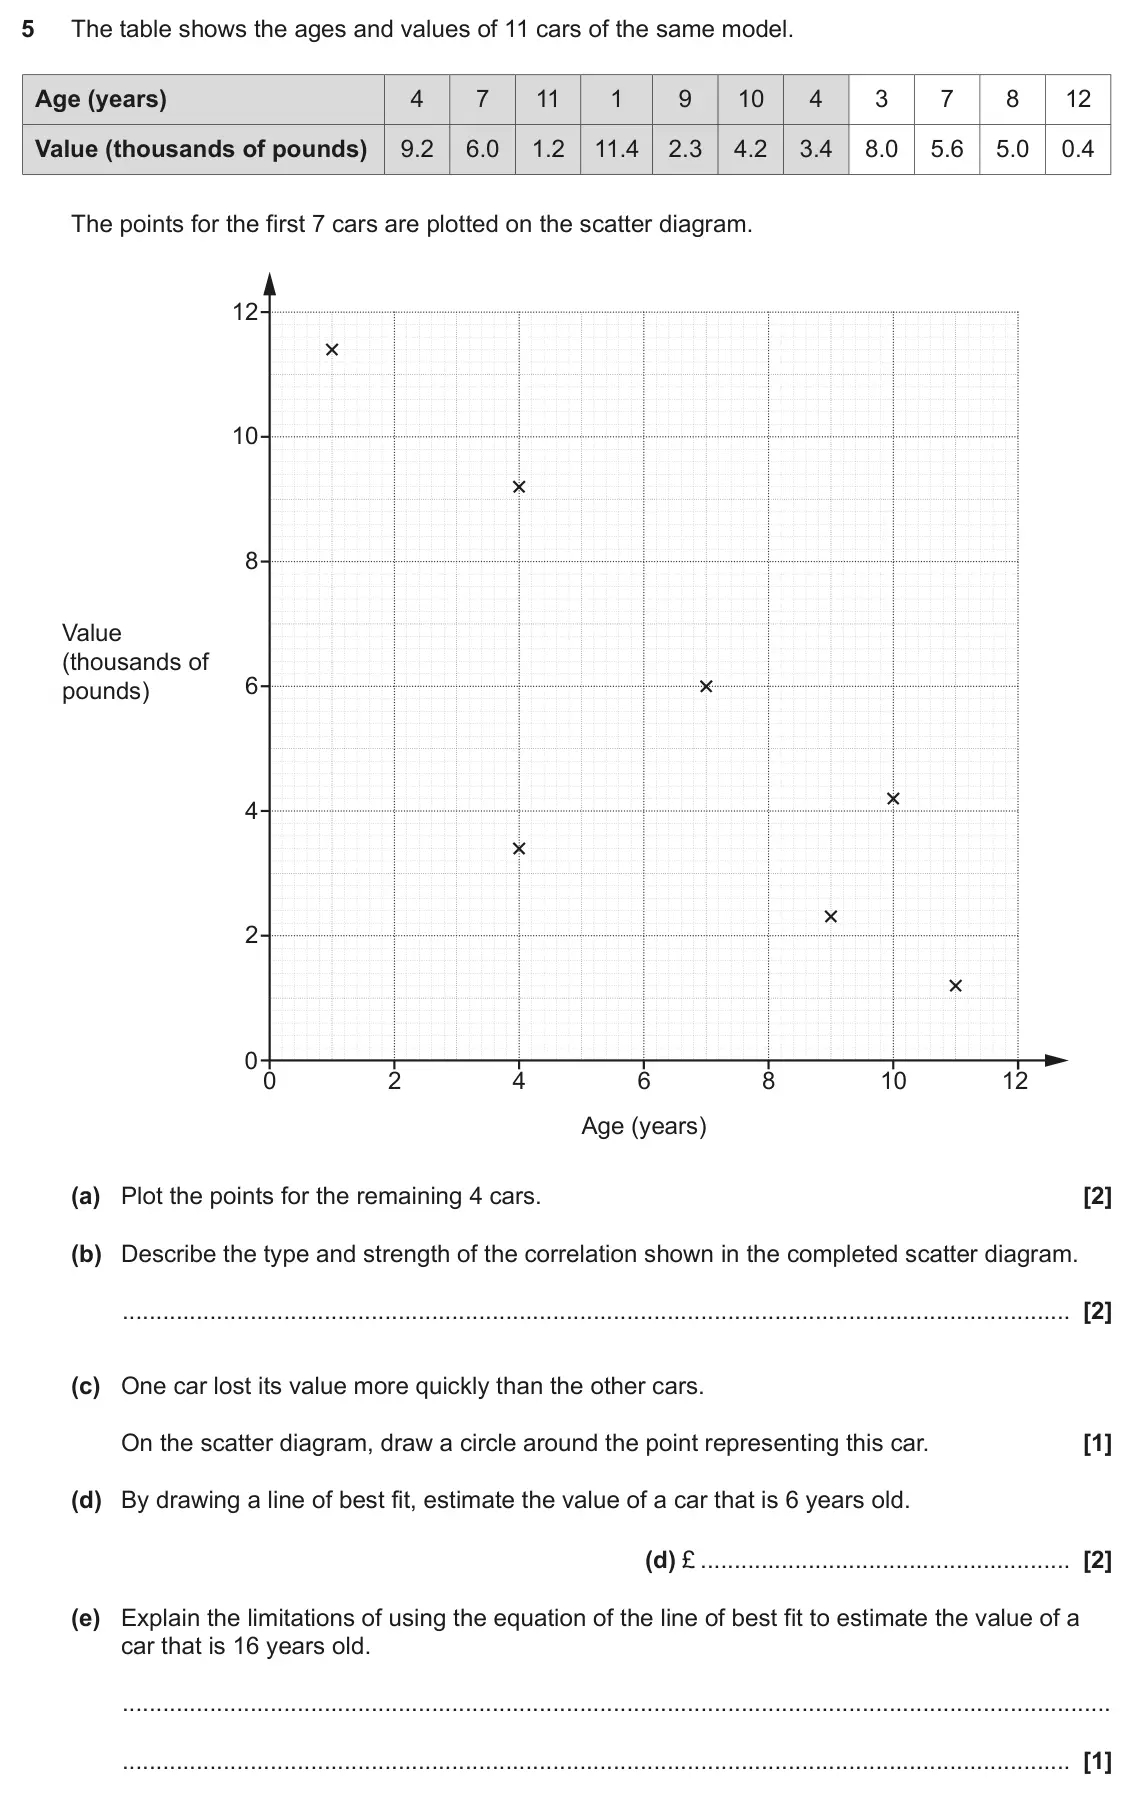
    June 2019 Paper 5, question 5: The table shows the ages and values of 11 cars of the same model. Age (years) 4 7 11 1 9 10 4 3 7 8 12 Value (thousands of pounds) 9.2 6.0 1.2 11.4 2.3 4.2 3.4
  12. Q1

    November 2018 · Paper 6

    The whole paper ↗
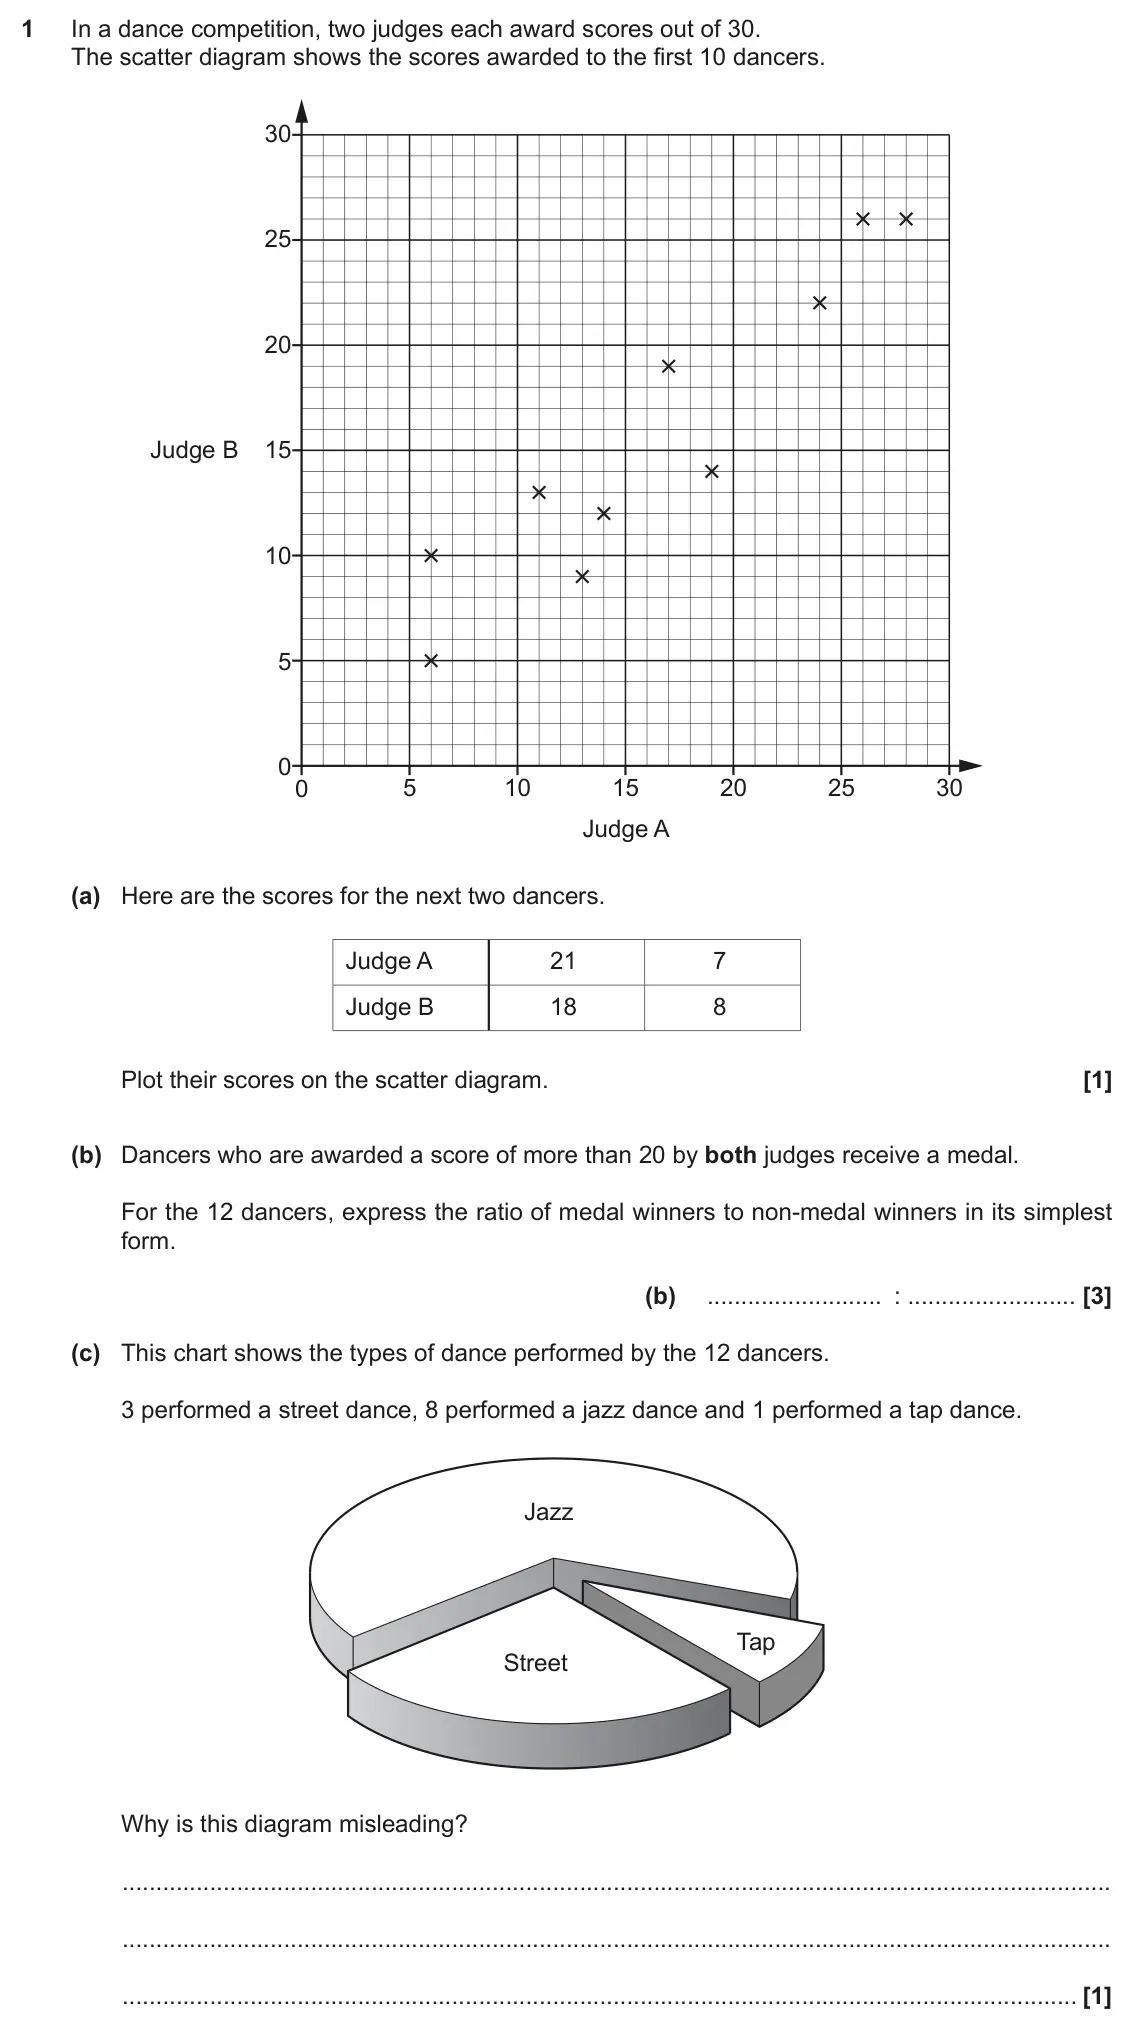
    November 2018 Paper 6, question 1: In a dance competition, two judges each award scores out of 30. The scatter diagram shows the scores awarded to the first 10 dancers. 30 25 20 Judge B 15 10 5 0
  13. Q4

    June 2018 · Paper 4

    The whole paper ↗
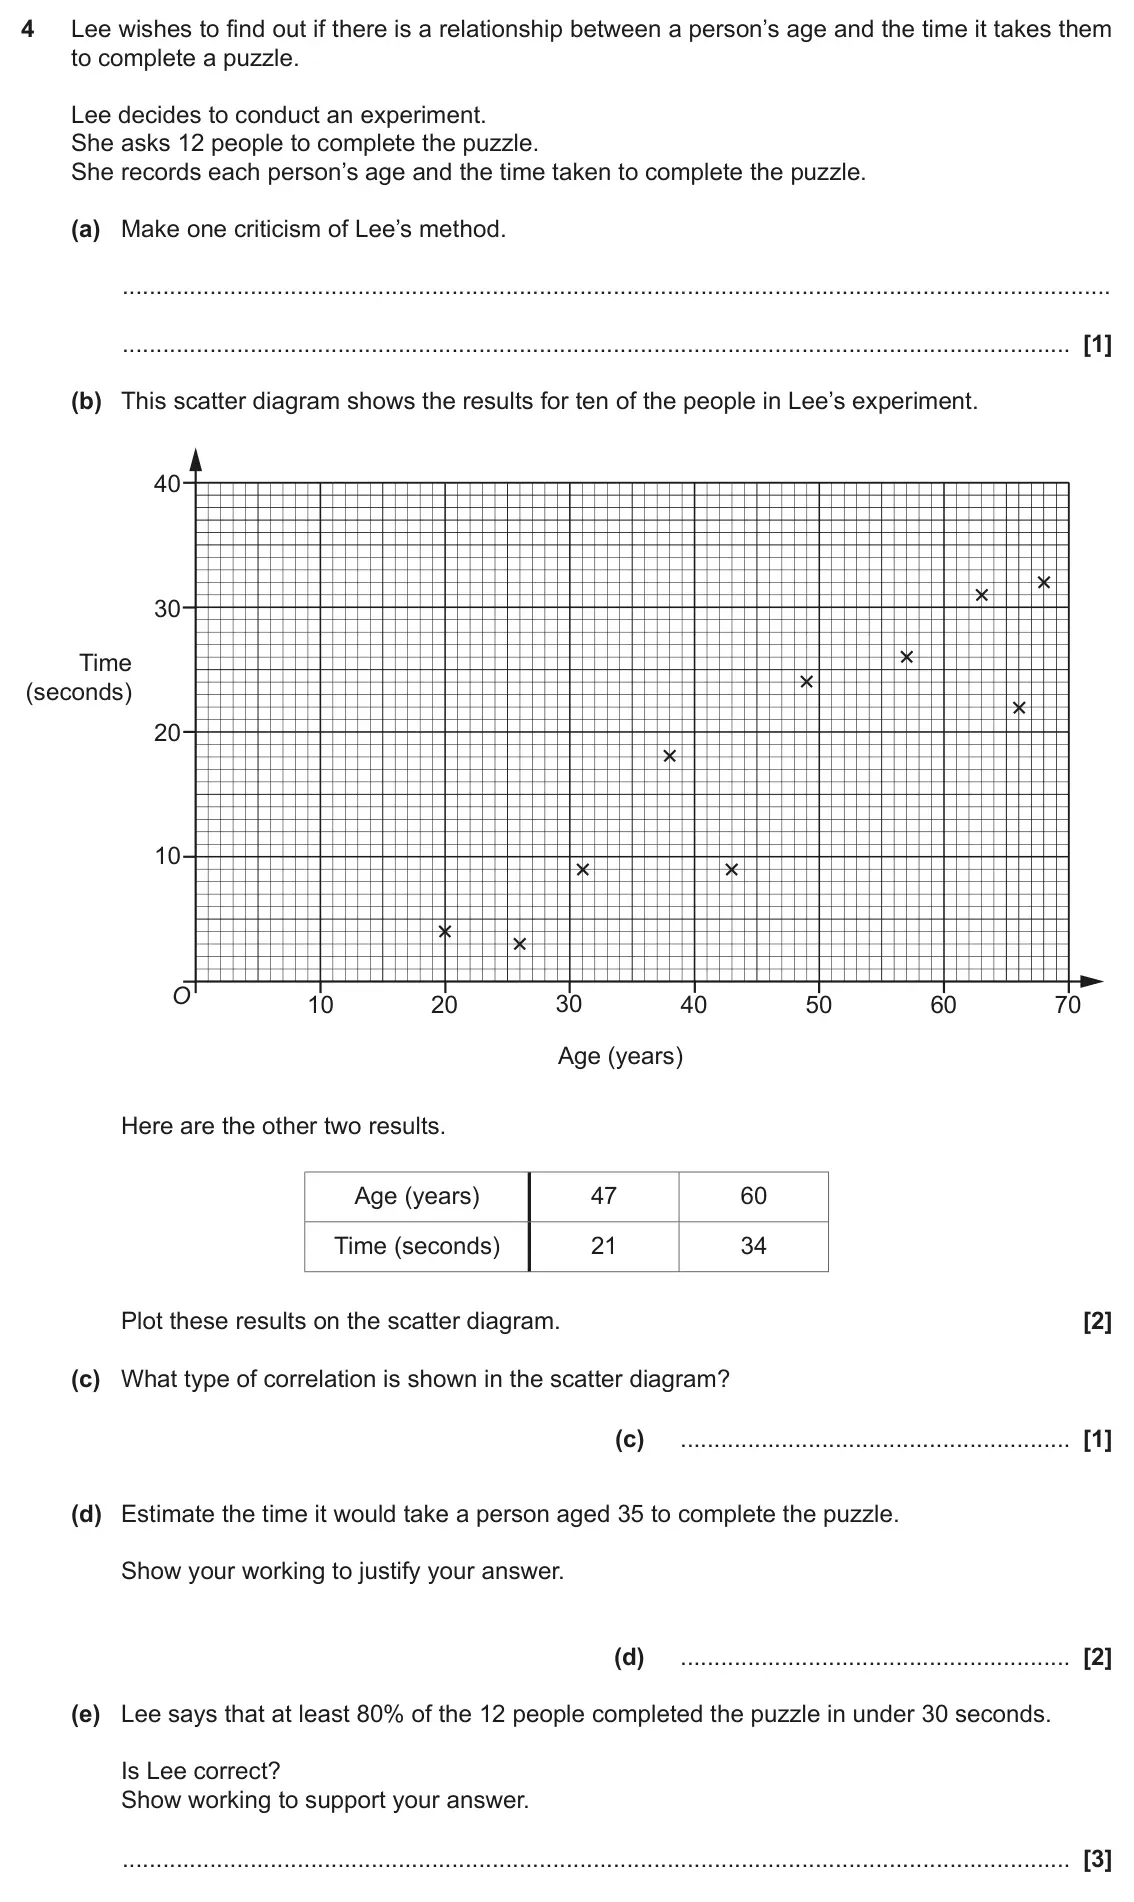
    June 2018 Paper 4, question 4: Lee wishes to find out if there is a relationship between a person’s age and the time it takes them to complete a puzzle. Lee decides to conduct an experiment.
  14. Q4

    November 2017 · Paper 4

    The whole paper ↗
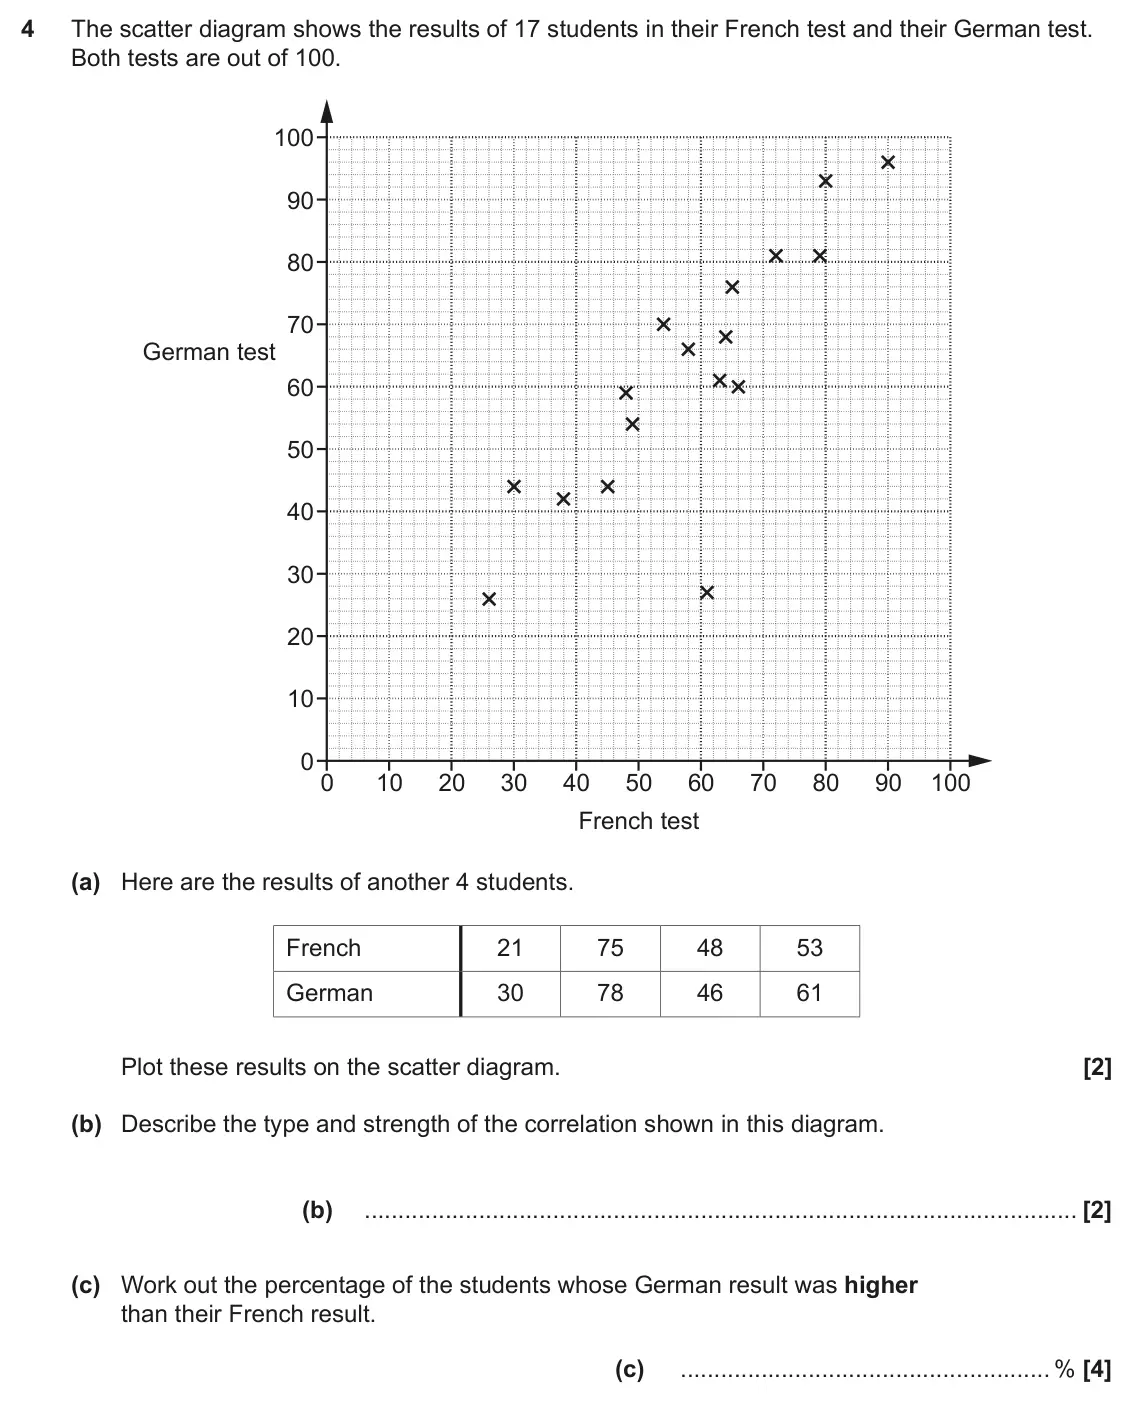
    November 2017 Paper 4, question 4: The scatter diagram shows the results of 17 students in their French test and their German test. Both tests are out of 100. 100 90 80 70 German test 60 50 40 30
  15. Q3

    June 2017 · Paper 6

    The whole paper ↗
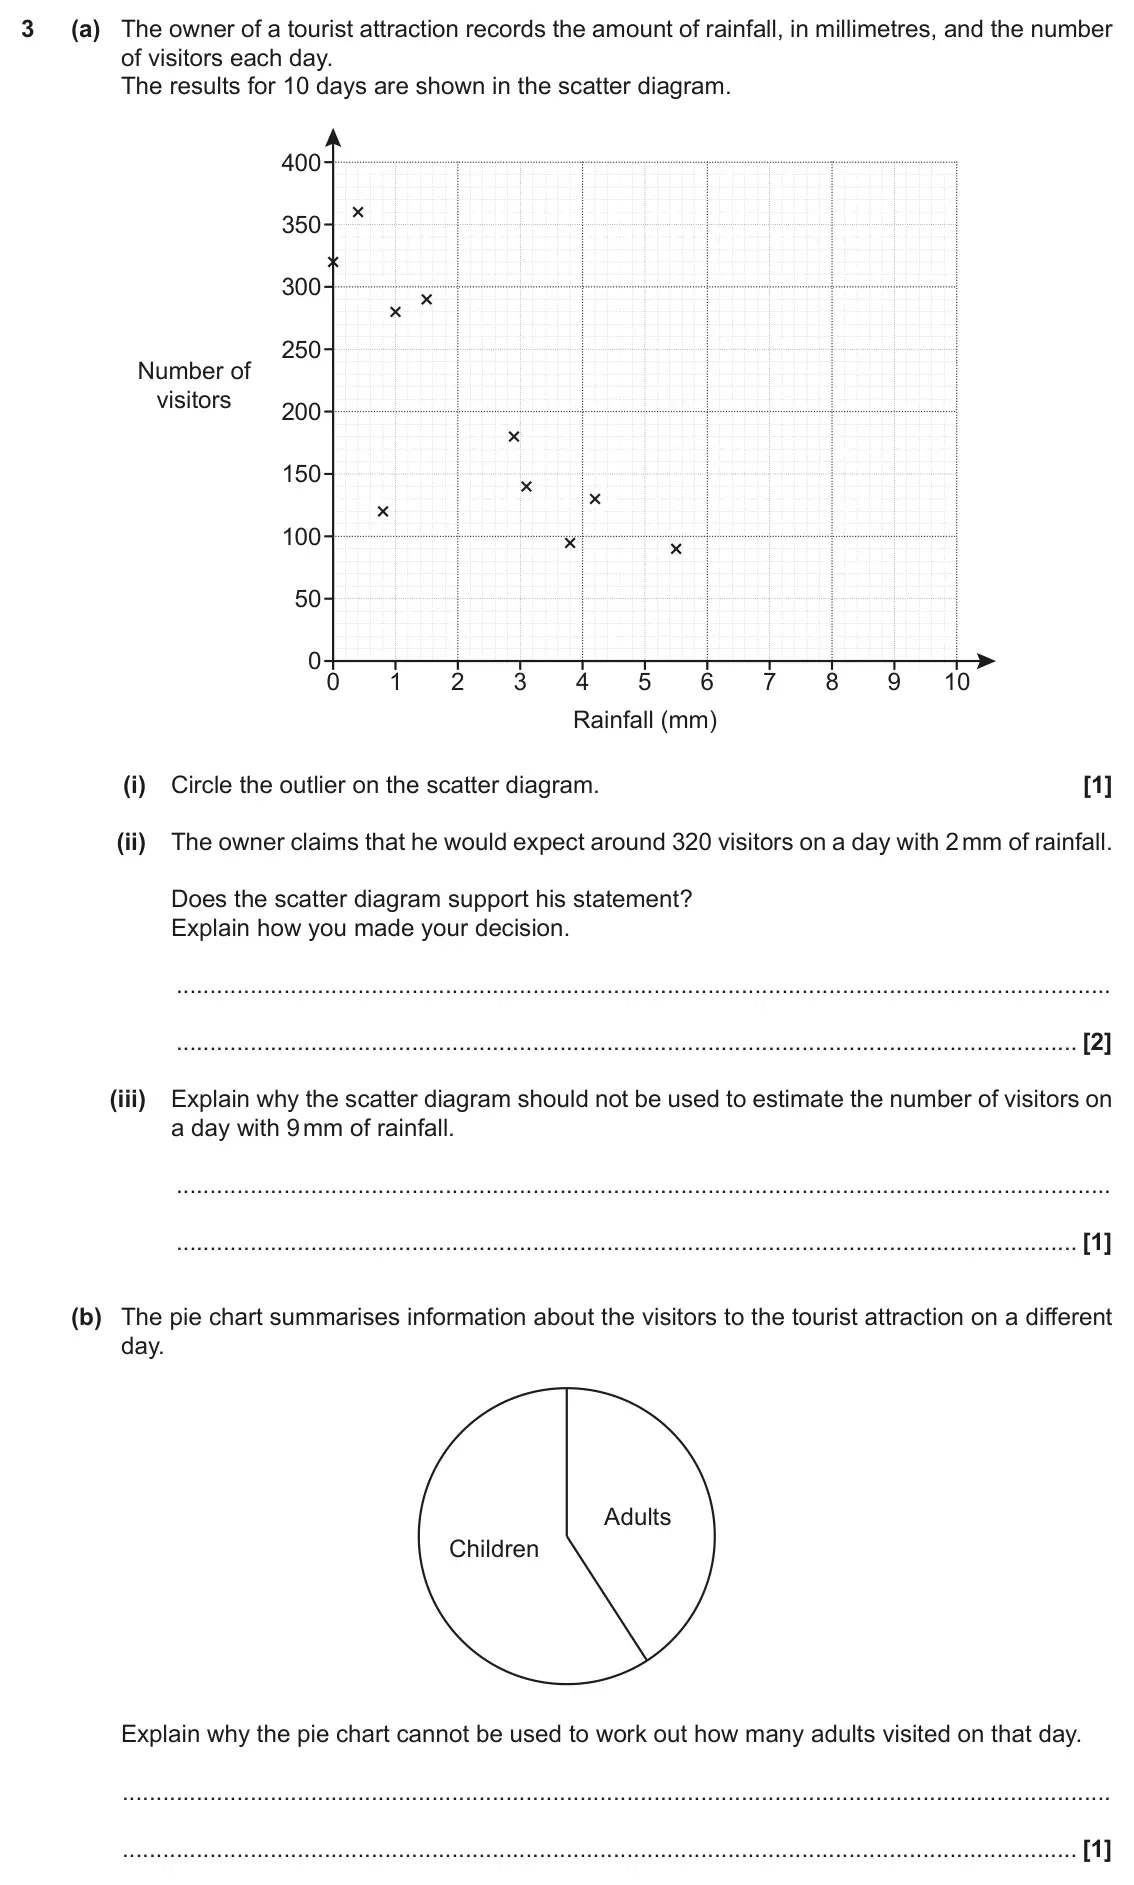
    June 2017 Paper 6, question 3: (a) The owner of a tourist attraction records the amount of rainfall, in millimetres, and the number of visitors each day. The results for 10 days are shown in
All 15 questions on Scatter graphs and correlation, as a list
  1. June 2025, Paper 4, Q4 (4 marks): (a) Describe the correlation shown in each of these scatter diagrams. (b) A theatre records the number of seats sold and the profit made for 10 performances. Th
  2. November 2024, Paper 4, Q4 (8 marks): Each week the manager of a petrol station records the average daily sales, in litres, and the average price, in pounds, of a litre of petrol for that week. The
  3. June 2024, Paper 5, Q4 (8 marks): The scatter diagram shows the test scores for 20 pupils in Science and Mathematics. 60 50 40 Mathematics 30 20 10 0 0 10 20 30 40 50 60 Science (a) Describe the
  4. November 2023, Paper 6, Q1 (7 marks): Beth completes some jigsaw puzzles and records the following information. • The number of pieces in the jigsaw puzzle. • The time taken to complete the jigsaw p
  5. June 2023, Paper 5, Q5 (8 marks): The table shows the ages and heights of 12 children. Age (years) 2 4 12 6 10 11 13 11 5 7 9 14 Height (m) 0.84 1.01 1.5 1.4 1.4 1.35 1.62 1.42 1.14 1.24 1.26 1.
  6. November 2022, Paper 6, Q6 (5 marks): The scatter diagram shows the number of visitors to a children’s playground and the maximum temperature on fifteen Saturdays in summer. 120 100 80 Number 60 of
  7. June 2022, Paper 4, Q5 (10 marks): The scatter diagram shows the midday temperature at 13 different heights on a mountain. 12 11 10 9 8 7 Temp. (°C) 6 5 4 3 2 1 0 300 400 500 600 700 800 900 1000
  8. November 2021, Paper 5, Q4 (8 marks): The table shows the marks obtained by 10 students in spelling tests in January and February. Mark in January 26 53 50 48 30 66 70 44 37 38 Mark in February 42 5
  9. November 2020, Paper 6, Q1 (6 marks): A travel agent records the duration and cost of the 15 flights he sold on one day. The data for the first 13 flights are plotted on the scatter diagram. 160 140
  10. November 2019, Paper 4, Q7 (8 marks): 12 students take two tests. Each test is out of 60. The scatter diagram shows the results for 10 of the students. 60 50 40 Test 2 30 20 10 0 0 10 20 30 40 50 60
  11. June 2019, Paper 5, Q5 (8 marks): The table shows the ages and values of 11 cars of the same model. Age (years) 4 7 11 1 9 10 4 3 7 8 12 Value (thousands of pounds) 9.2 6.0 1.2 11.4 2.3 4.2 3.4
  12. November 2018, Paper 6, Q1 (5 marks): In a dance competition, two judges each award scores out of 30. The scatter diagram shows the scores awarded to the first 10 dancers. 30 25 20 Judge B 15 10 5 0
  13. June 2018, Paper 4, Q4 (9 marks): Lee wishes to find out if there is a relationship between a person’s age and the time it takes them to complete a puzzle. Lee decides to conduct an experiment.
  14. November 2017, Paper 4, Q4 (8 marks): The scatter diagram shows the results of 17 students in their French test and their German test. Both tests are out of 100. 100 90 80 70 German test 60 50 40 30
  15. June 2017, Paper 6, Q3 (5 marks): (a) The owner of a tourist attraction records the amount of rainfall, in millimetres, and the number of visitors each day. The results for 10 days are shown in

Questions, mark schemes and examiner’s reports are © OCR, from their published past papers. Plumi isn’t affiliated with any exam board. Want whole papers? Every OCR GCSE Maths paper.

Rather write your answers by hand on iPad? Plumi marks them against the same mark schemes.