 plumi
Histograms and cumulative frequency: OCR GCSE Maths questions
Every OCR GCSE Maths exam question on S3 Histograms and cumulative frequency, 2017–2025, with its mark scheme and examiner’s report.
Find questions921
Exam
All years
Calculator
All 23 questions on Histograms and cumulative frequency, as a list
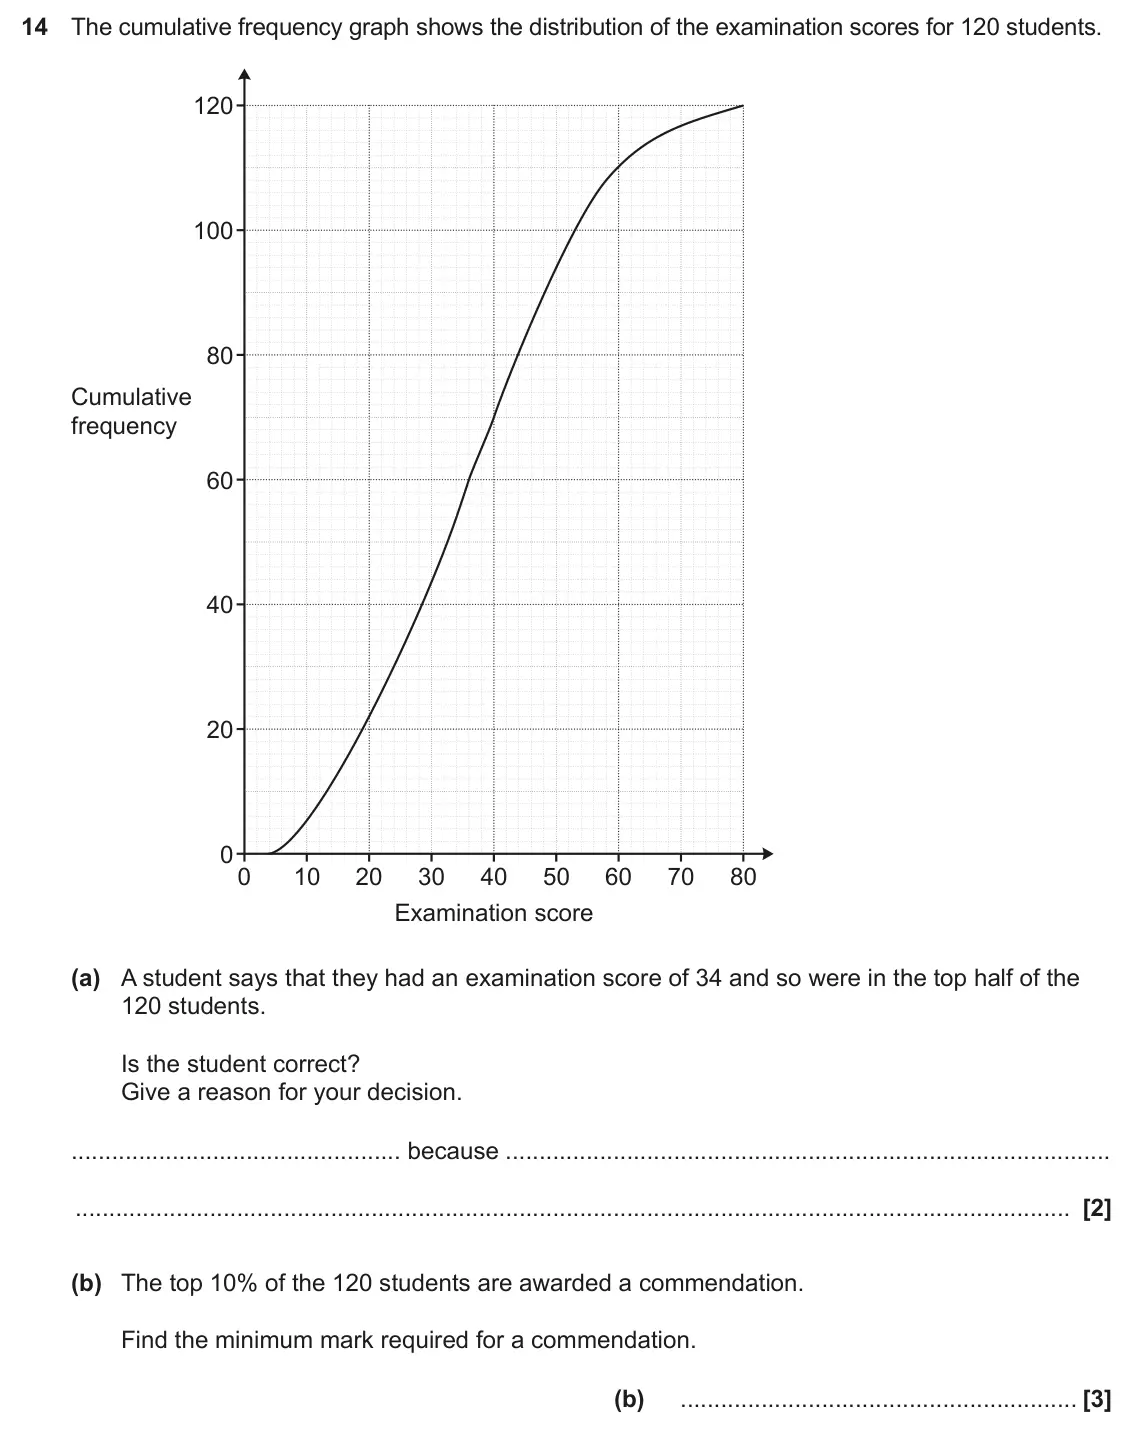
- June 2025, Paper 4, Q14 (5 marks): The cumulative frequency graph shows the distribution of the examination scores for 120 students. 120 100 80 Cumulative frequency 60 40 20 0 0 10 20 30 40 50 60
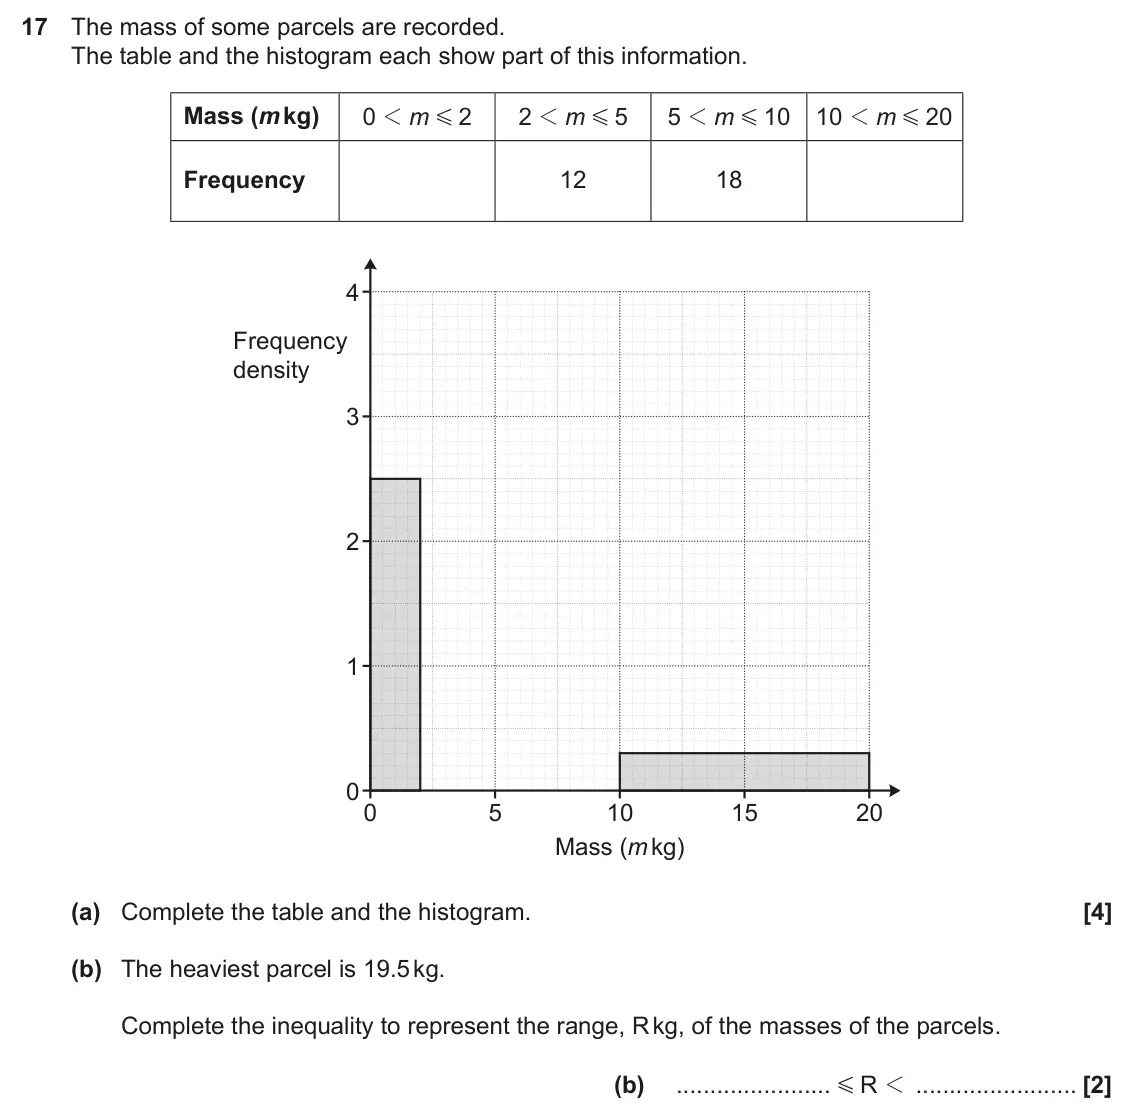
- June 2025, Paper 5, Q17 (6 marks): The mass of some parcels are recorded. The table and the histogram each show part of this information. Mass (m kg) 0 1 m 2 2 1 m 5 5 1 m 10 10 1 m 20 G G G G Fr
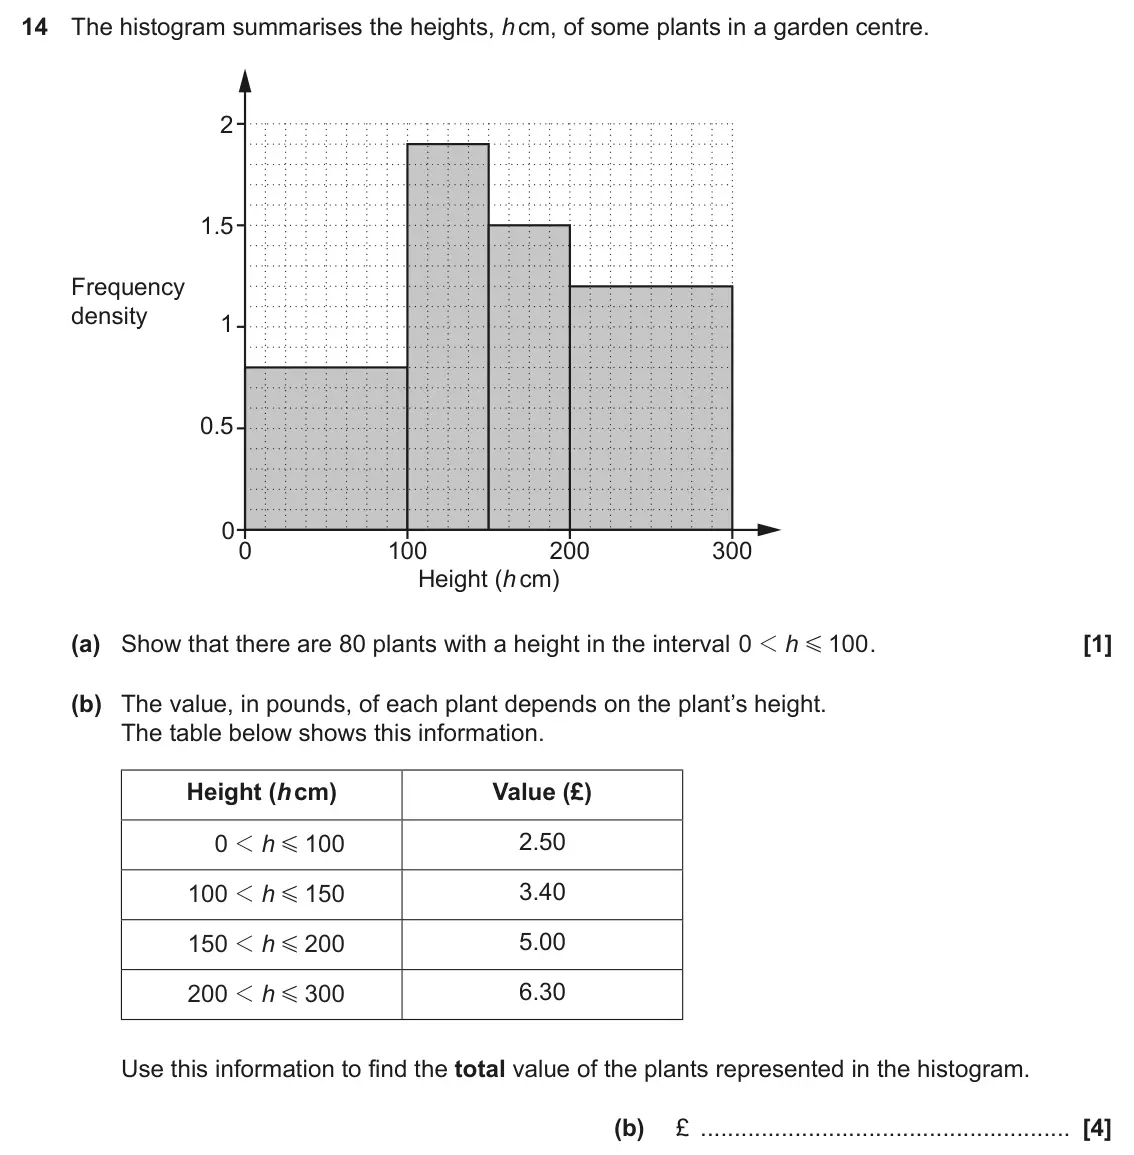
- November 2024, Paper 4, Q14 (5 marks): The histogram summarises the heights, h cm, of some plants in a garden centre. 2 1.5 Frequency density 1 0.5 0 0 100 200 300 Height (h cm) (a) Show that there a
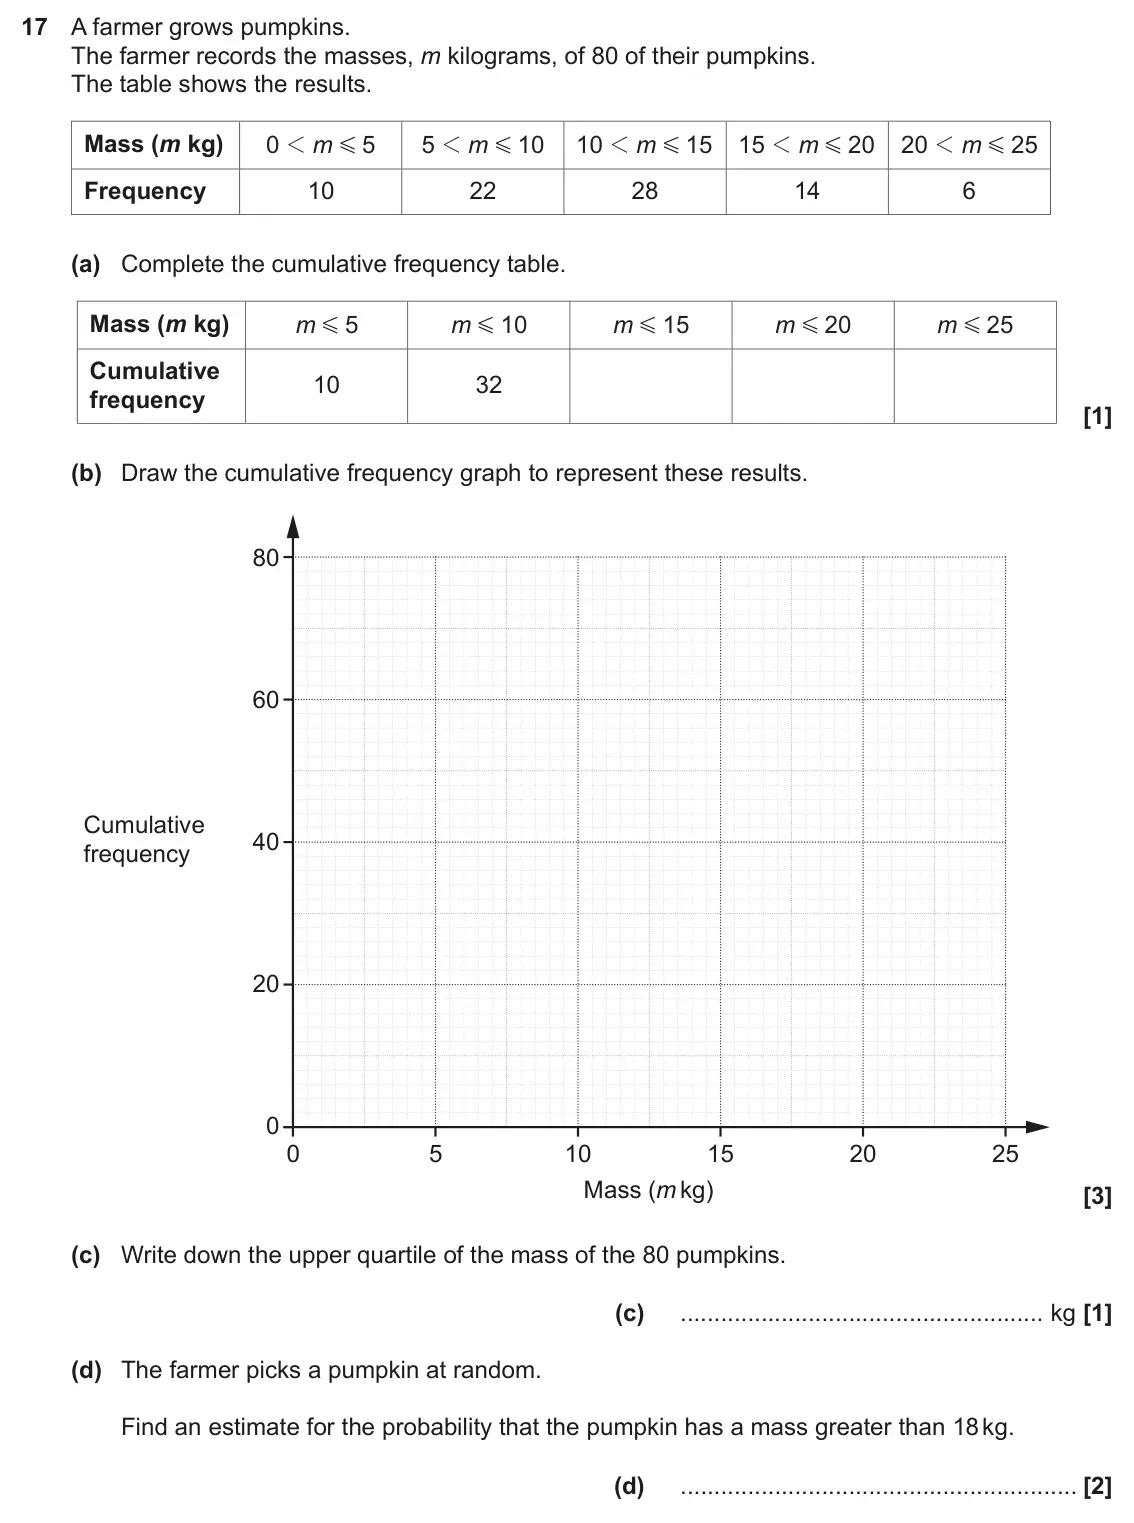
- November 2024, Paper 5, Q17 (7 marks): A farmer grows pumpkins. The farmer records the masses, m kilograms, of 80 of their pumpkins. The table shows the results. Mass (m kg) 0 1 m 5 5 1 m 10 1 0 1 m
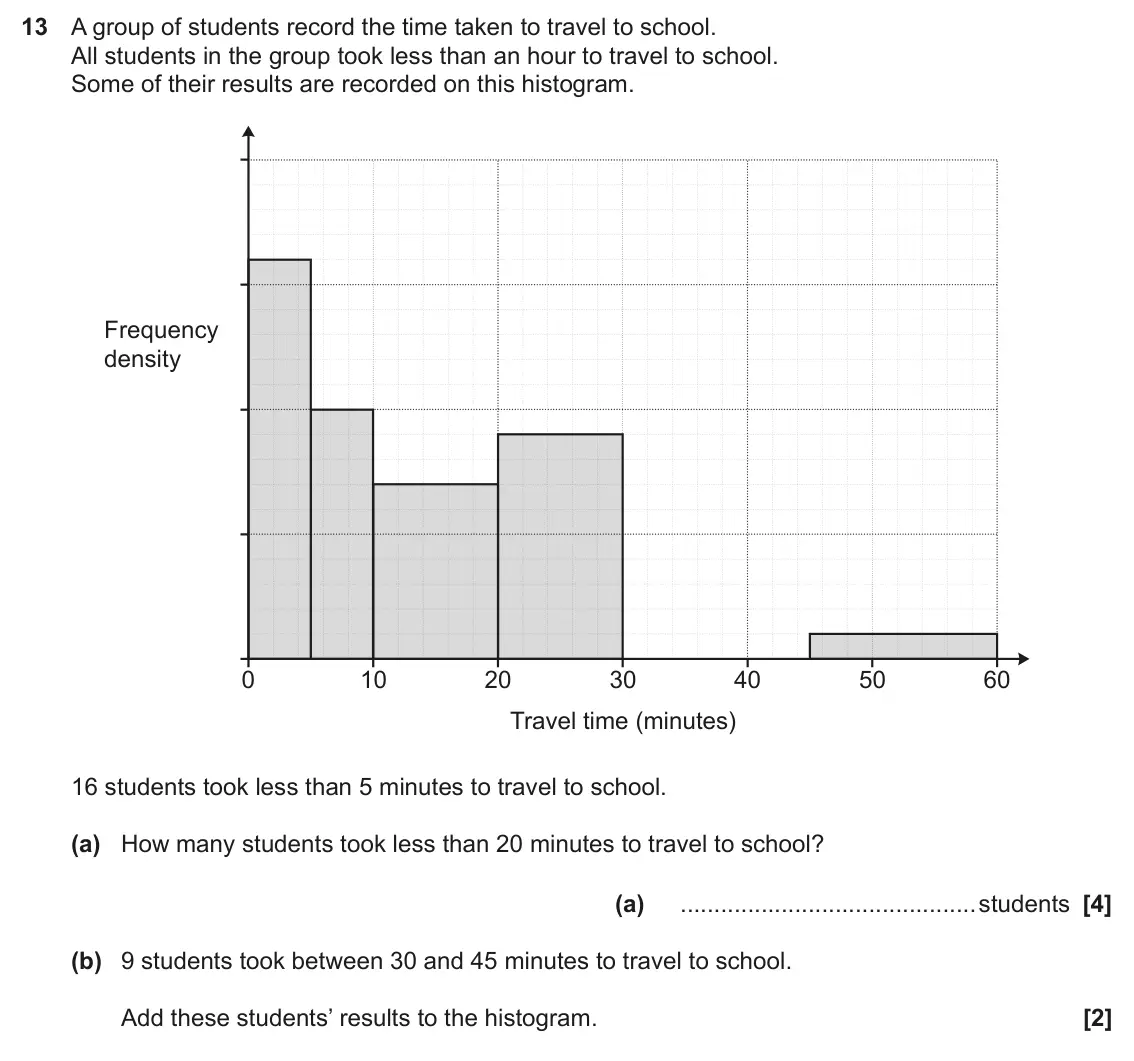
- June 2024, Paper 6, Q13 (6 marks): A group of students record the time taken to travel to school. All students in the group took less than an hour to travel to school. Some of their results are r
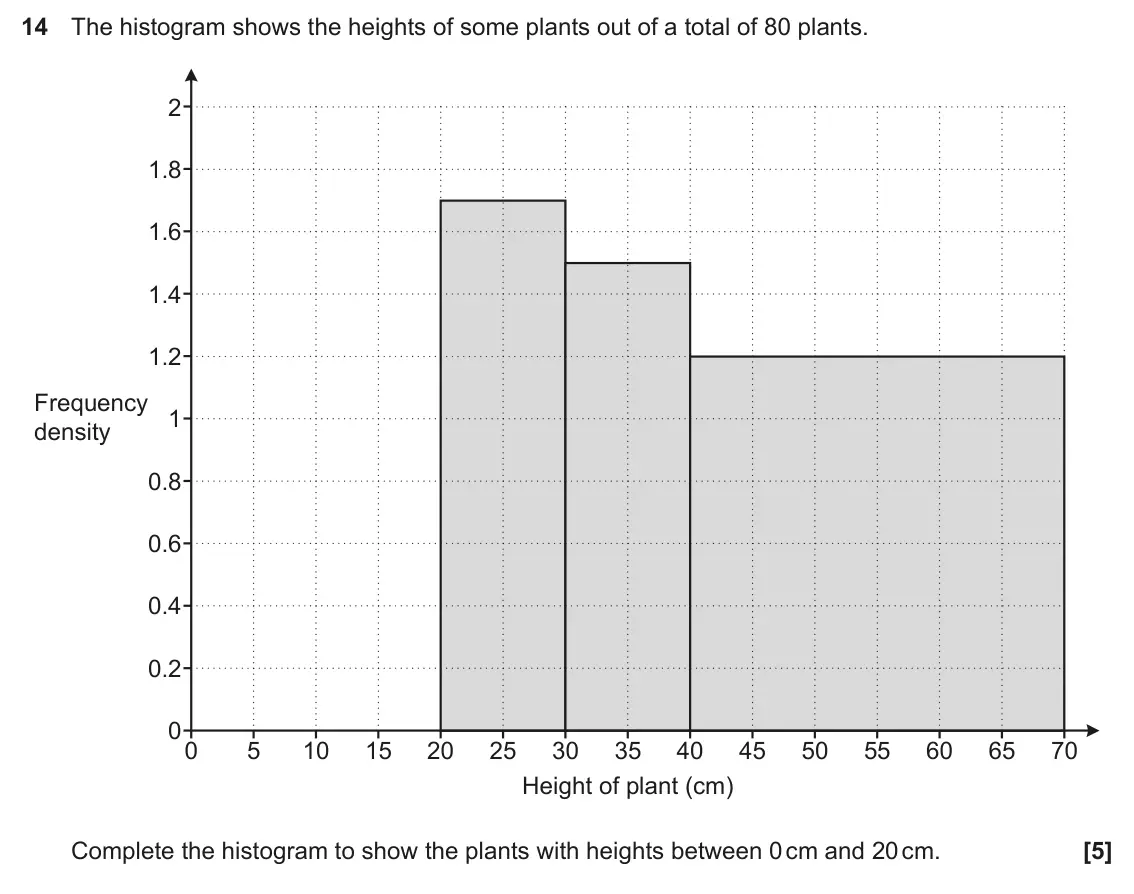
- November 2023, Paper 4, Q14 (5 marks): The histogram shows the heights of some plants out of a total of 80 plants. 2 1.8 1.6 1.4 1.2 Frequency 1 density 0.8 0.6 0.4 0.2 0 0 5 10 15 20 25 30 35 40 45
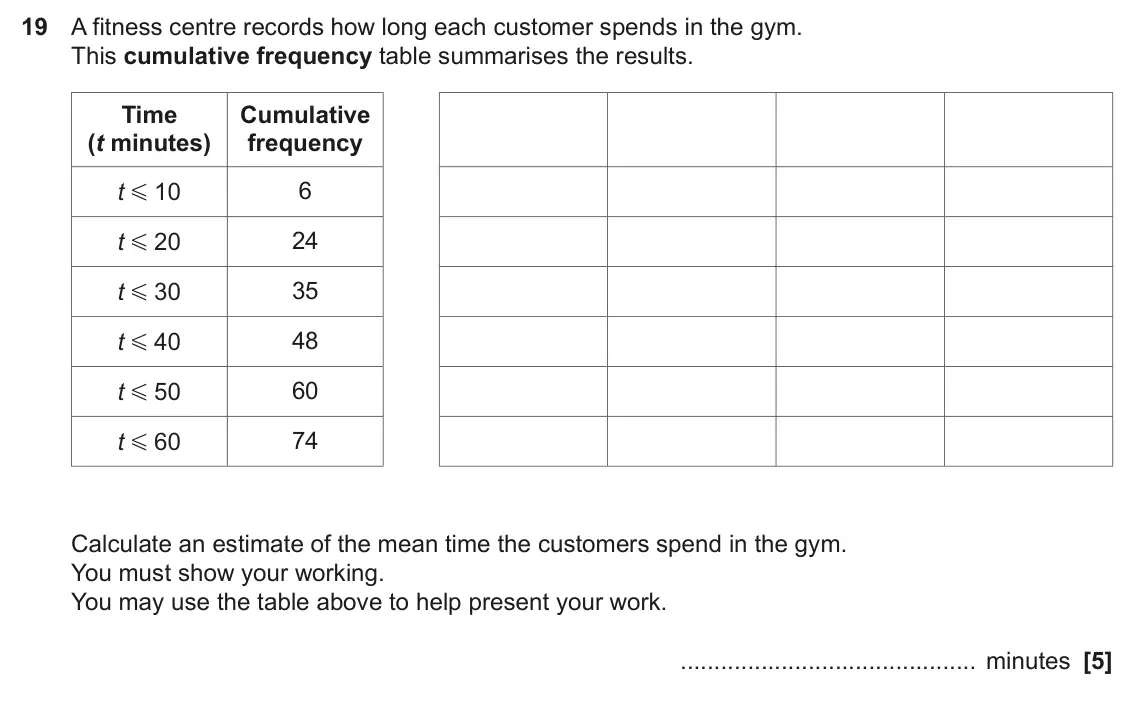
- November 2023, Paper 6, Q19 (5 marks): A fitness centre records how long each customer spends in the gym. This cumulative frequency table summarises the results. Time Cumulative (t minutes) frequency
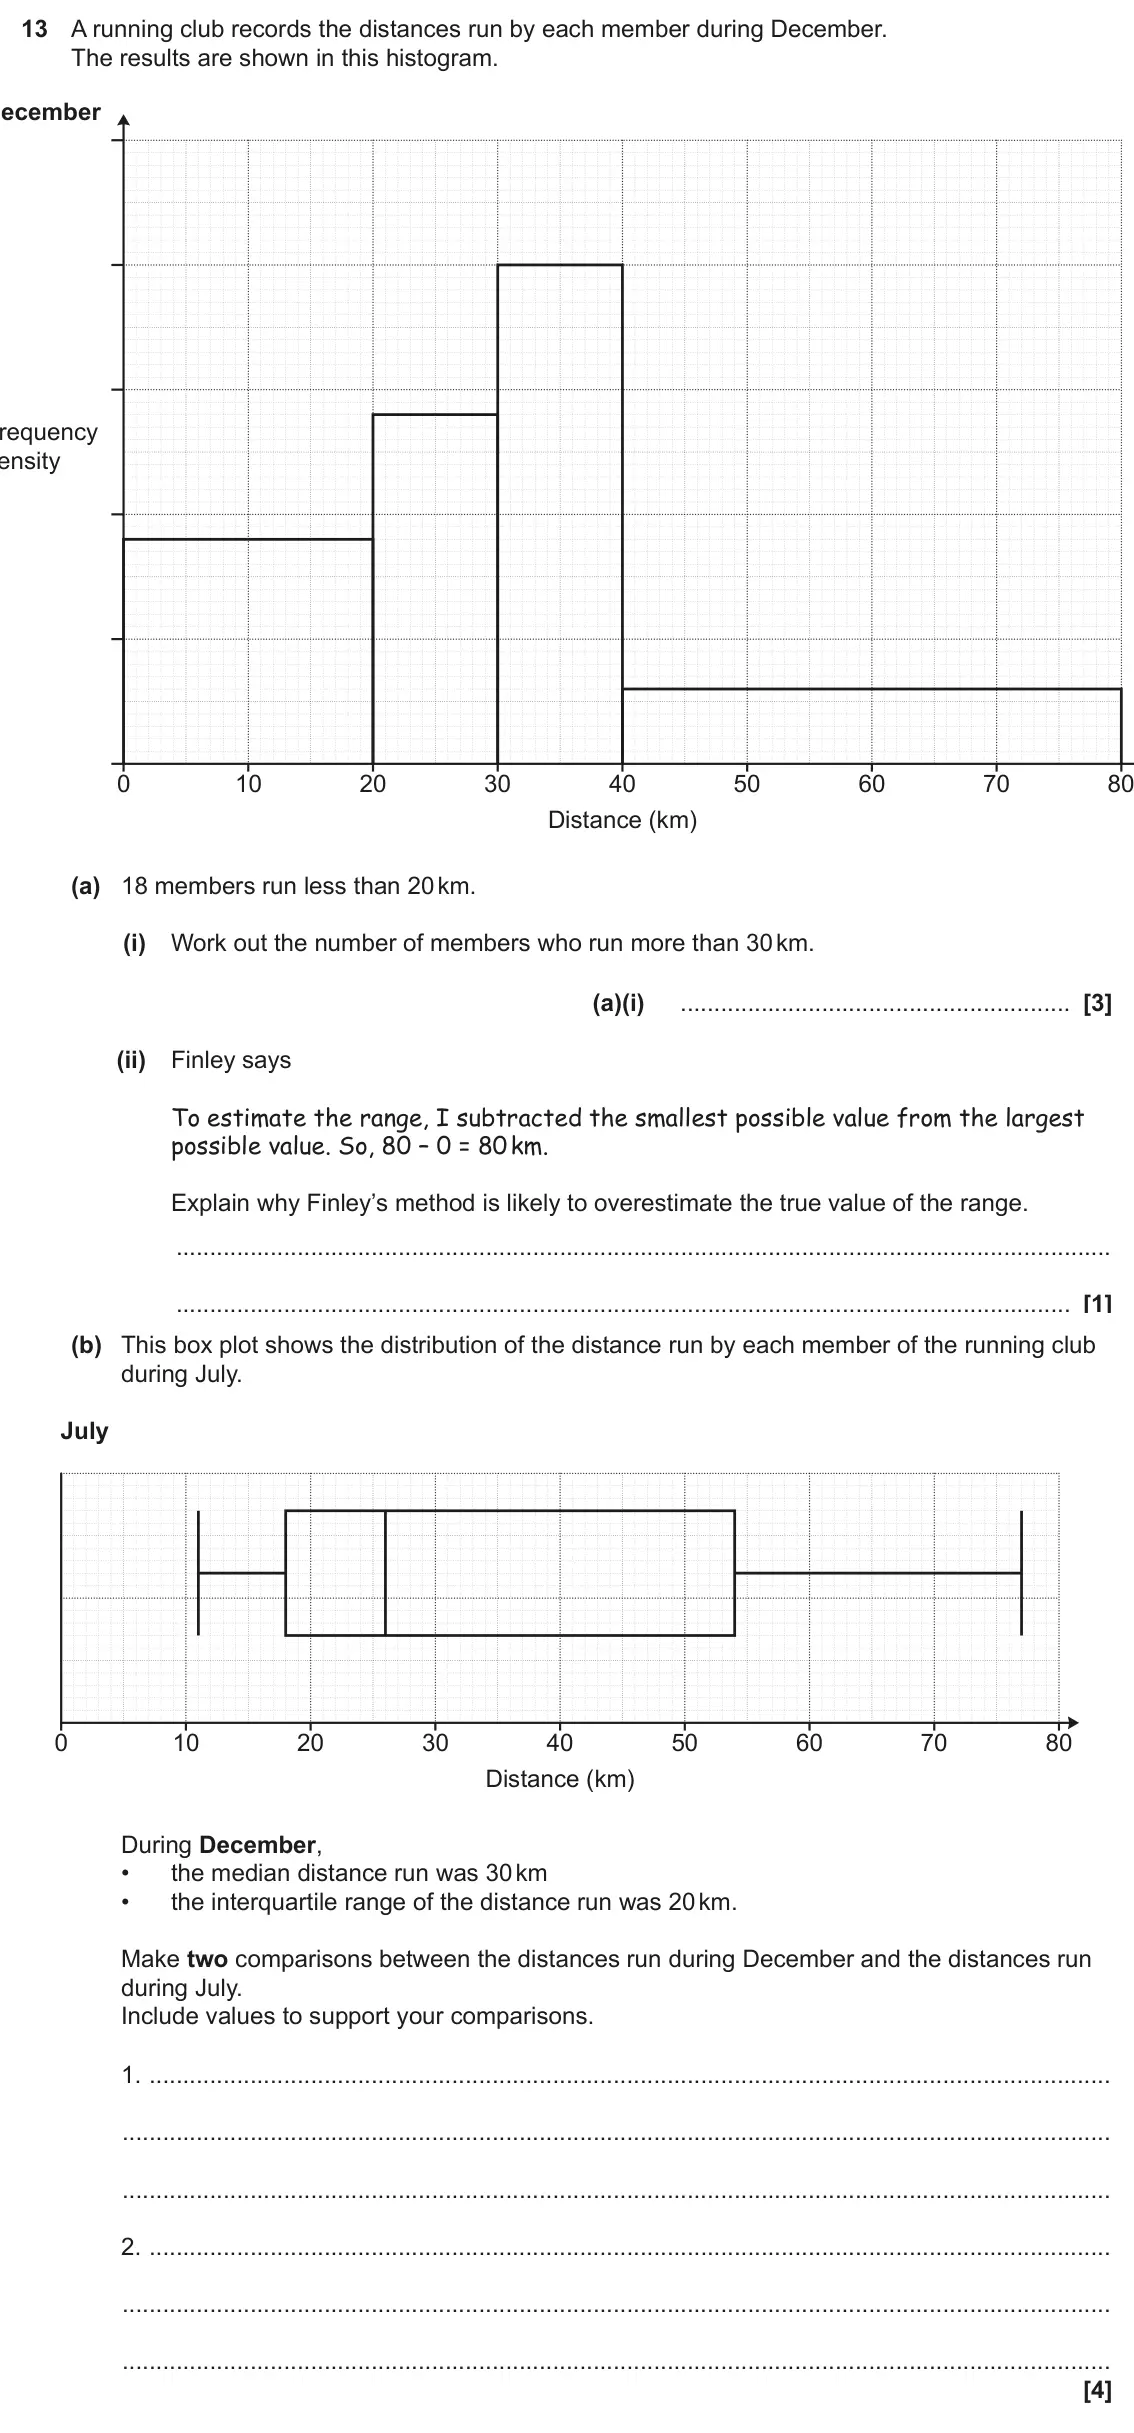
- June 2023, Paper 6, Q13 (8 marks): A running club records the distances run by each member during December. The results are shown in this histogram. December Frequency density 0 10 20 30 40 50 60
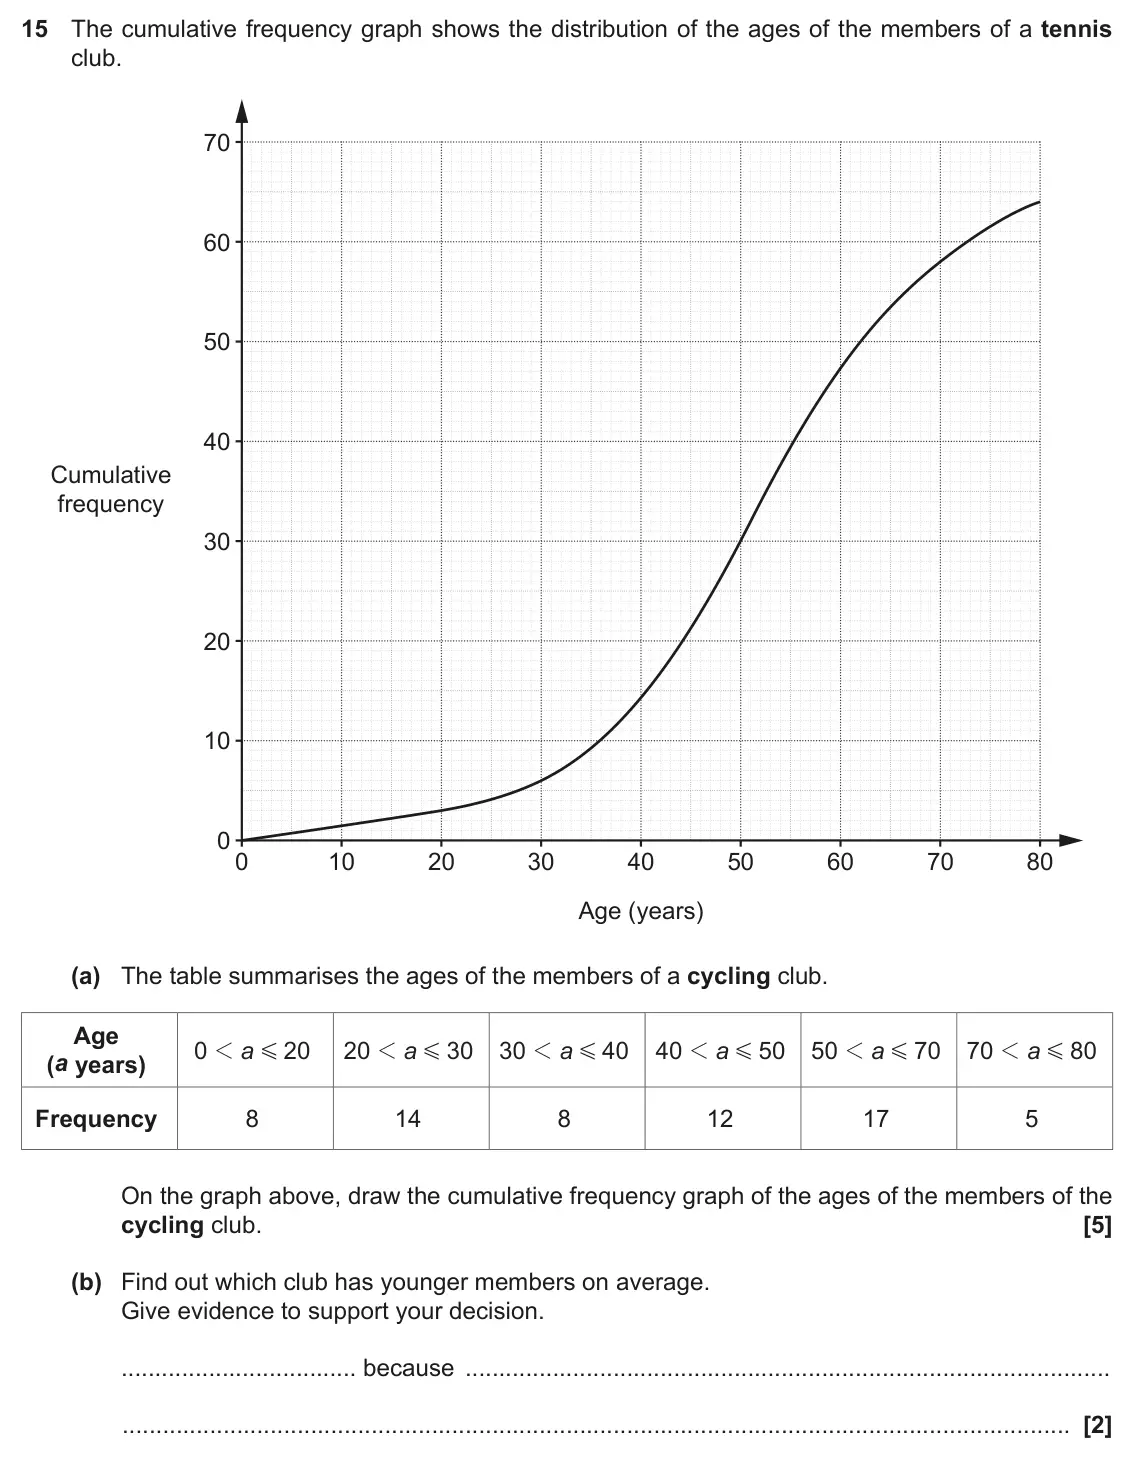
- November 2022, Paper 4, Q15 (7 marks): The cumulative frequency graph shows the distribution of the ages of the members of a tennis club. 70 60 50 40 Cumulative frequency 30 20 10 0 0 10 20 30 40 50
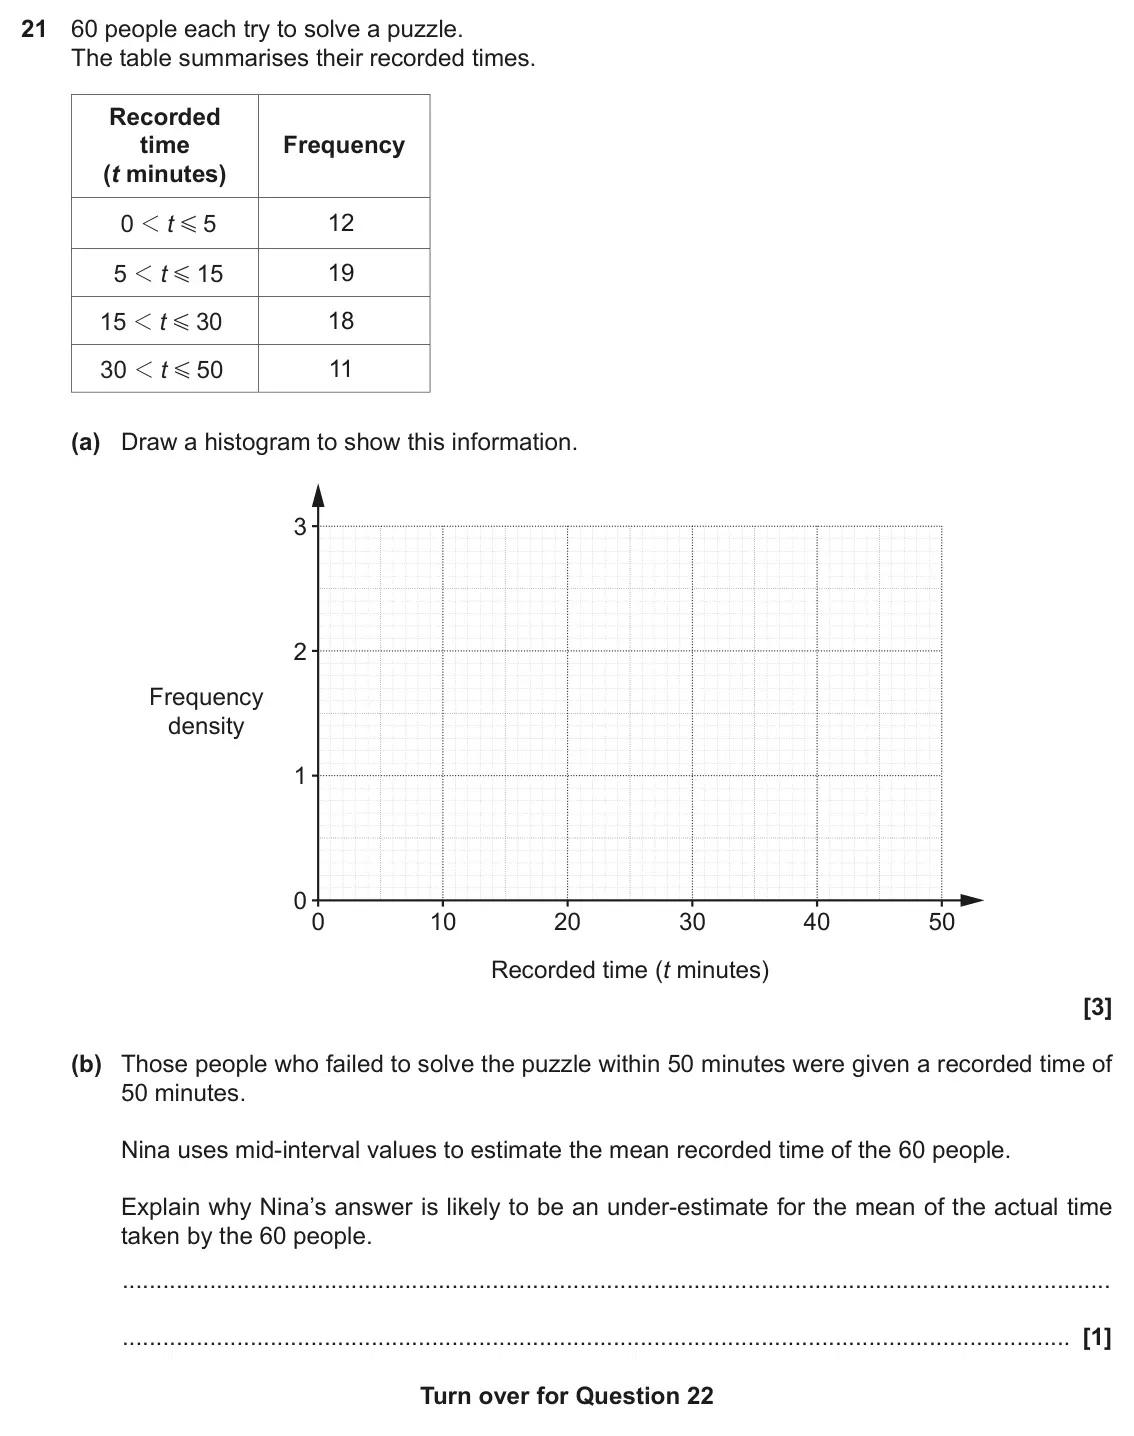
- November 2022, Paper 4, Q21 (4 marks): 60 people each try to solve a puzzle. The table summarises their recorded times. Recorded time Frequency (t minutes) 12 0 1 t 5 G 5 1 5 19 1 t G 18 15 1 t 30 G
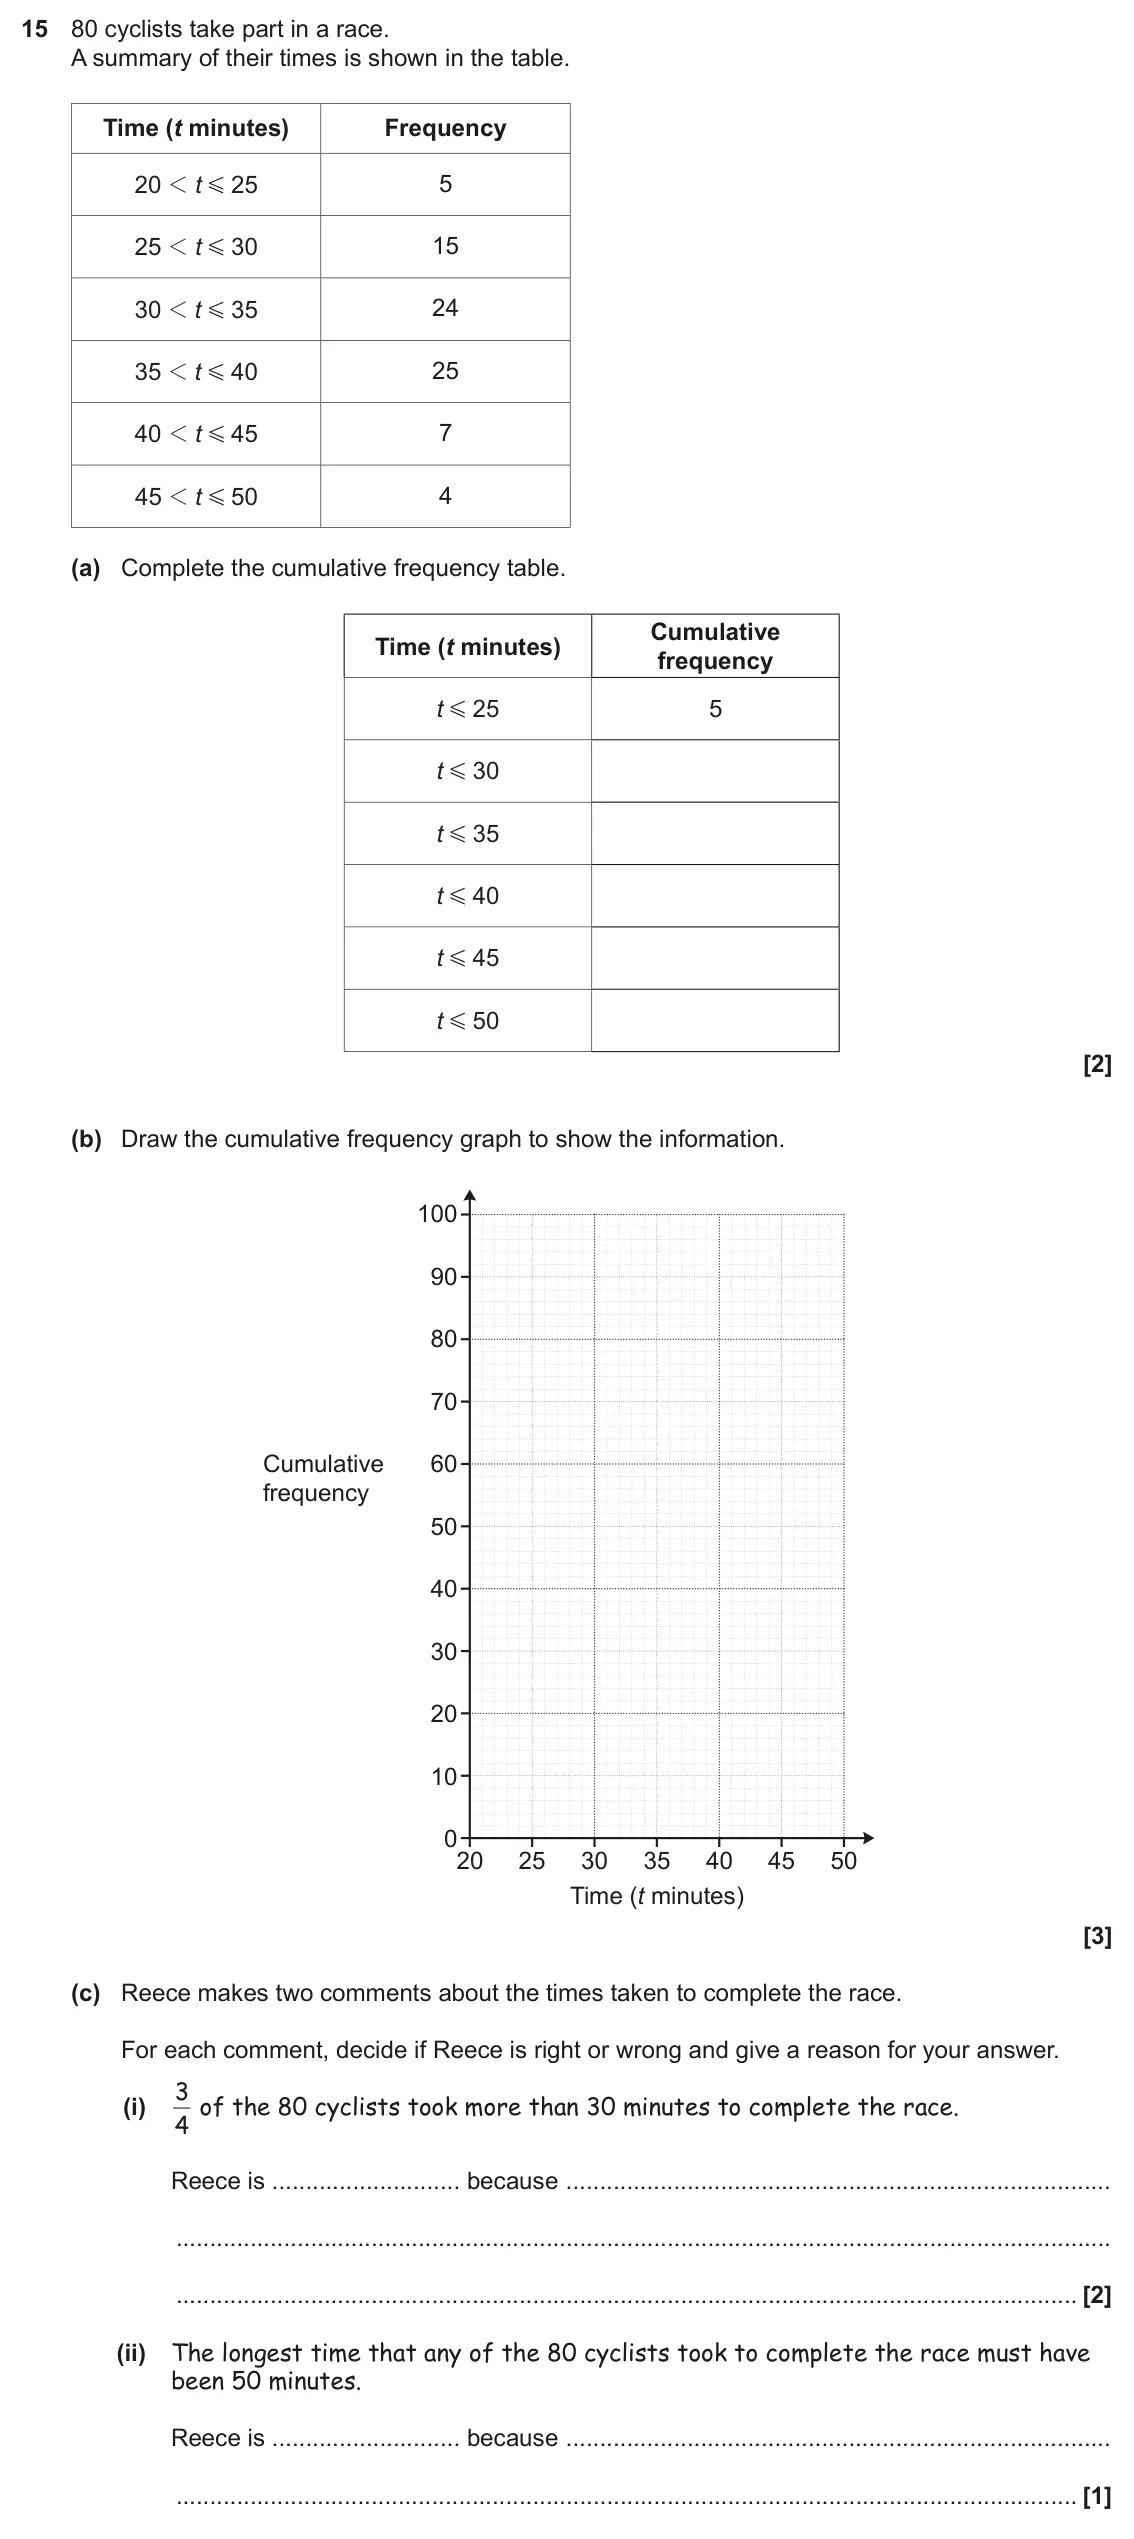
- June 2022, Paper 6, Q15 (8 marks): 80 cyclists take part in a race. A summary of their times is shown in the table. Time (t minutes) Frequency 5 20 1 t 25 G 15 25 1 t 30 G 3 0 35 24 1 t G 25 35 1
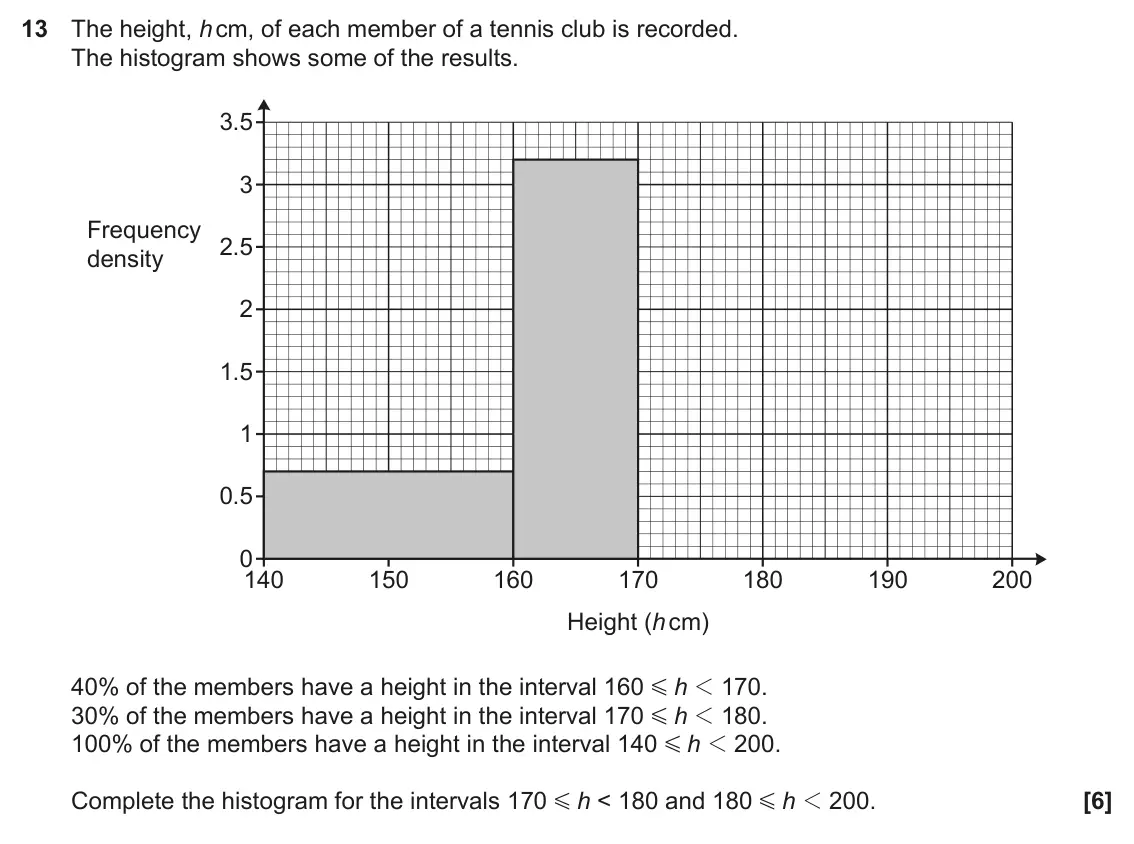
- November 2021, Paper 4, Q13 (6 marks): The height, h cm, of each member of a tennis club is recorded. The histogram shows some of the results. 3.5 3 Frequency 2.5 density 2 1.5 1 0.5 0 140 150 160 17
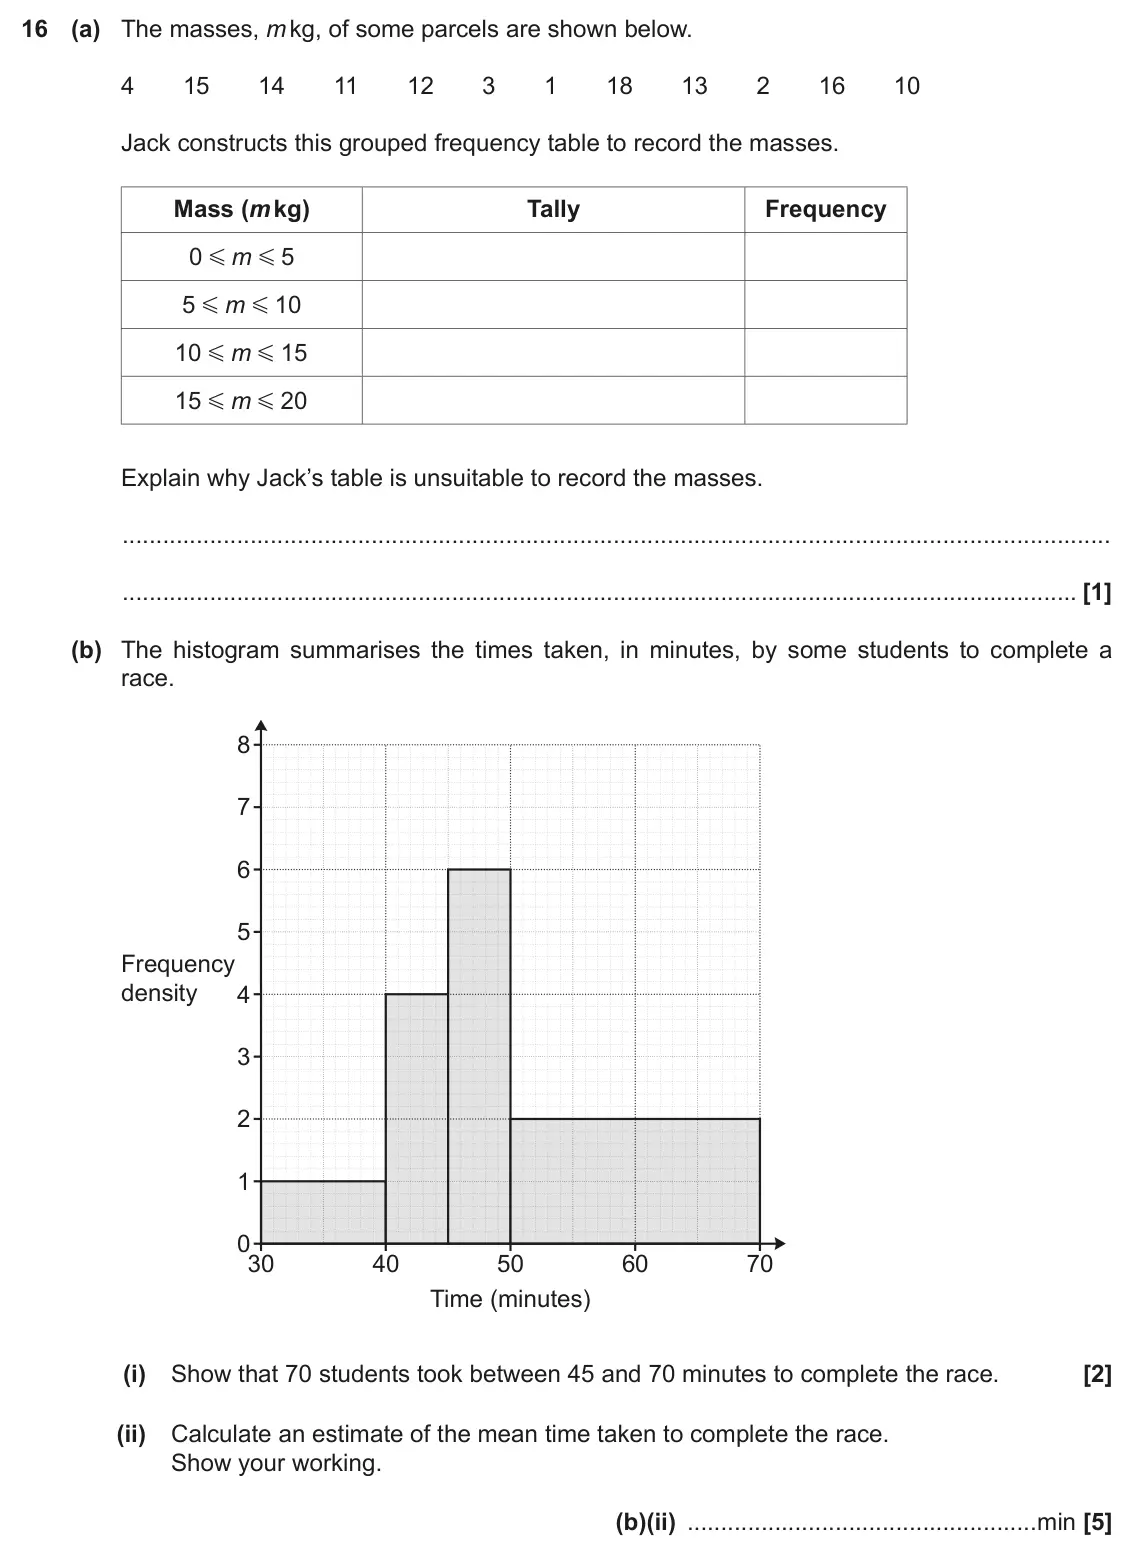
- November 2020, Paper 5, Q16 (8 marks): (a) The masses, m kg, of some parcels are shown below. 4 15 14 11 12 3 1 18 13 2 16 10 Jack constructs this grouped frequency table to record the masses. Mass (
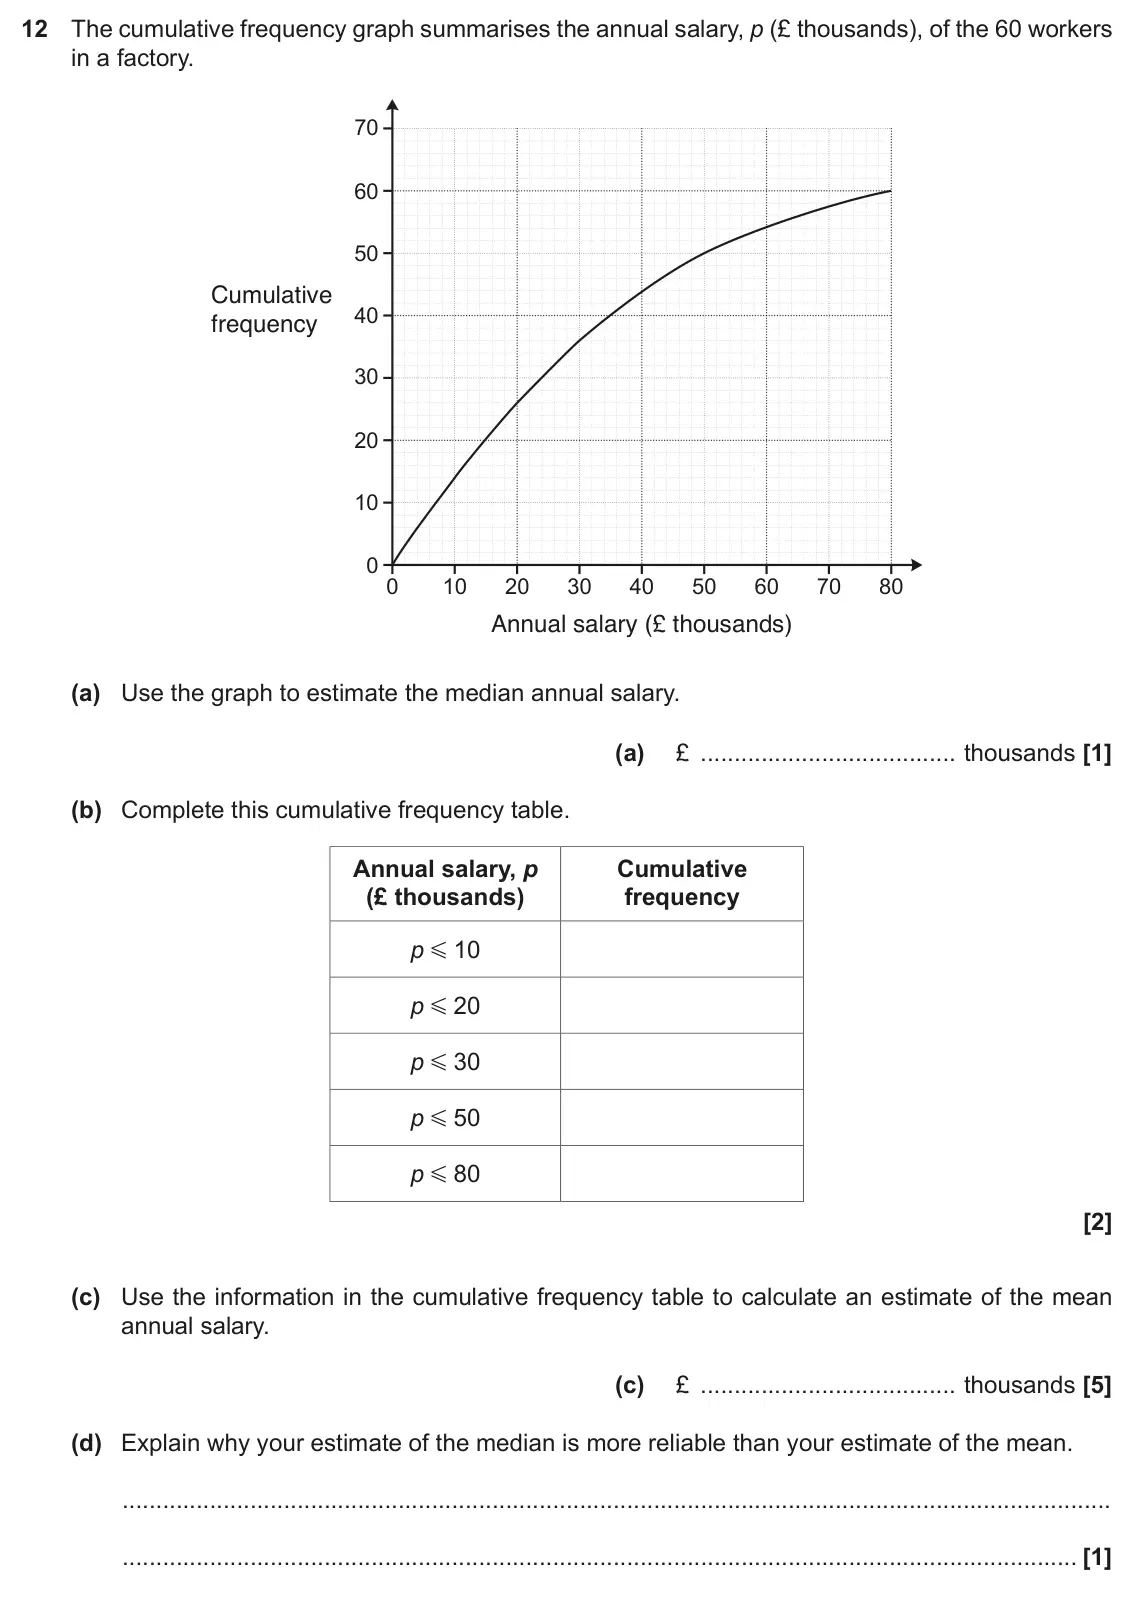
- November 2019, Paper 4, Q12 (9 marks): The cumulative frequency graph summarises the annual salary, p (£ thousands), of the 60 workers in a factory. 70 60 50 Cumulative 40 frequency 30 20 10 0 0 10 2
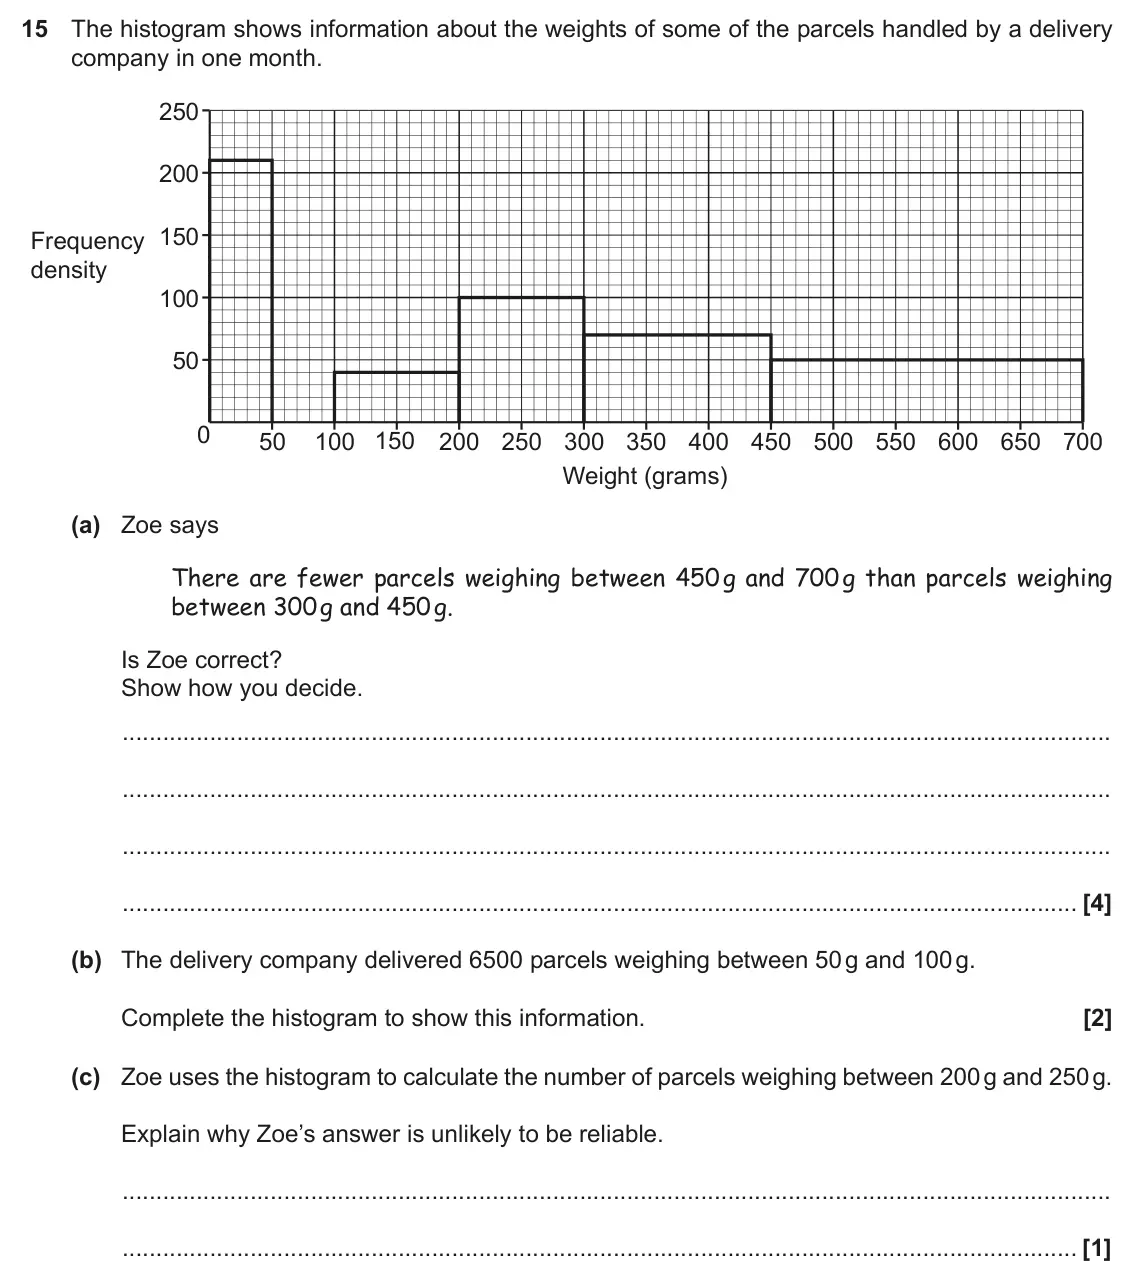
- November 2019, Paper 6, Q15 (7 marks): The histogram shows information about the weights of some of the parcels handled by a delivery company in one month. 250 200 150 Frequency density 100 50 0 50 1
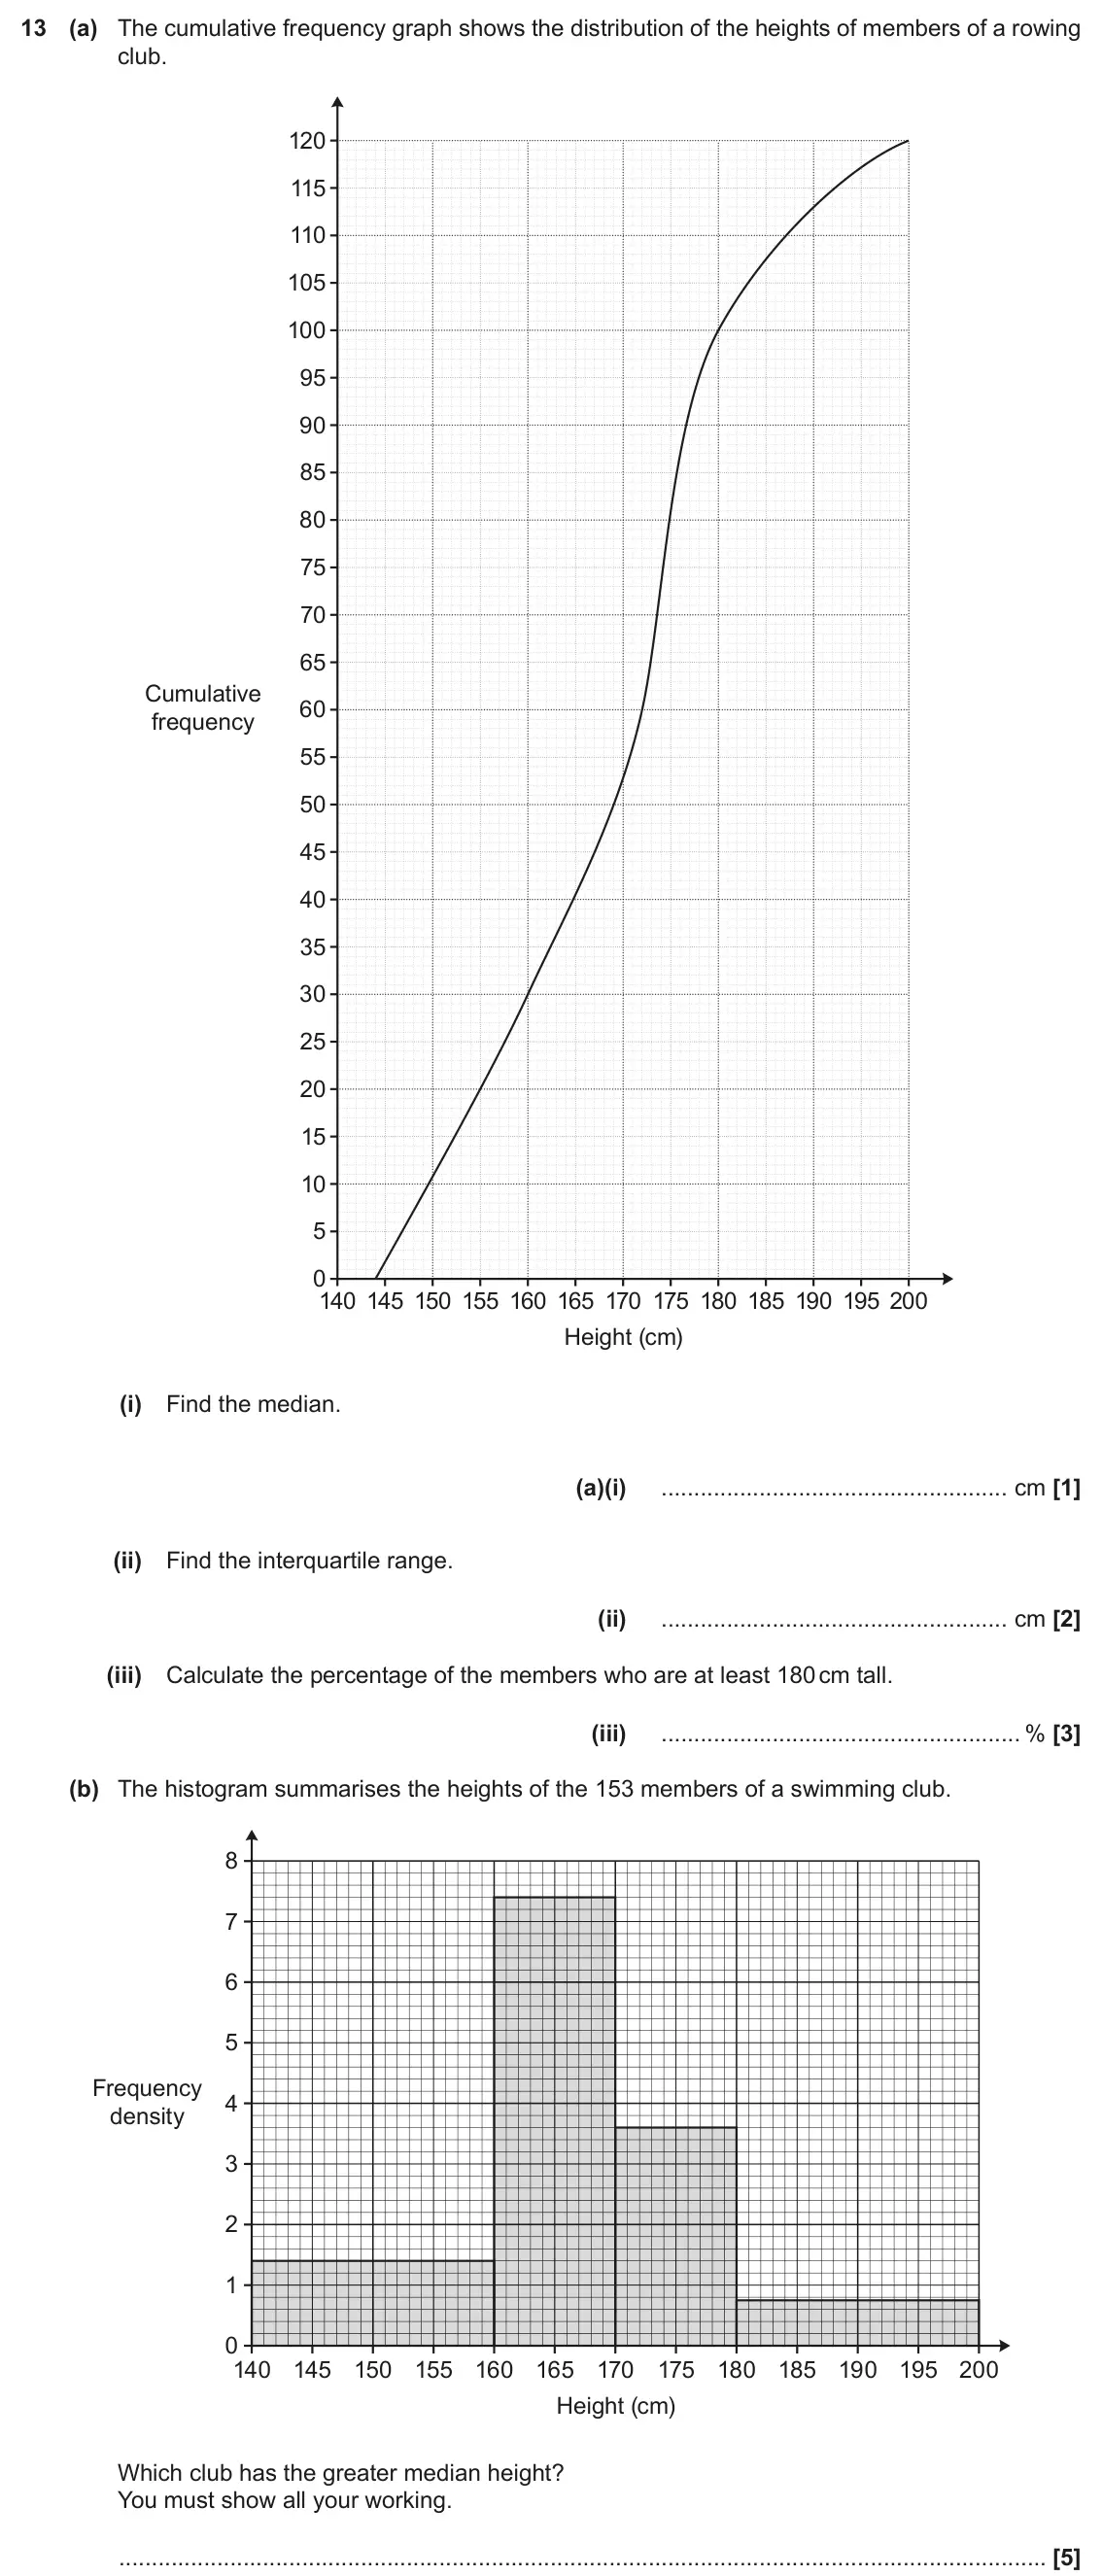
- June 2019, Paper 4, Q13 (11 marks): (a) The cumulative frequency graph shows the distribution of the heights of members of a rowing club. 120 115 110 105 100 95 90 85 80 75 70 65 Cumulative 60 fre
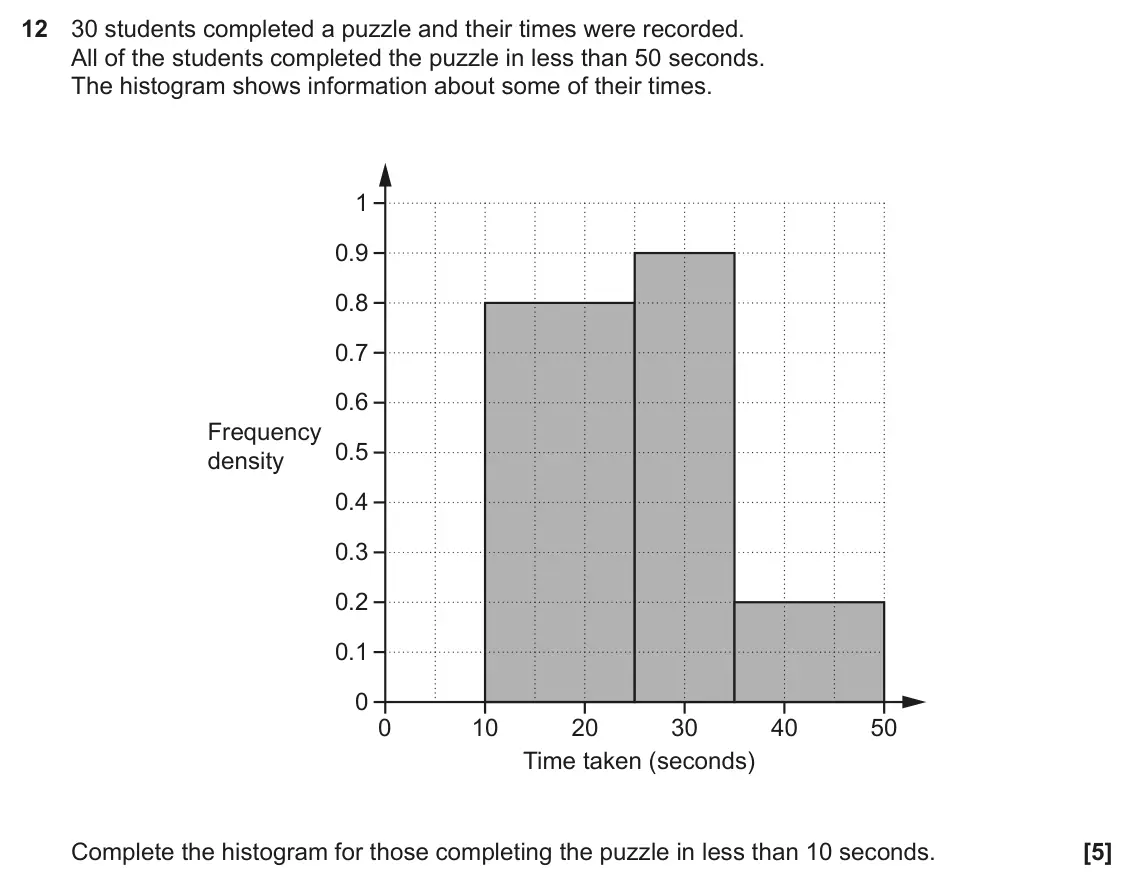
- November 2018, Paper 4, Q12 (5 marks): 30 students completed a puzzle and their times were recorded. All of the students completed the puzzle in less than 50 seconds. The histogram shows information
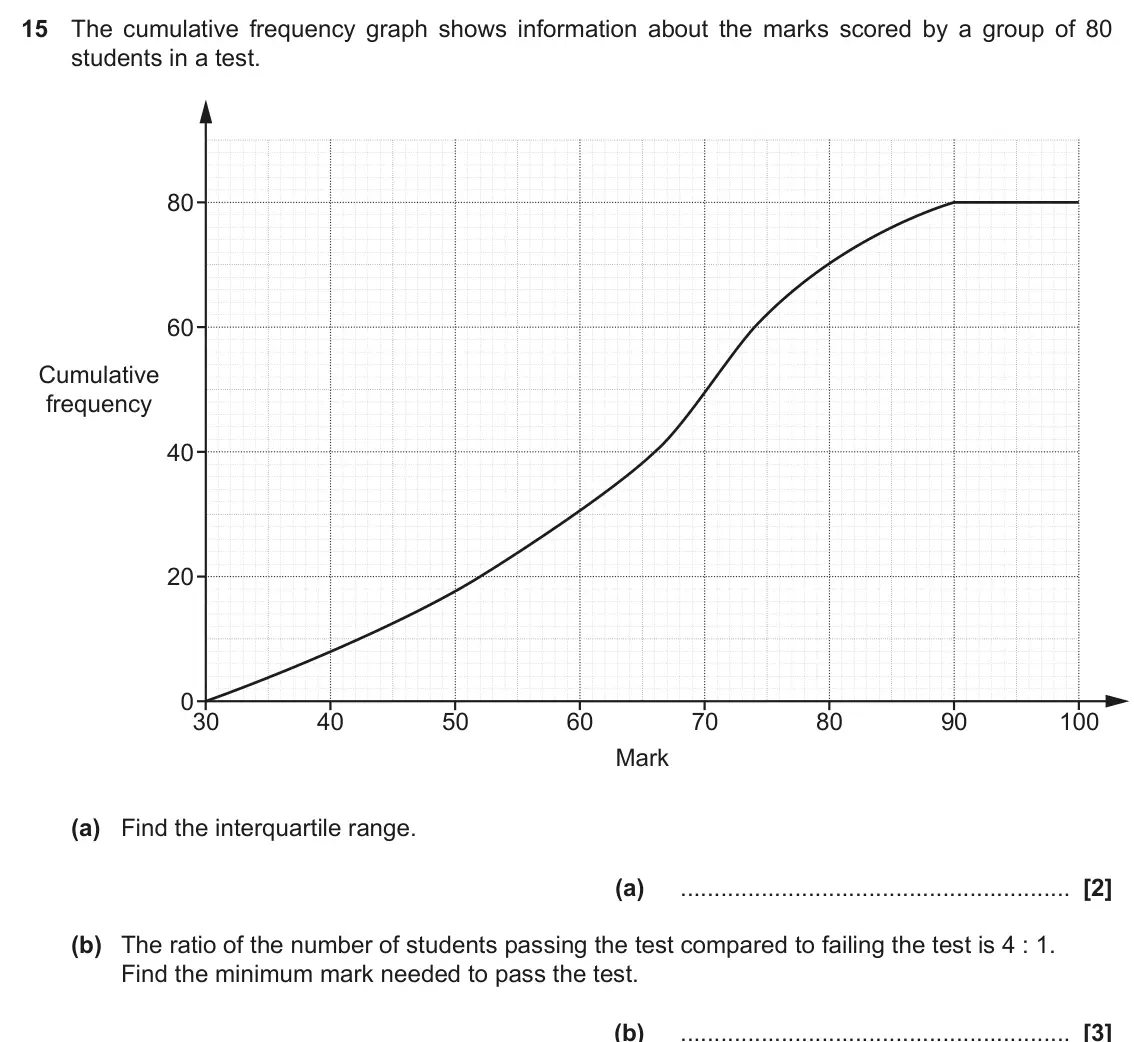
- November 2018, Paper 5, Q15 (5 marks): The cumulative frequency graph shows information about the marks scored by a group of 80 students in a test. 80 60 Cumulative frequency 40 20 0 30 40 50 60 70 8
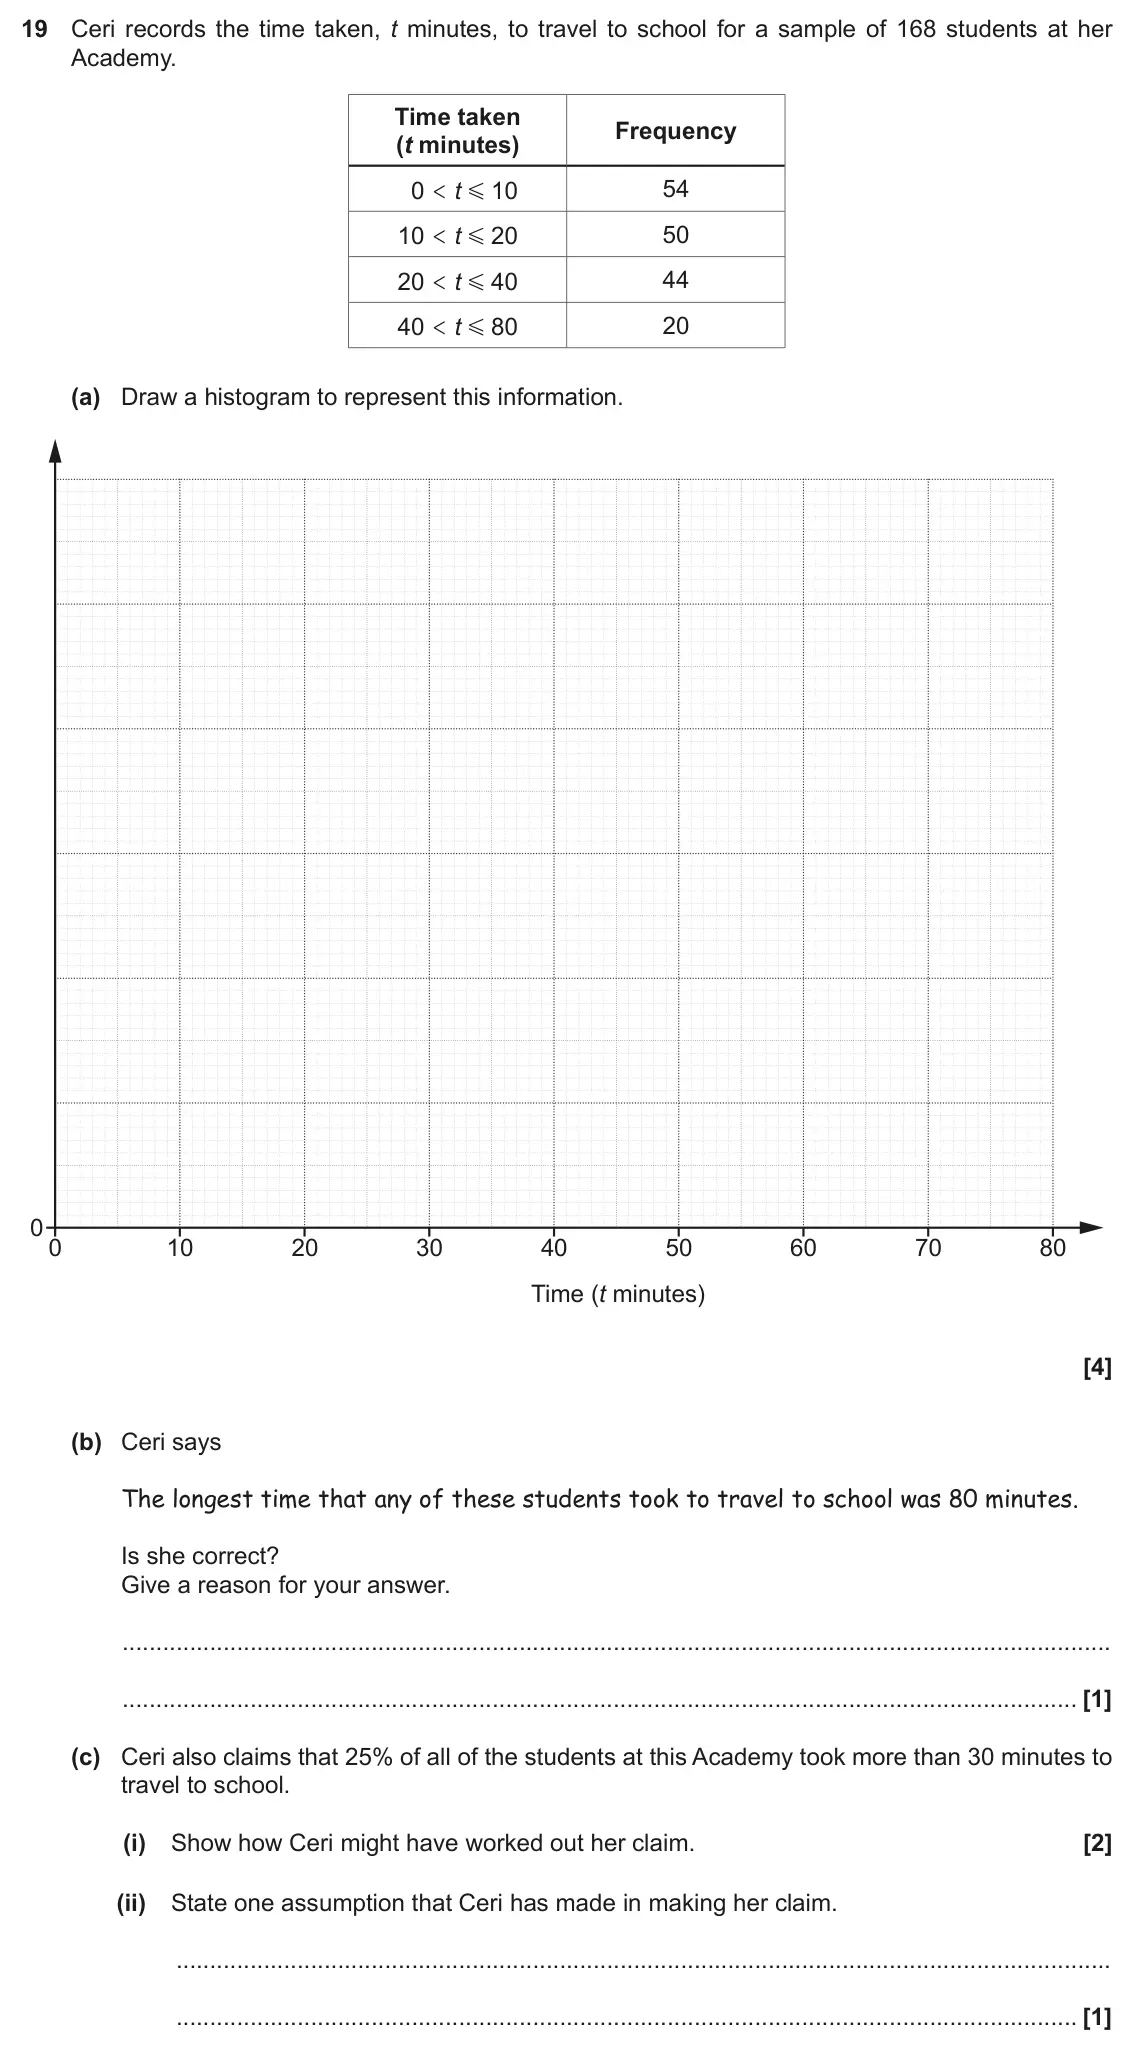
- June 2018, Paper 5, Q19 (8 marks): Ceri records the time taken, t minutes, to travel to school for a sample of 168 students at her Academy. Time taken Frequency (t minutes) 0 < t G 10 54 50 10 <
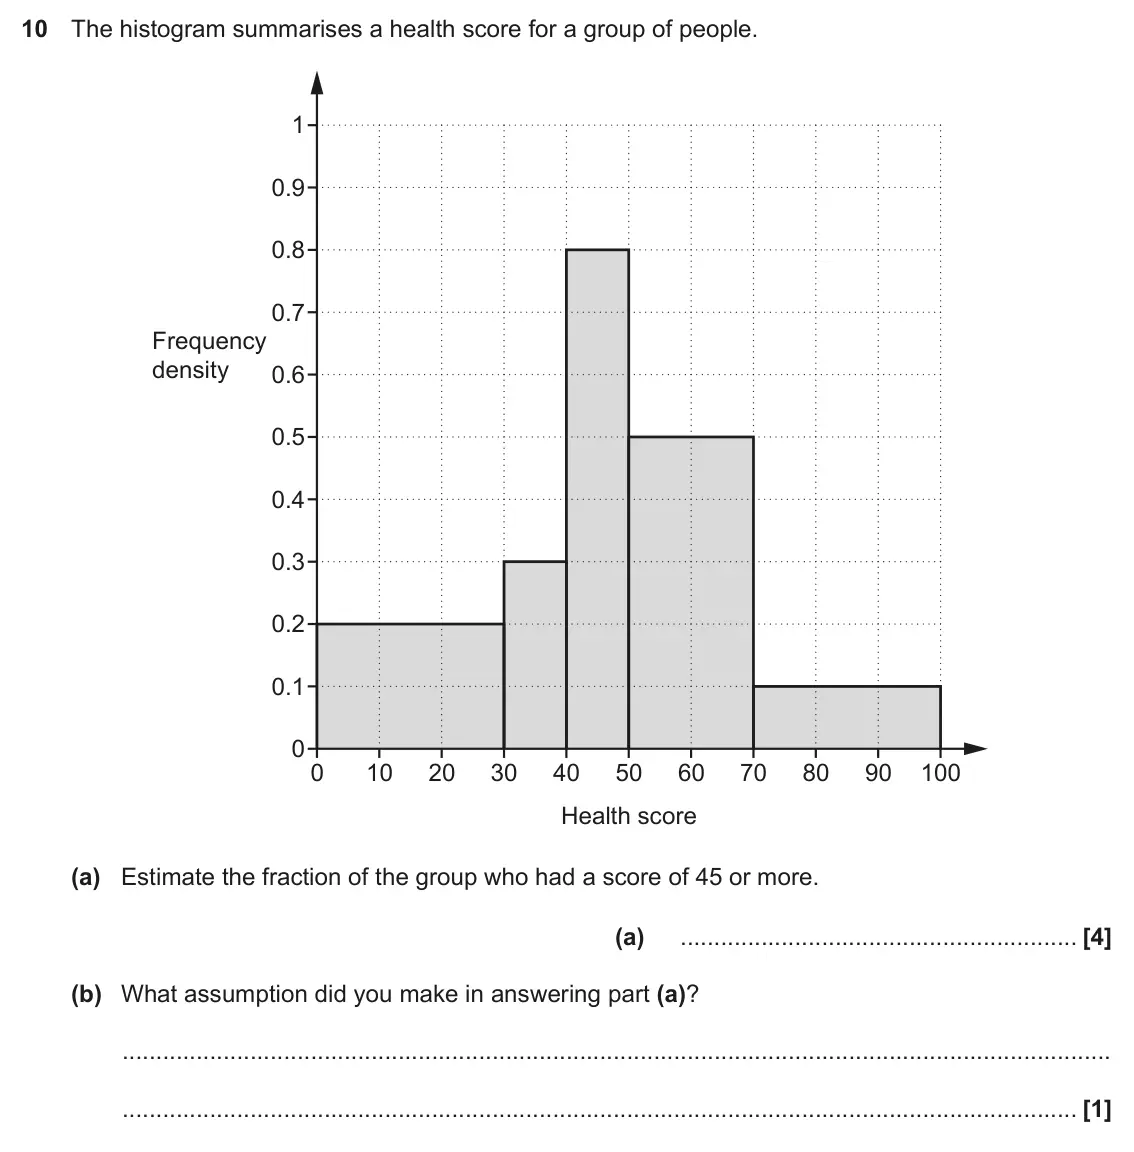
- November 2017, Paper 4, Q10 (5 marks): The histogram summarises a health score for a group of people. 1 0.9 0.8 0.7 Frequency density 0.6 0.5 0.4 0.3 0.2 0.1 0 0 10 20 30 40 50 60 70 80 90 100 Health
- November 2017, Paper 5, Q15 (9 marks): Iqrah carries out a survey of 200 families in the north of England on their weekly spending on food. The cumulative frequency diagram summarises the results. 20
- June 2017, Paper 4, Q12 (4 marks): The cumulative frequency graph shows the speeds, in miles per hour (mph), of vehicles passing a 40 mph speed limit sign on a road. 80 70 60 50 Cumulative freque
- June 2017, Paper 6, Q10 (8 marks): Ana records the amount of money spent by 140 customers in her shop on one day. Amount spent (£a) Frequency 35 0 1 a G 5 42 5 1 a G 10 20 10 1 a G 15 18 15 1 a G
Questions, mark schemes and examiner’s reports are © OCR, from their published past papers. Plumi isn’t affiliated with any exam board. Want whole papers? Every OCR GCSE Maths paper.
Rather write your answers by hand on iPad? Plumi marks them against the same mark schemes.