 plumi
Charts and tables: OCR GCSE Maths questions
Every OCR GCSE Maths exam question on S2 Charts and tables, 2017–2025, with its mark scheme and examiner’s report.
Find questions921
Exam
All years
Calculator
All 15 questions on Charts and tables, as a list
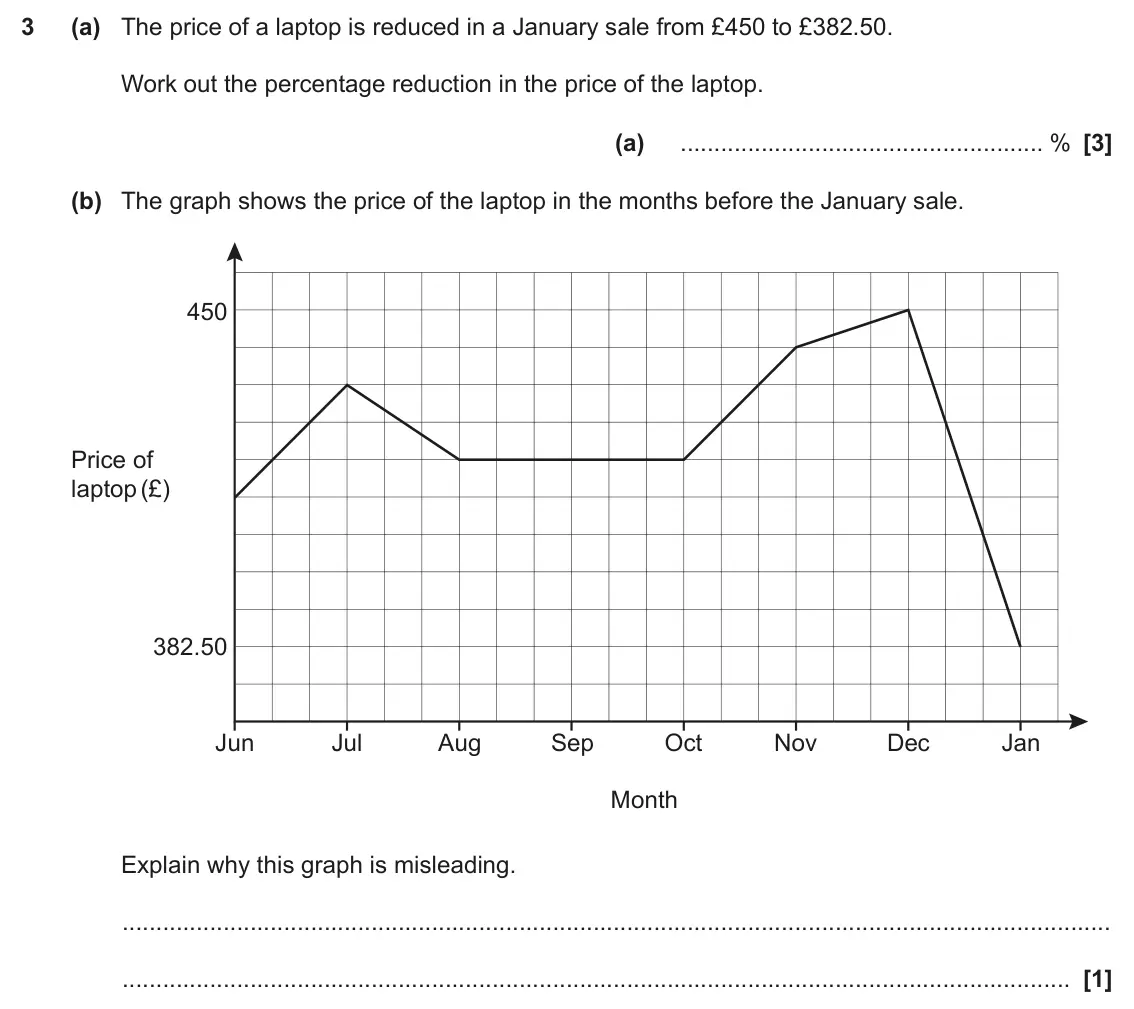
- June 2025, Paper 6, Q3 (4 marks): (a) The price of a laptop is reduced in a January sale from £450 to £382.50. Work out the percentage reduction in the price of the laptop. (a) % (b) The graph s
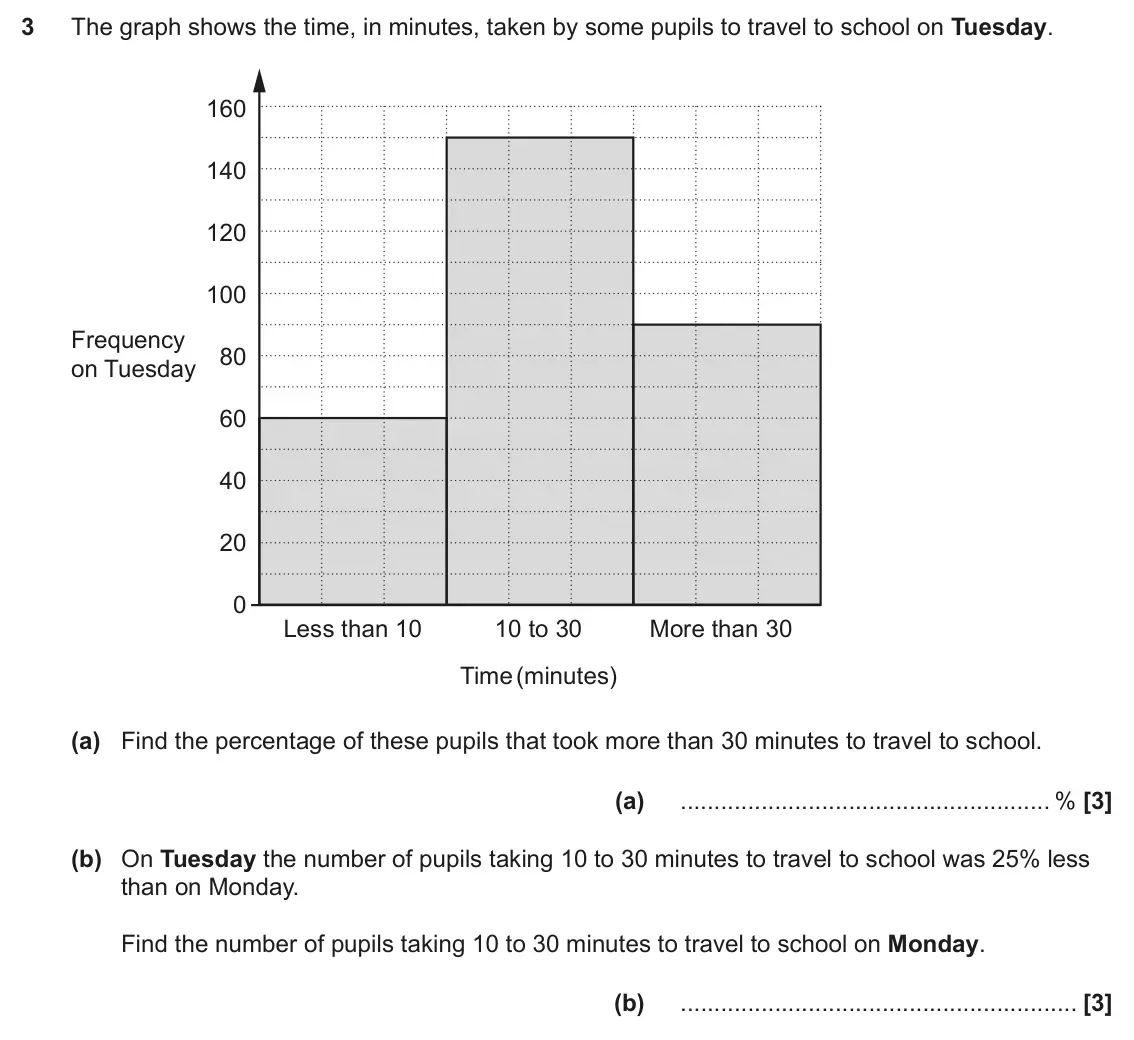
- November 2024, Paper 5, Q3 (6 marks): The graph shows the time, in minutes, taken by some pupils to travel to school on Tuesday. 160 140 120 100 Frequency 80 on Tuesday 60 40 20 0 Less than 10 10 to
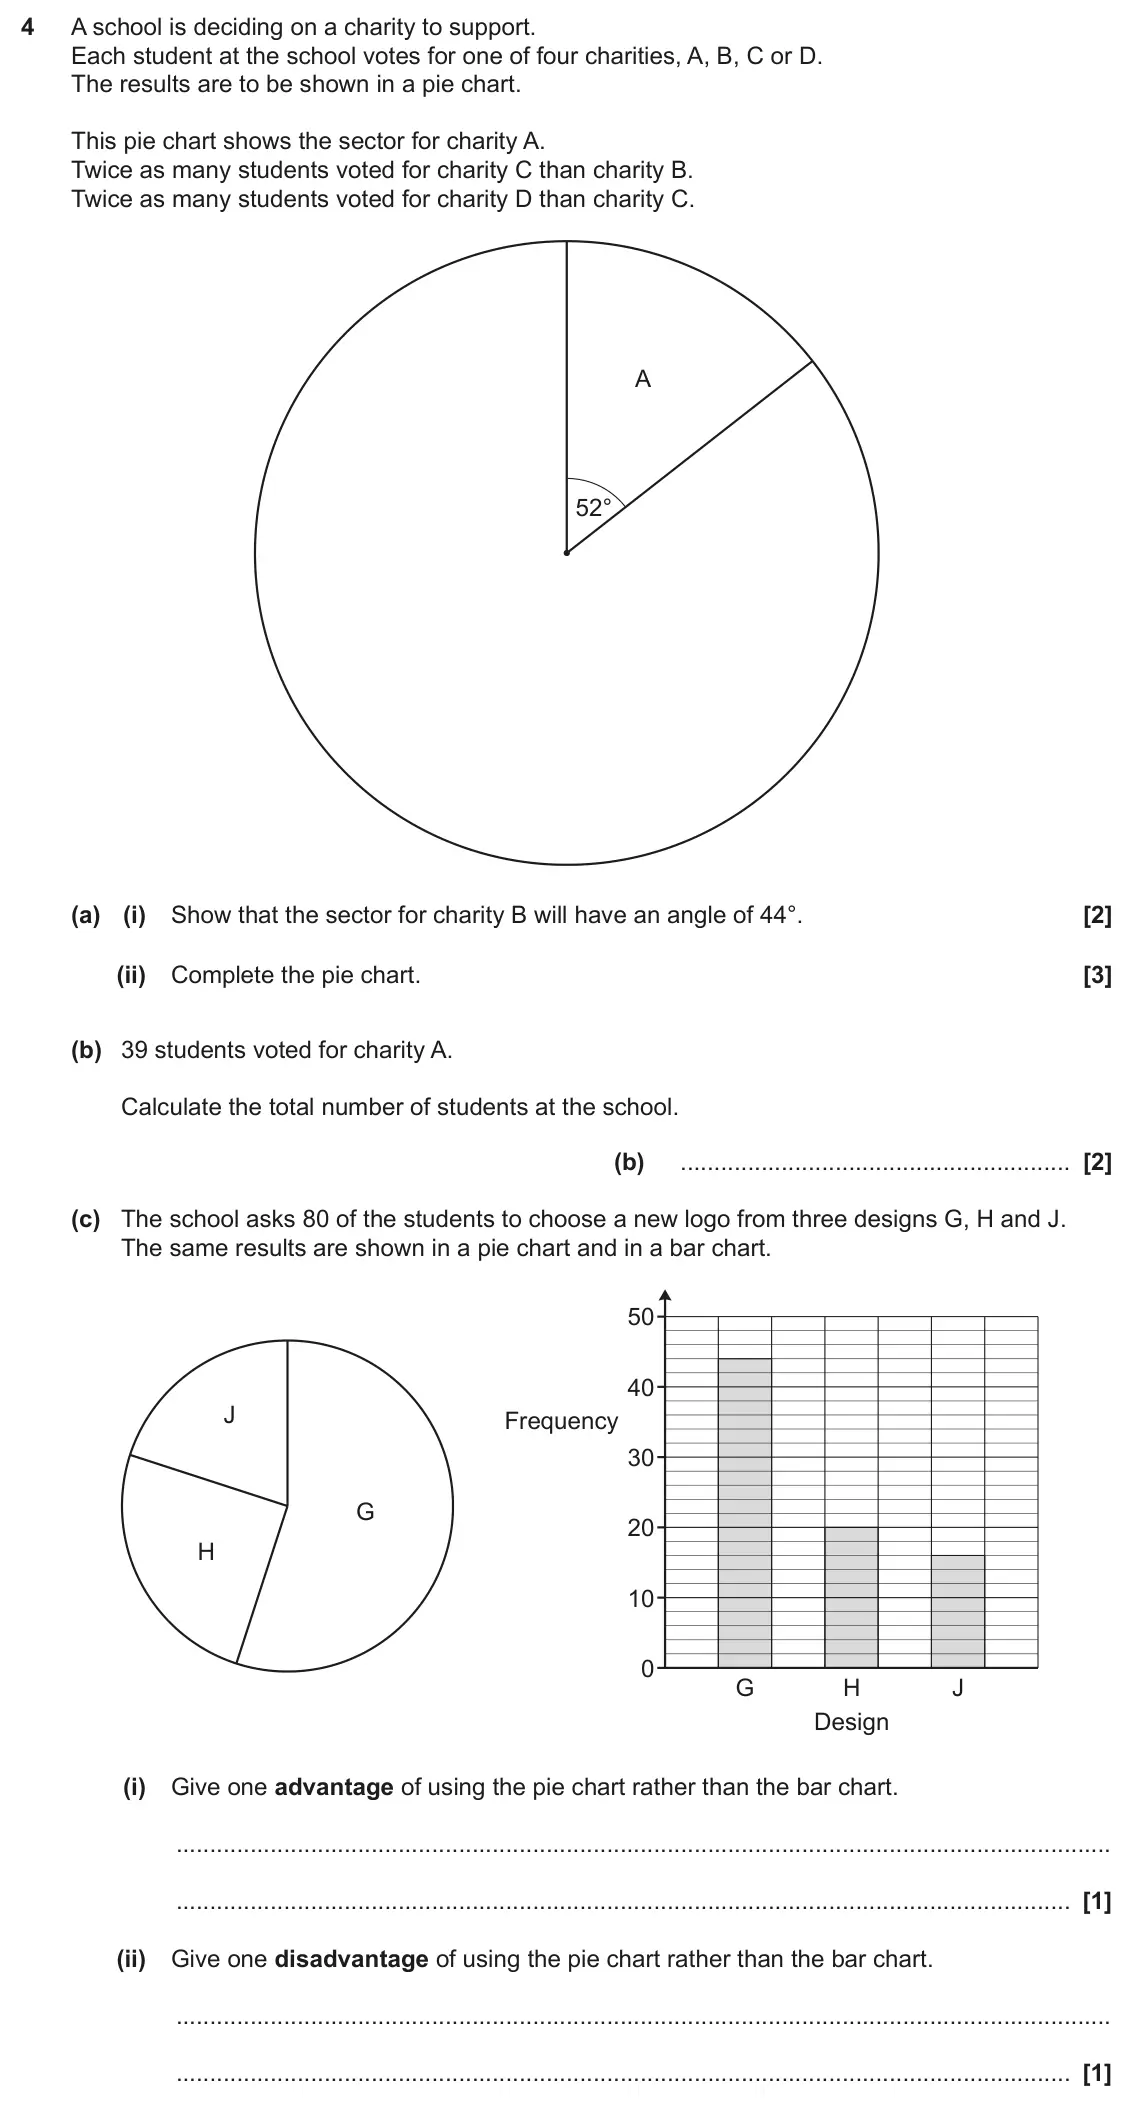
- June 2024, Paper 4, Q4 (9 marks): A school is deciding on a charity to support. Each student at the school votes for one of four charities, A, B, C or D. The results are to be shown in a pie cha
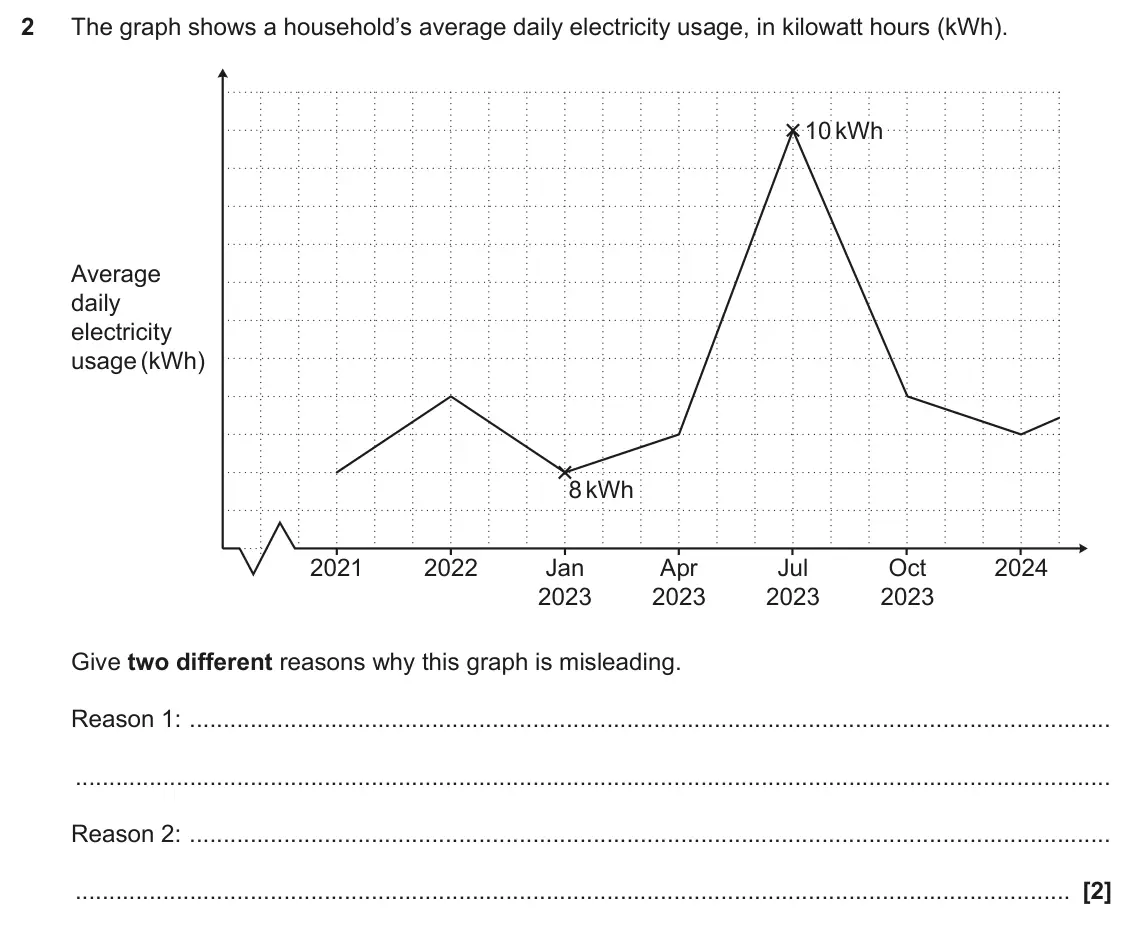
- June 2024, Paper 6, Q2 (2 marks): The graph shows a household’s average daily electricity usage, in kilowatt hours (kWh). 10 kWh 10 kWh Average daily electricity usage (kWh) 8 kWh 8 kWh 2021 202
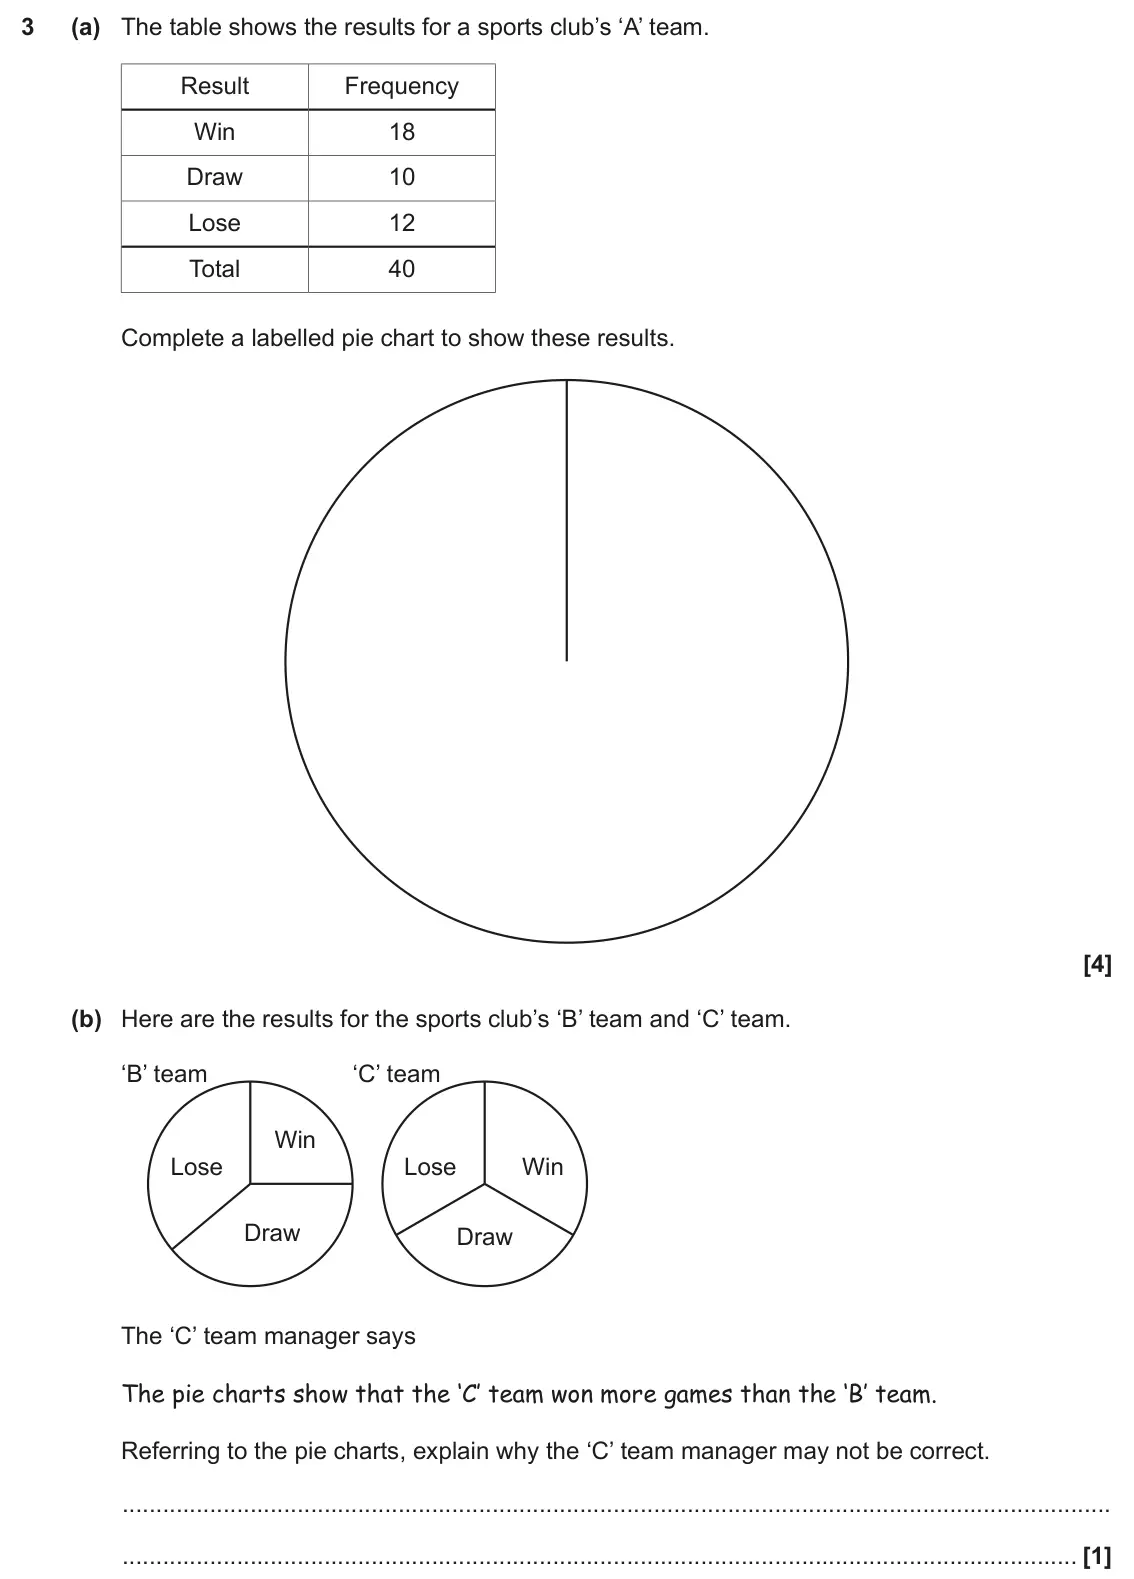
- November 2023, Paper 4, Q3 (5 marks): (a) The table shows the results for a sports club’s ‘A’ team. Result Frequency Win 18 Draw 10 Lose 12 Total 40 Complete a labelled pie chart to show these resul
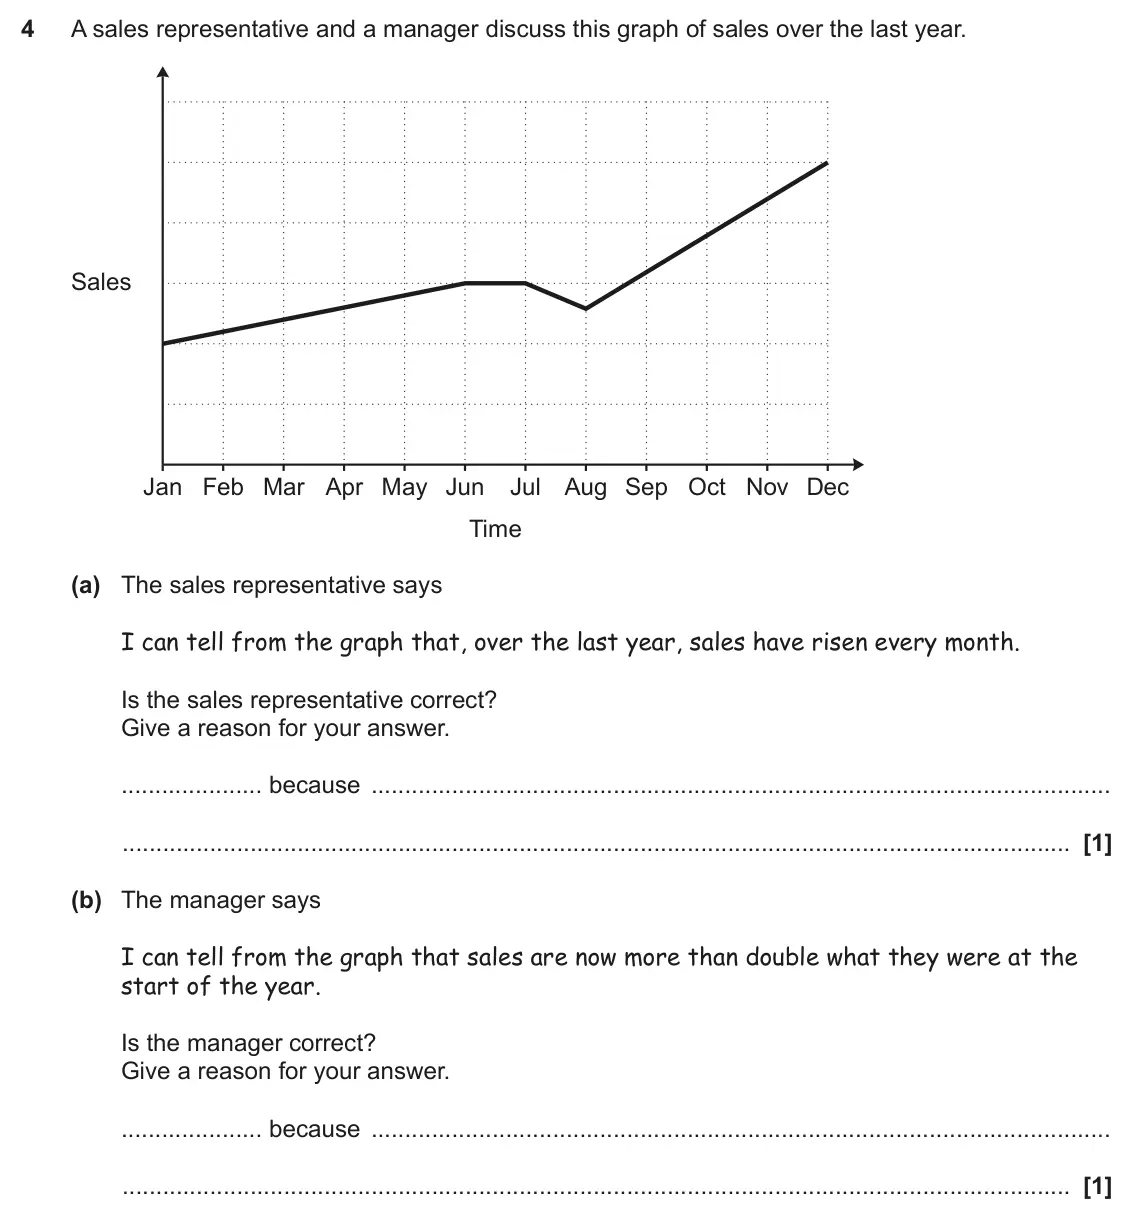
- November 2023, Paper 5, Q4 (2 marks): A sales representative and a manager discuss this graph of sales over the last year. Sales Jan Feb Mar Apr May Jun Jul Aug Sep Oct Nov Dec Time (a) The sales re
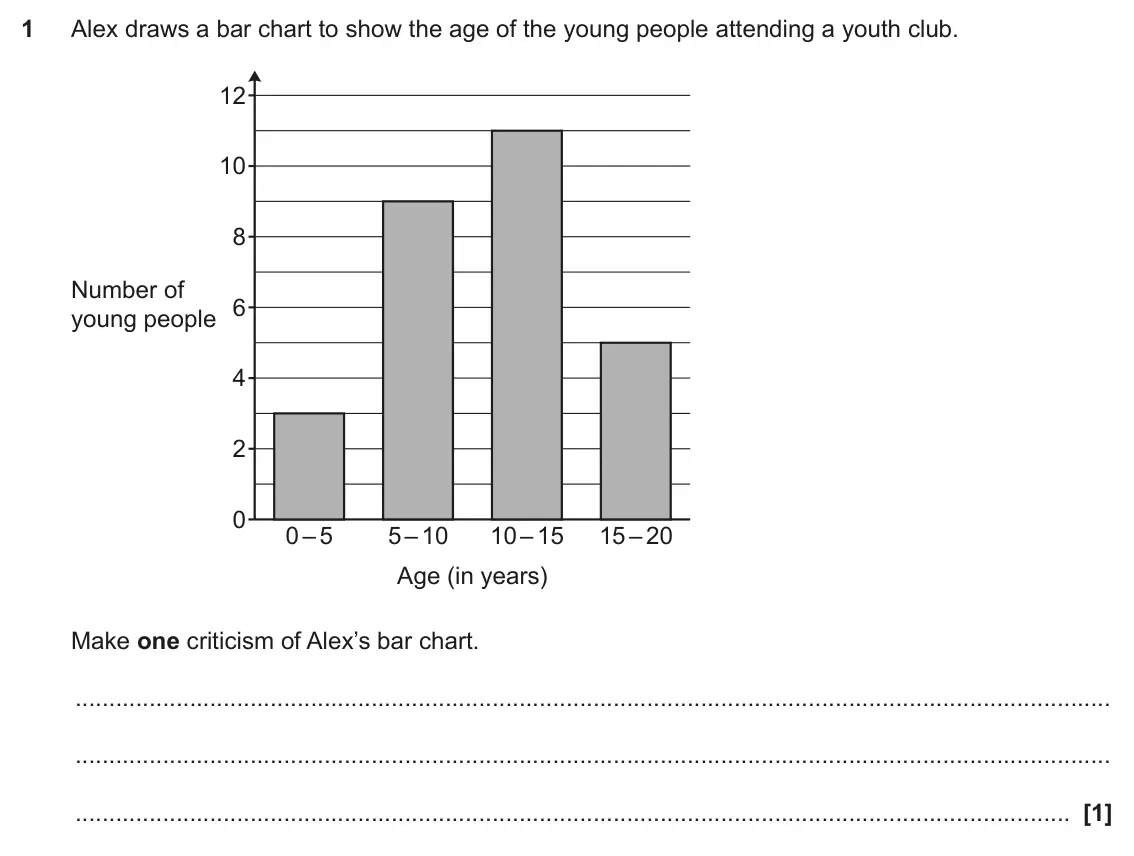
- June 2023, Paper 6, Q1 (1 mark): Alex draws a bar chart to show the age of the young people attending a youth club. 12 10 8 Number of 6 young people 4 2 0 0 – 5 5 – 10 10 – 15 15 – 20 Age (in y
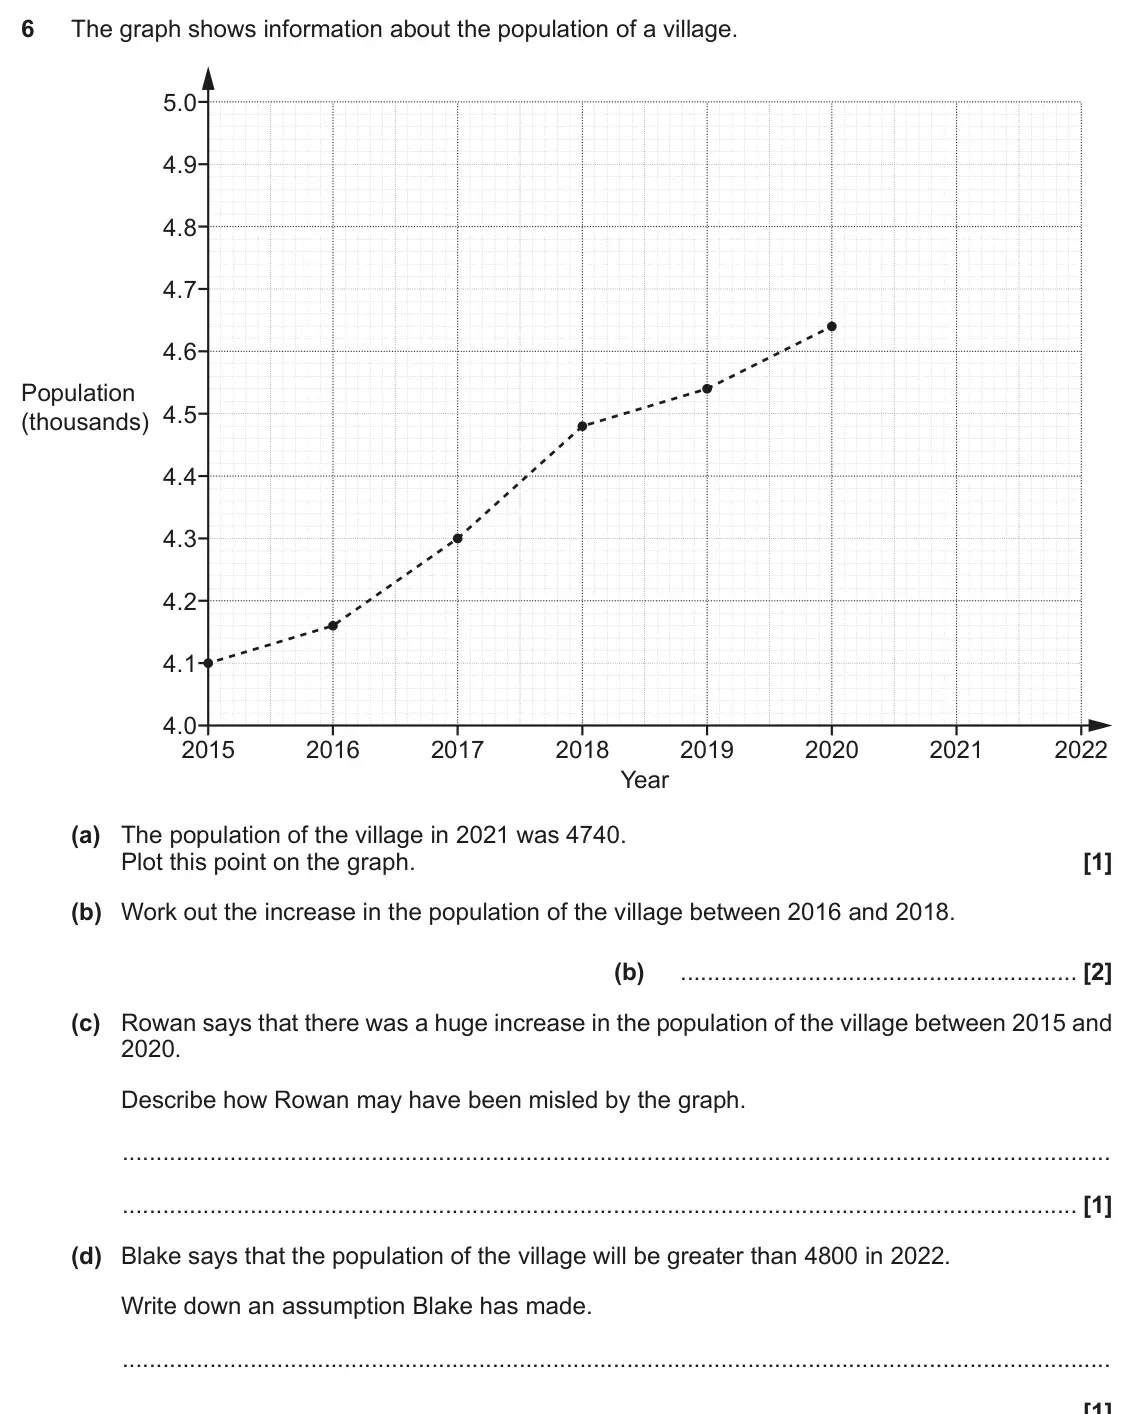
- November 2022, Paper 5, Q6 (5 marks): The graph shows information about the population of a village. 5.0 4.9 4.8 4.7 4.6 Population 4.5 (thousands) 4.4 4.3 4.2 4.1 4.0 2015 2016 2017 2018 2019 2020
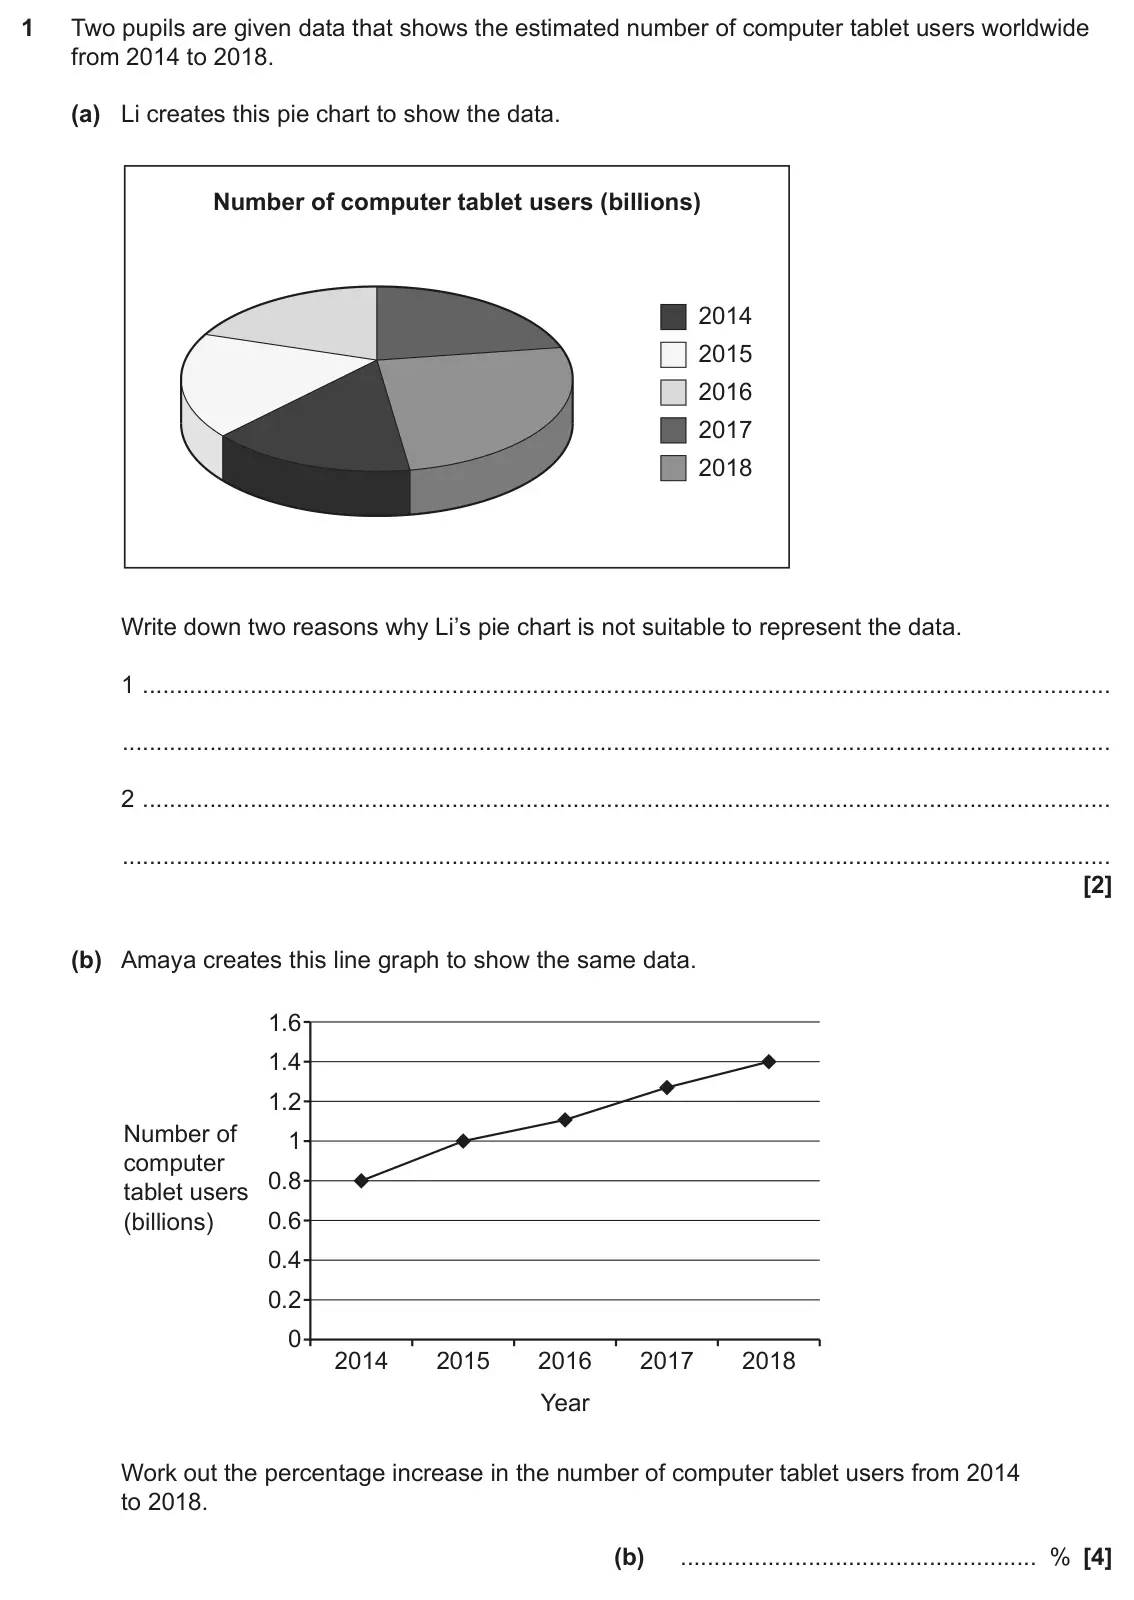
- June 2022, Paper 5, Q1 (6 marks): Two pupils are given data that shows the estimated number of computer tablet users worldwide from 2014 to 2018. (a) Li creates this pie chart to show the data.
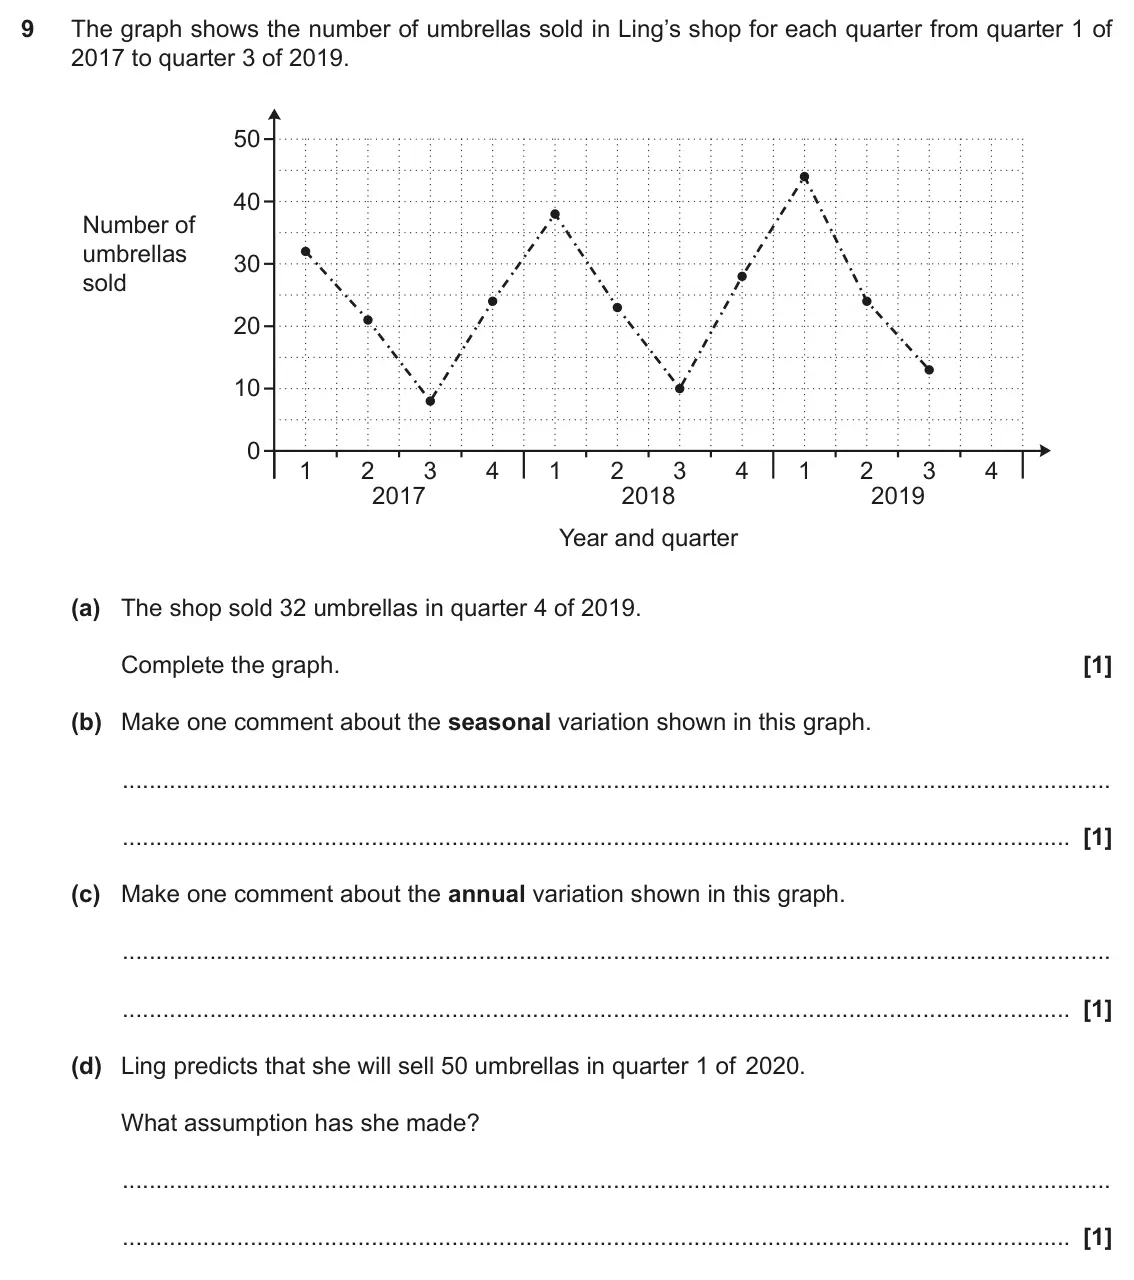
- November 2020, Paper 4, Q9 (4 marks): The graph shows the number of umbrellas sold in Ling’s shop for each quarter from quarter 1 of 2017 to quarter 3 of 2019. 50 40 Number of umbrellas 30 sold 20 1
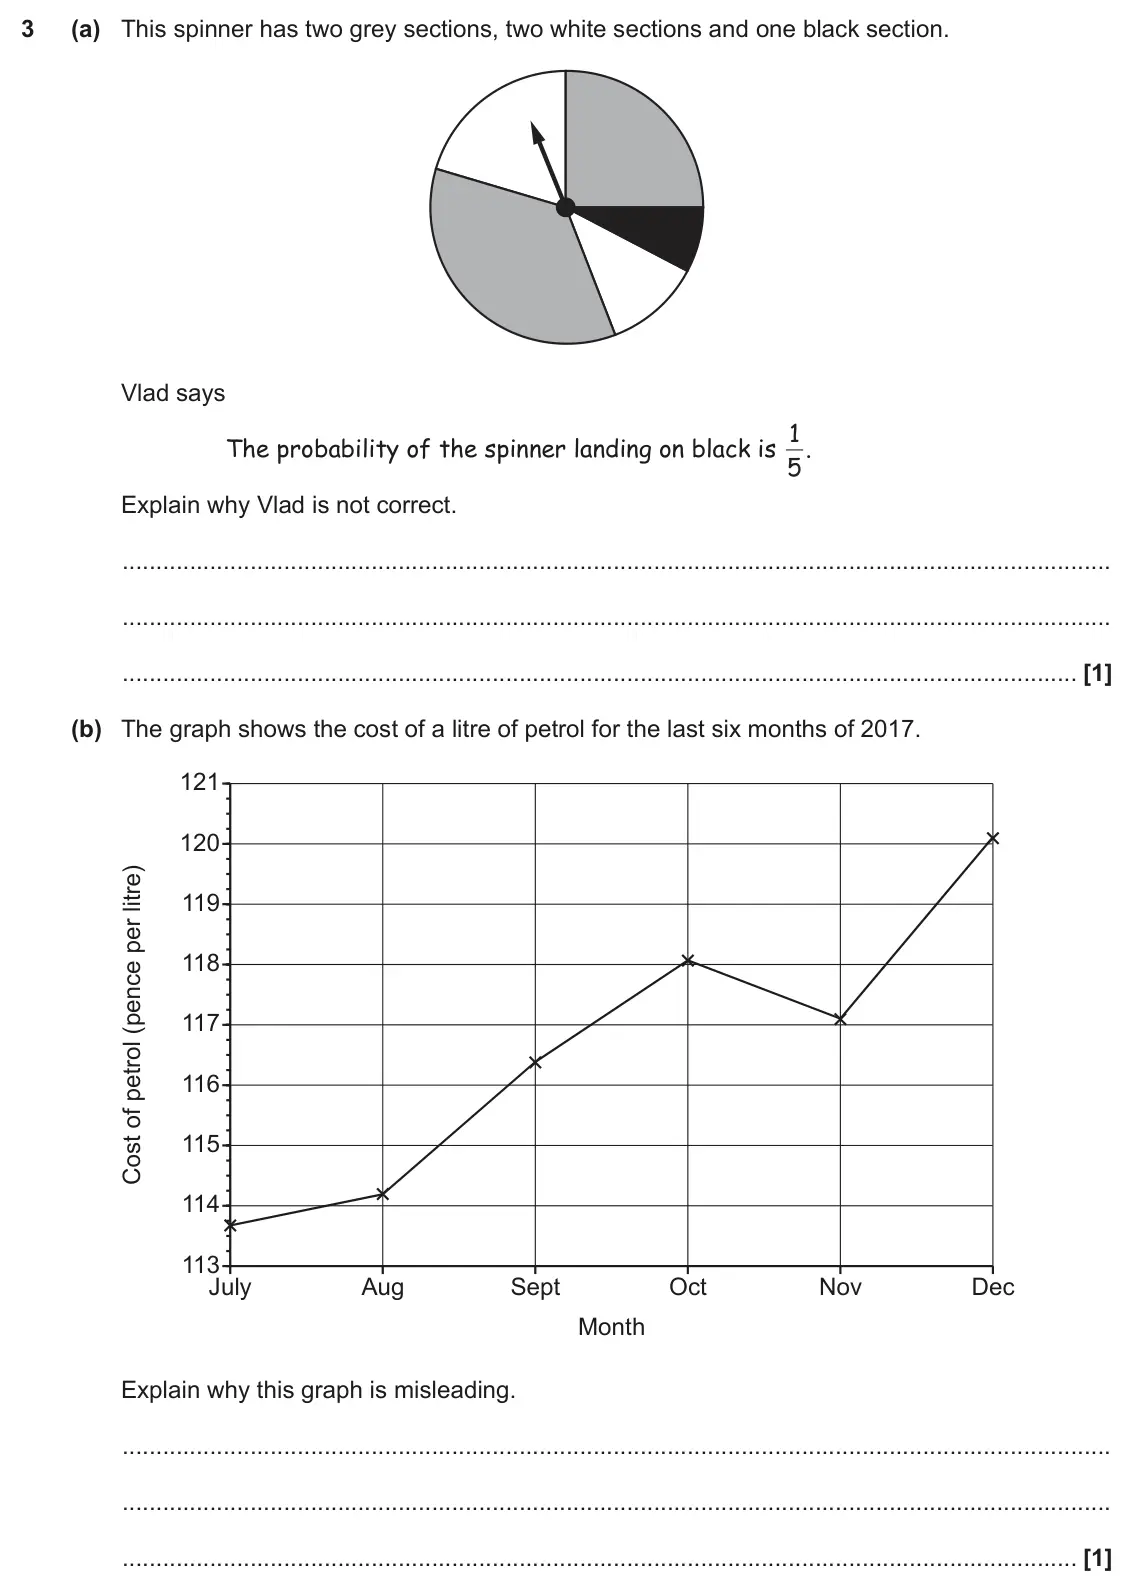
- June 2019, Paper 6, Q3 (2 marks): (a) This spinner has two grey sections, two white sections and one black section. Vlad says 1 . The probability of the spinner landing on black is 5 Explain why
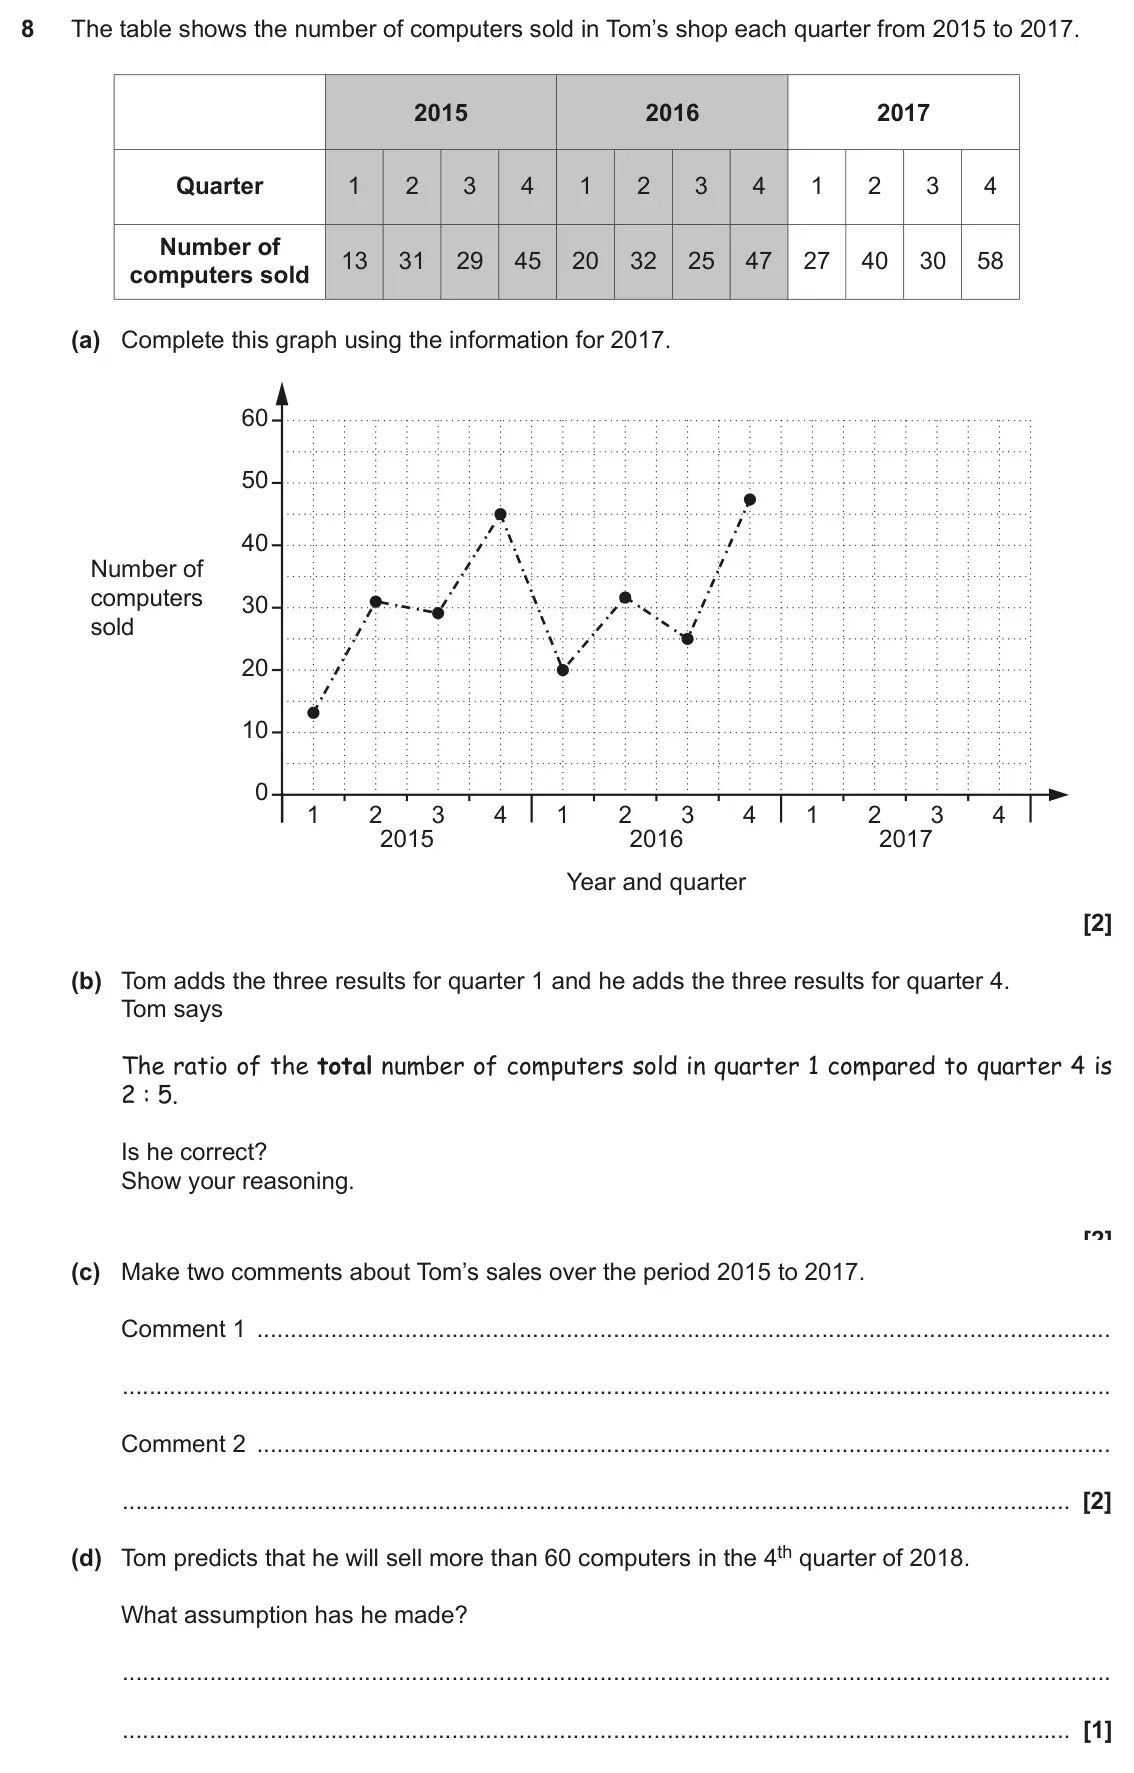
- November 2018, Paper 5, Q8 (7 marks): The table shows the number of computers sold in Tom’s shop each quarter from 2015 to 2017. 2015 2016 2017 Quarter 1 2 3 4 1 2 3 4 1 2 3 4 Number of 13 31 29 45
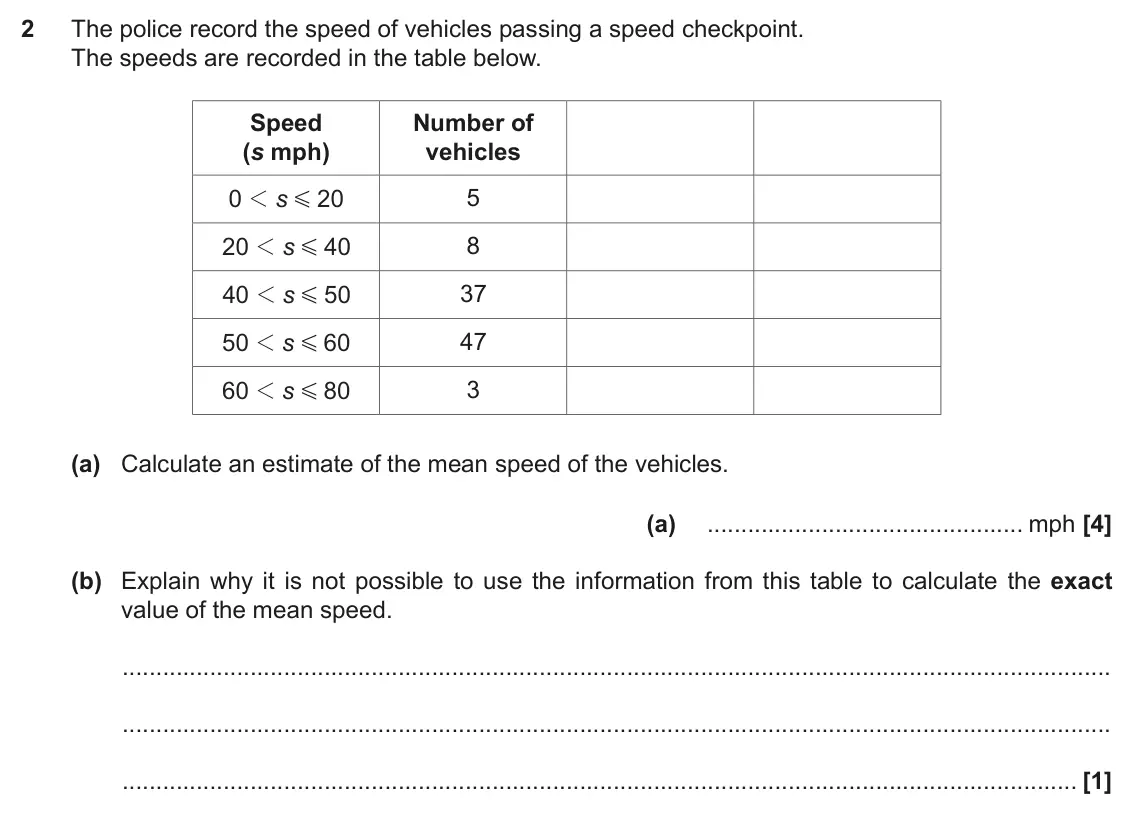
- November 2018, Paper 6, Q2 (5 marks): The police record the speed of vehicles passing a speed checkpoint. The speeds are recorded in the table below. Speed Number of (s mph) vehicles 0 20 5 1 s G 8
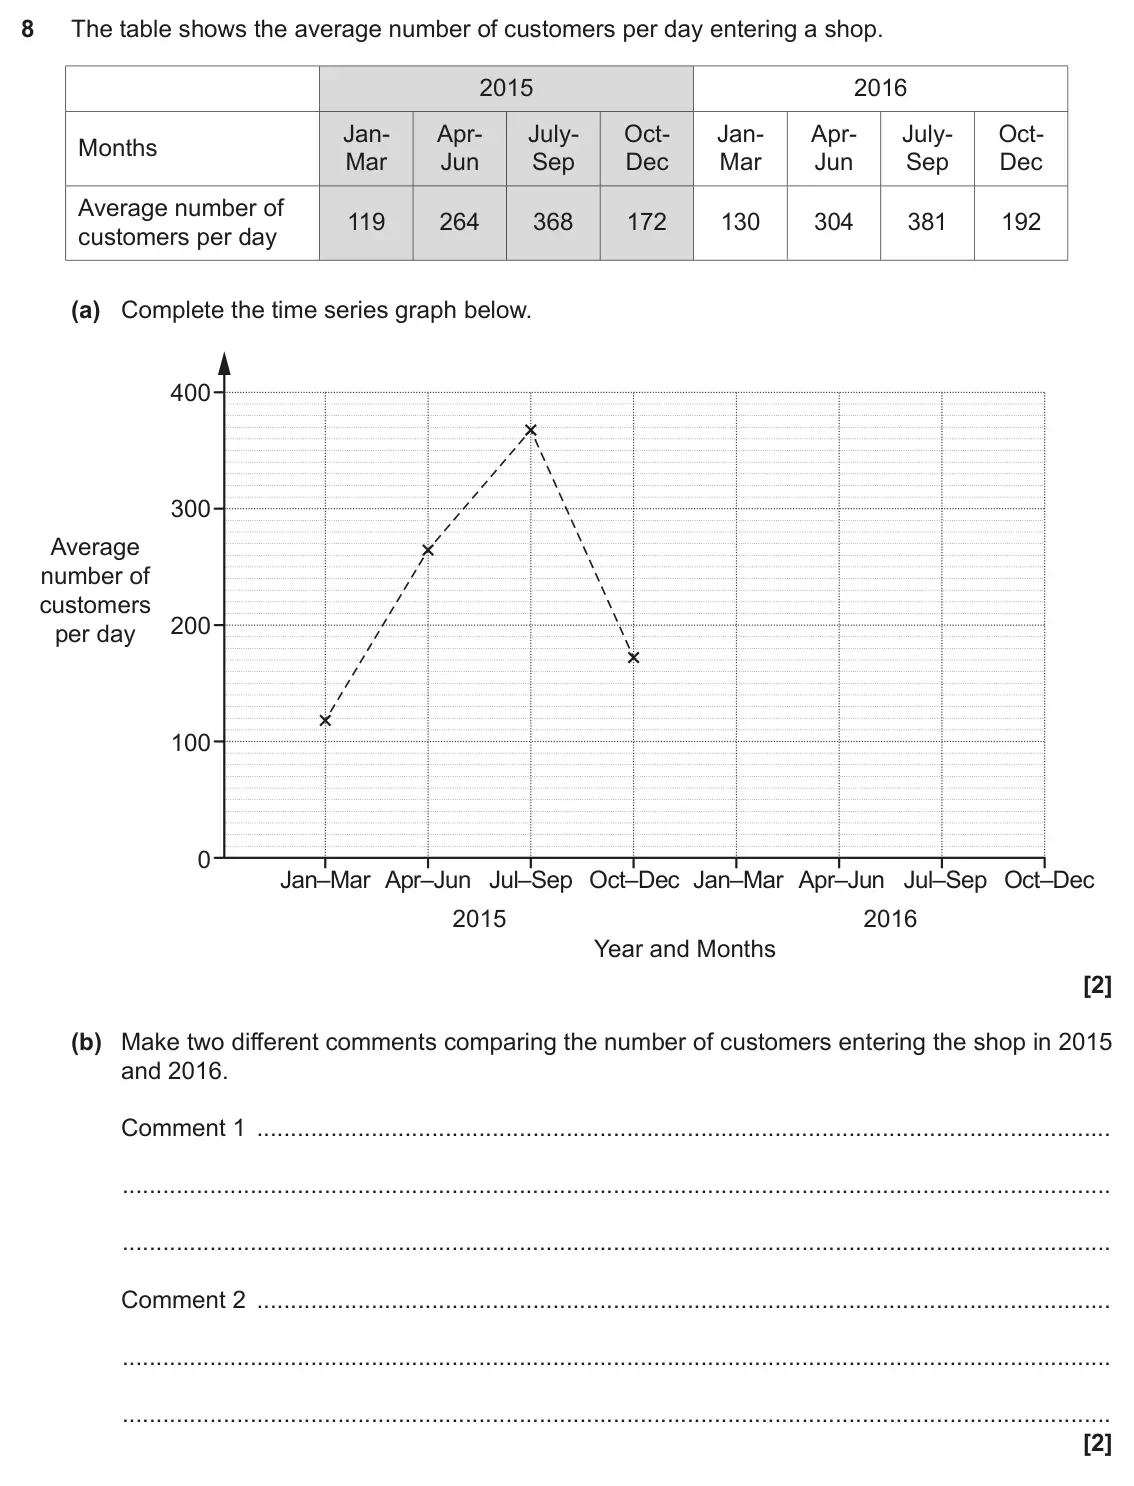
- June 2017, Paper 4, Q8 (4 marks): The table shows the average number of customers per day entering a shop. 2015 2016 Jan- Apr- July- Oct- Jan- Apr- July- Oct- Months Mar Jun Sep Dec Mar Jun Sep
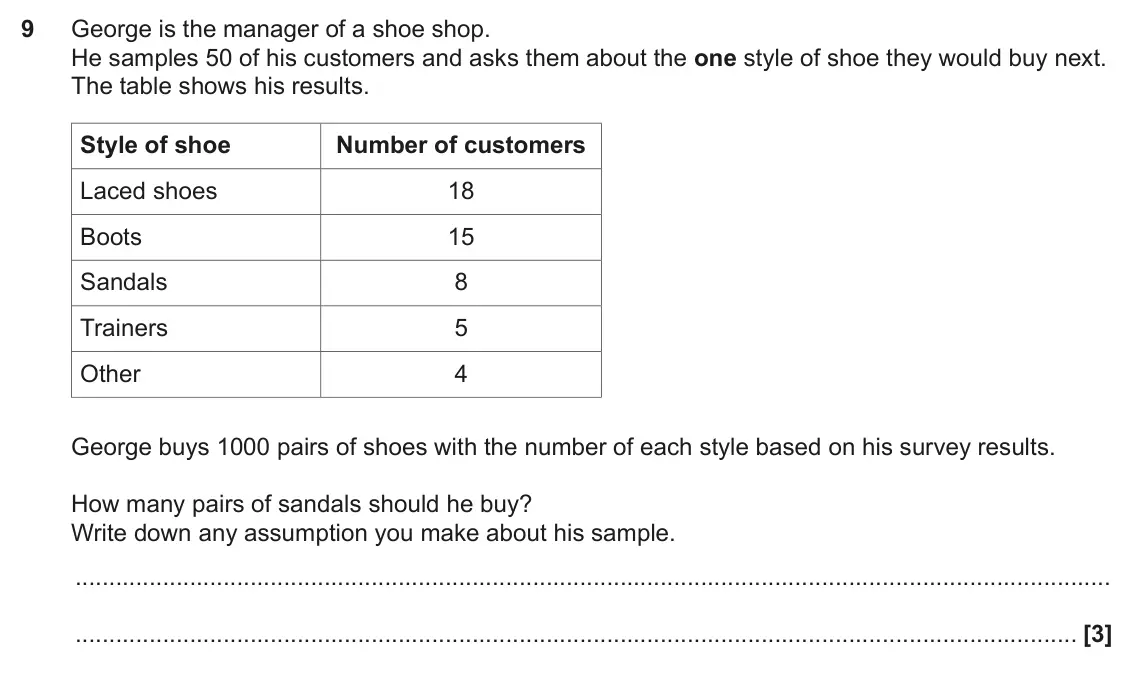
- June 2017, Paper 5, Q9 (3 marks): George is the manager of a shoe shop. He samples 50 of his customers and asks them about the one style of shoe they would buy next. The table shows his results.
Questions, mark schemes and examiner’s reports are © OCR, from their published past papers. Plumi isn’t affiliated with any exam board. Want whole papers? Every OCR GCSE Maths paper.
Rather write your answers by hand on iPad? Plumi marks them against the same mark schemes.