Skip to content

Averages, spread and box plots: OCR GCSE Maths questions

Every OCR GCSE Maths exam question on S4 Averages, spread and box plots, 2017–2025, with its mark scheme and examiner’s report.

Find questions921
Exam
All years
Calculator
921 questions

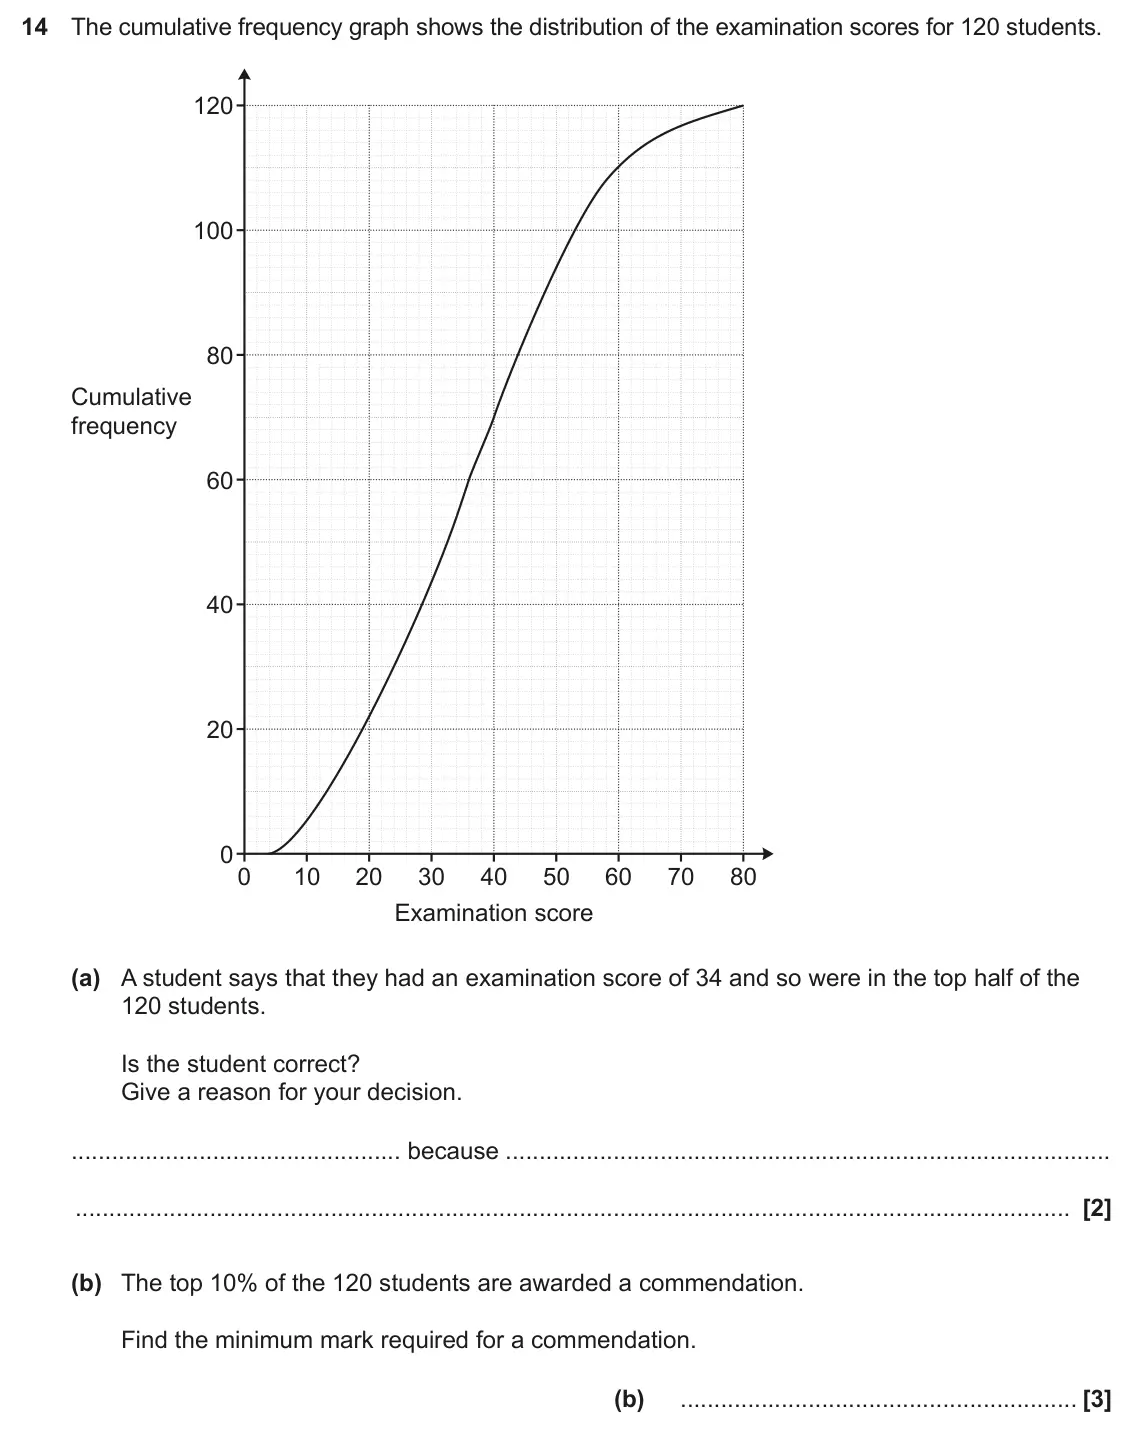
  1. June 2025 Paper 4, question 14: The cumulative frequency graph shows the distribution of the examination scores for 120 students. 120 100 80 Cumulative frequency 60 40 20 0 0 10 20 30 40 50 60
  2. Q17

    June 2025 · Paper 6

    The whole paper ↗
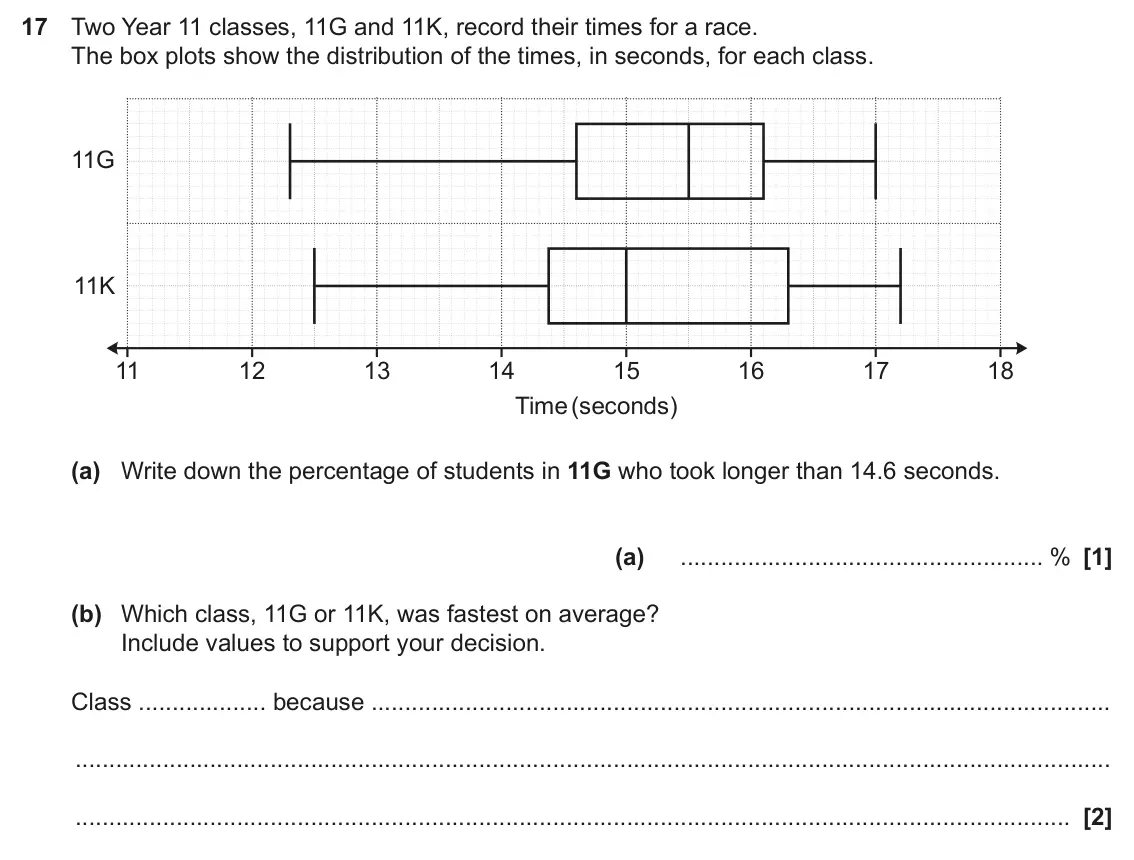
    June 2025 Paper 6, question 17: Two Year 11 classes, 11G and 11K, record their times for a race. The box plots show the distribution of the times, in seconds, for each class. 11G 11K 11 12 13
  3. Q4

    November 2024 · Paper 6

    The whole paper ↗
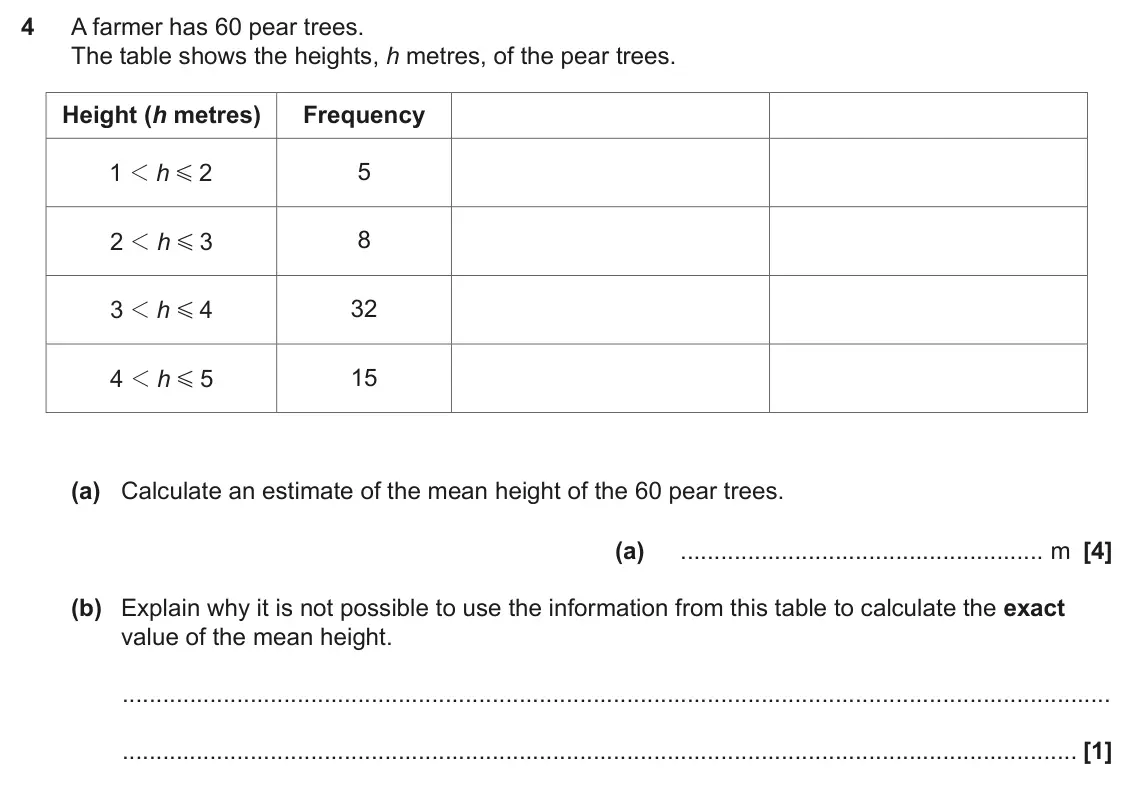
    November 2024 Paper 6, question 4: A farmer has 60 pear trees. The table shows the heights, h metres, of the pear trees. Height (h metres) Frequency 1 2 5 1 h G 8 2 1 h 3 G 32 3 1 h 4 G 15 4 1 h
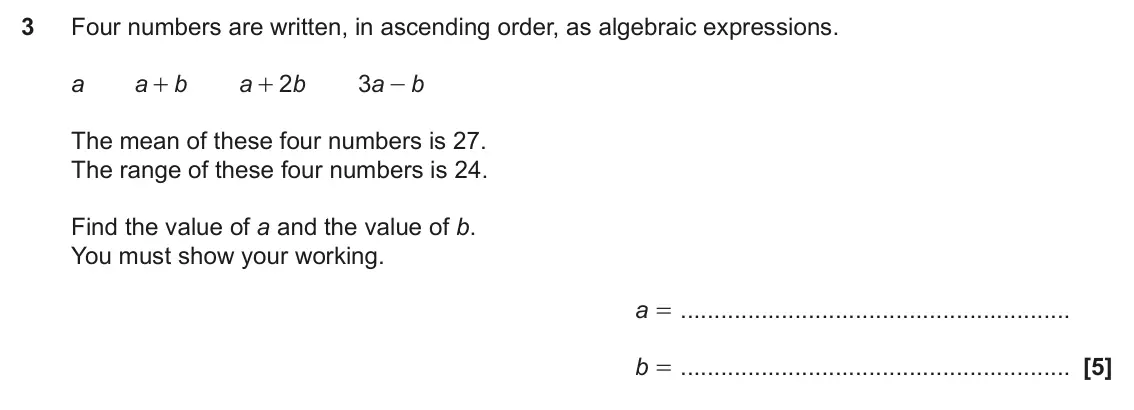
  4. June 2024 Paper 4, question 3: Four numbers are written, in ascending order, as algebraic expressions. a a b a 2 b 3 - a b + + The mean of these four numbers is 27. The range of these four nu
  5. Q17

    June 2024 · Paper 4

    The whole paper ↗
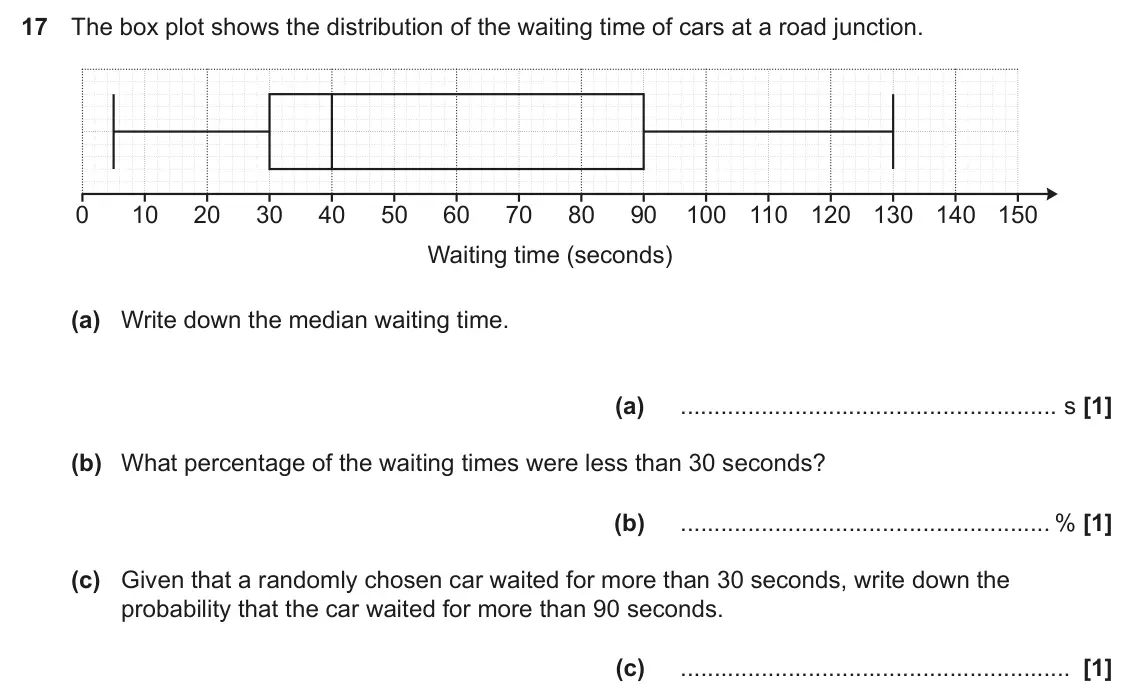
    June 2024 Paper 4, question 17: The box plot shows the distribution of the waiting time of cars at a road junction. 0 10 20 30 40 50 60 70 80 90 100 110 120 130 140 150 Waiting time (seconds)
  6. Q16

    November 2023 · Paper 5

    The whole paper ↗
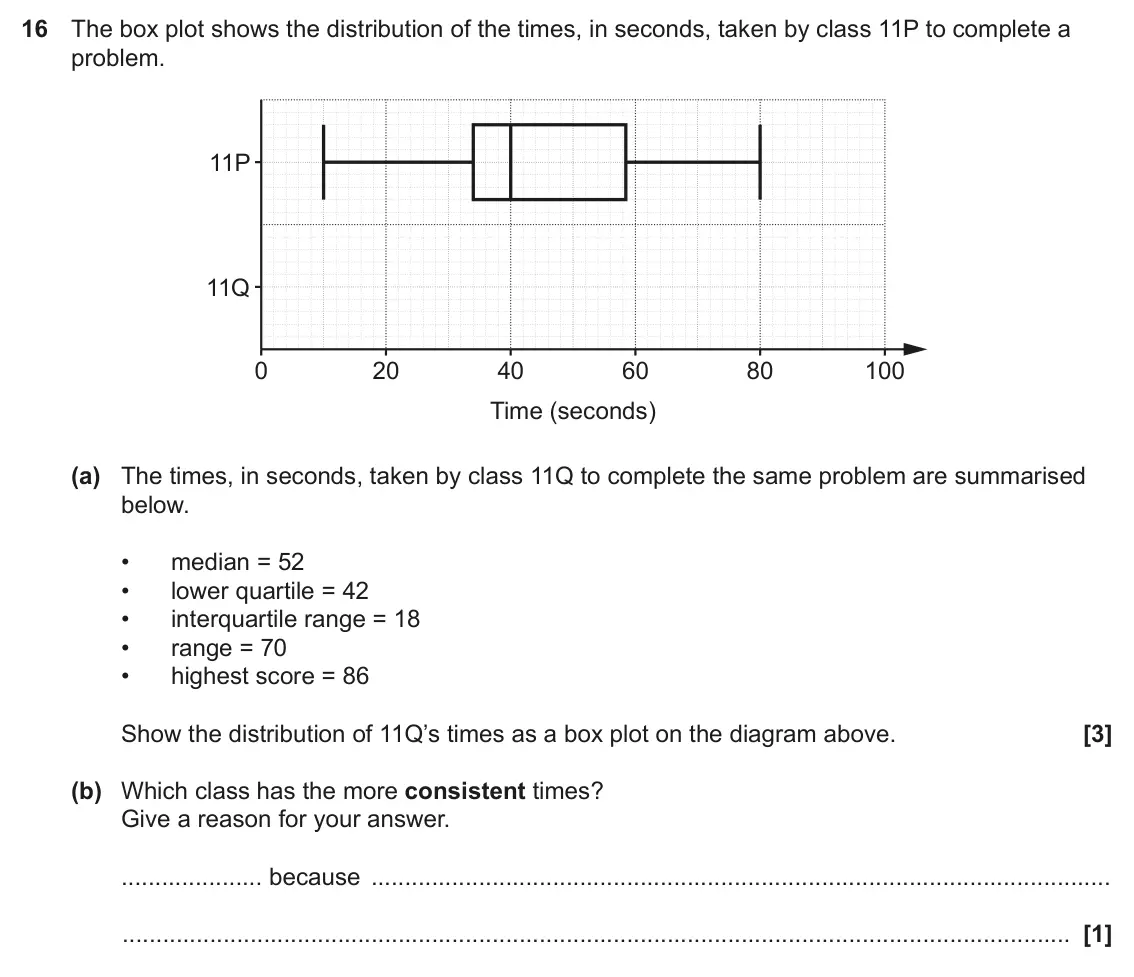
    November 2023 Paper 5, question 16: The box plot shows the distribution of the times, in seconds, taken by class 11P to complete a problem. 11P 11Q 0 20 40 60 80 100 Time (seconds) (a) The times,
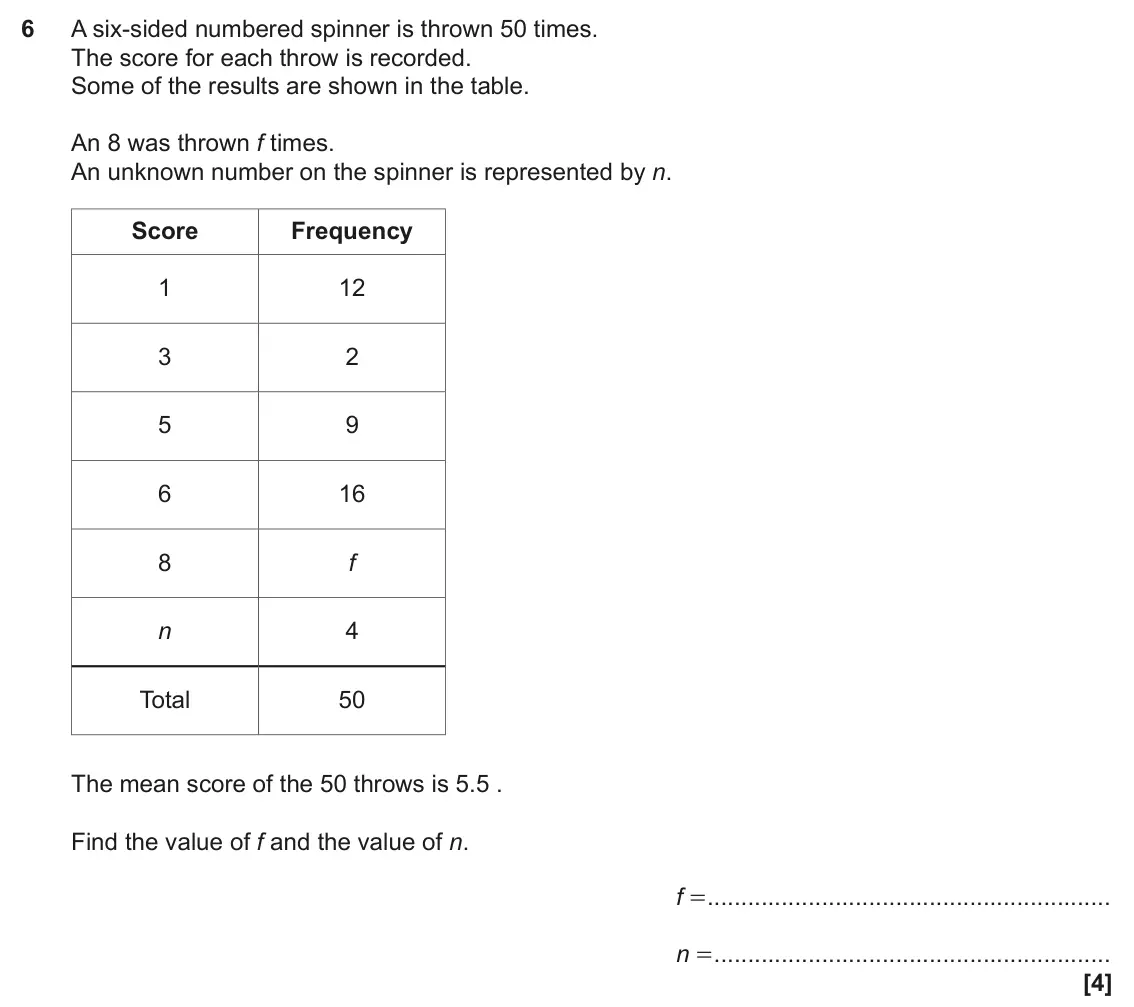
  7. June 2023 Paper 4, question 6: A six-sided numbered spinner is thrown 50 times. The score for each throw is recorded. Some of the results are shown in the table. An 8 was thrown f times. An u
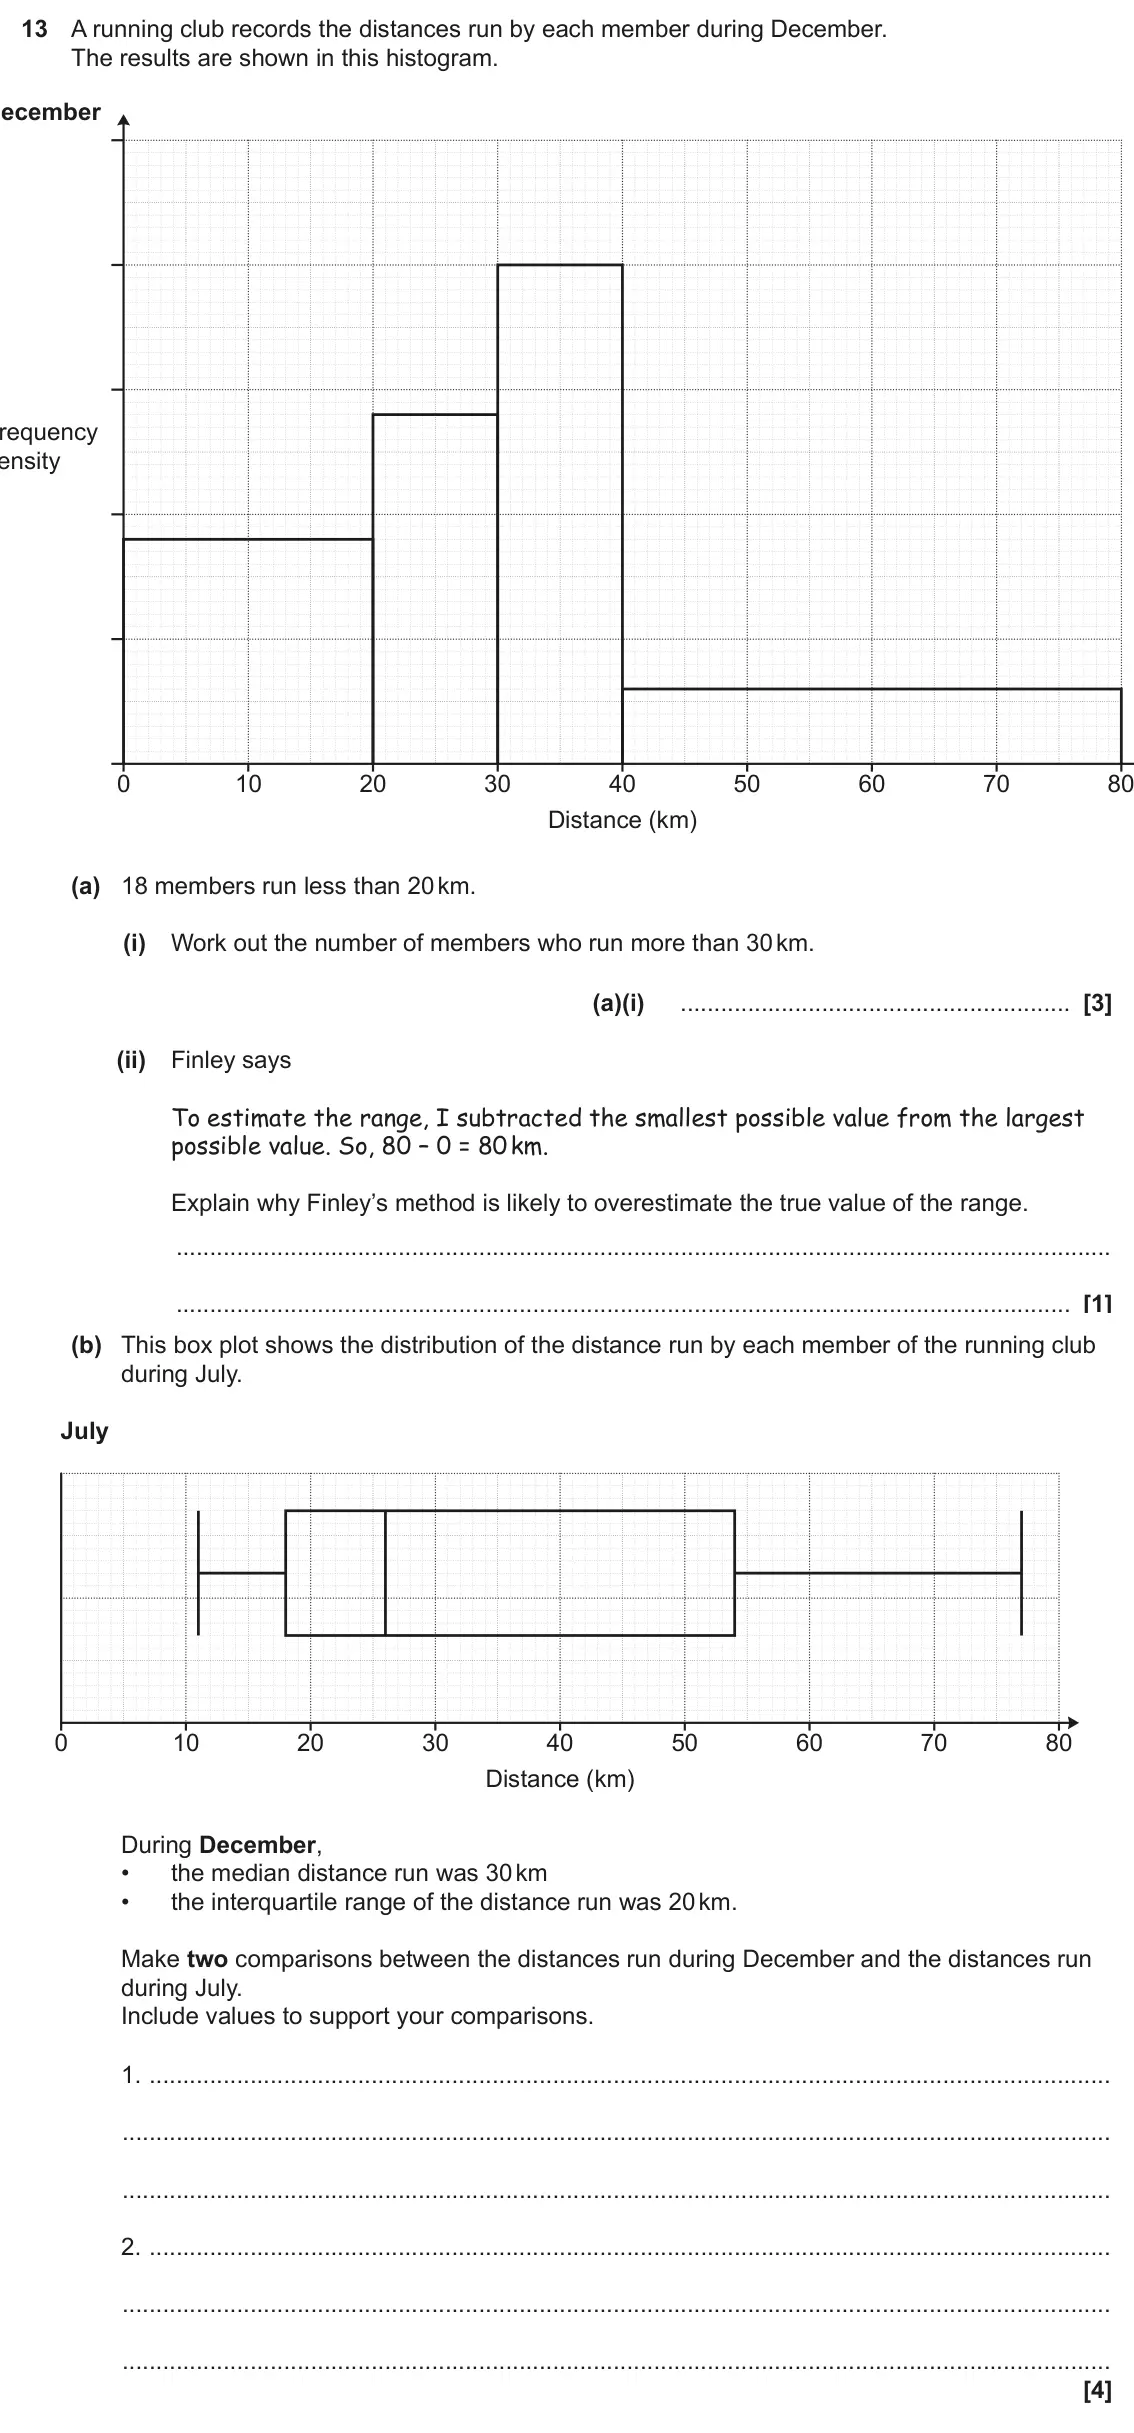
  8. June 2023 Paper 6, question 13: A running club records the distances run by each member during December. The results are shown in this histogram. December Frequency density 0 10 20 30 40 50 60
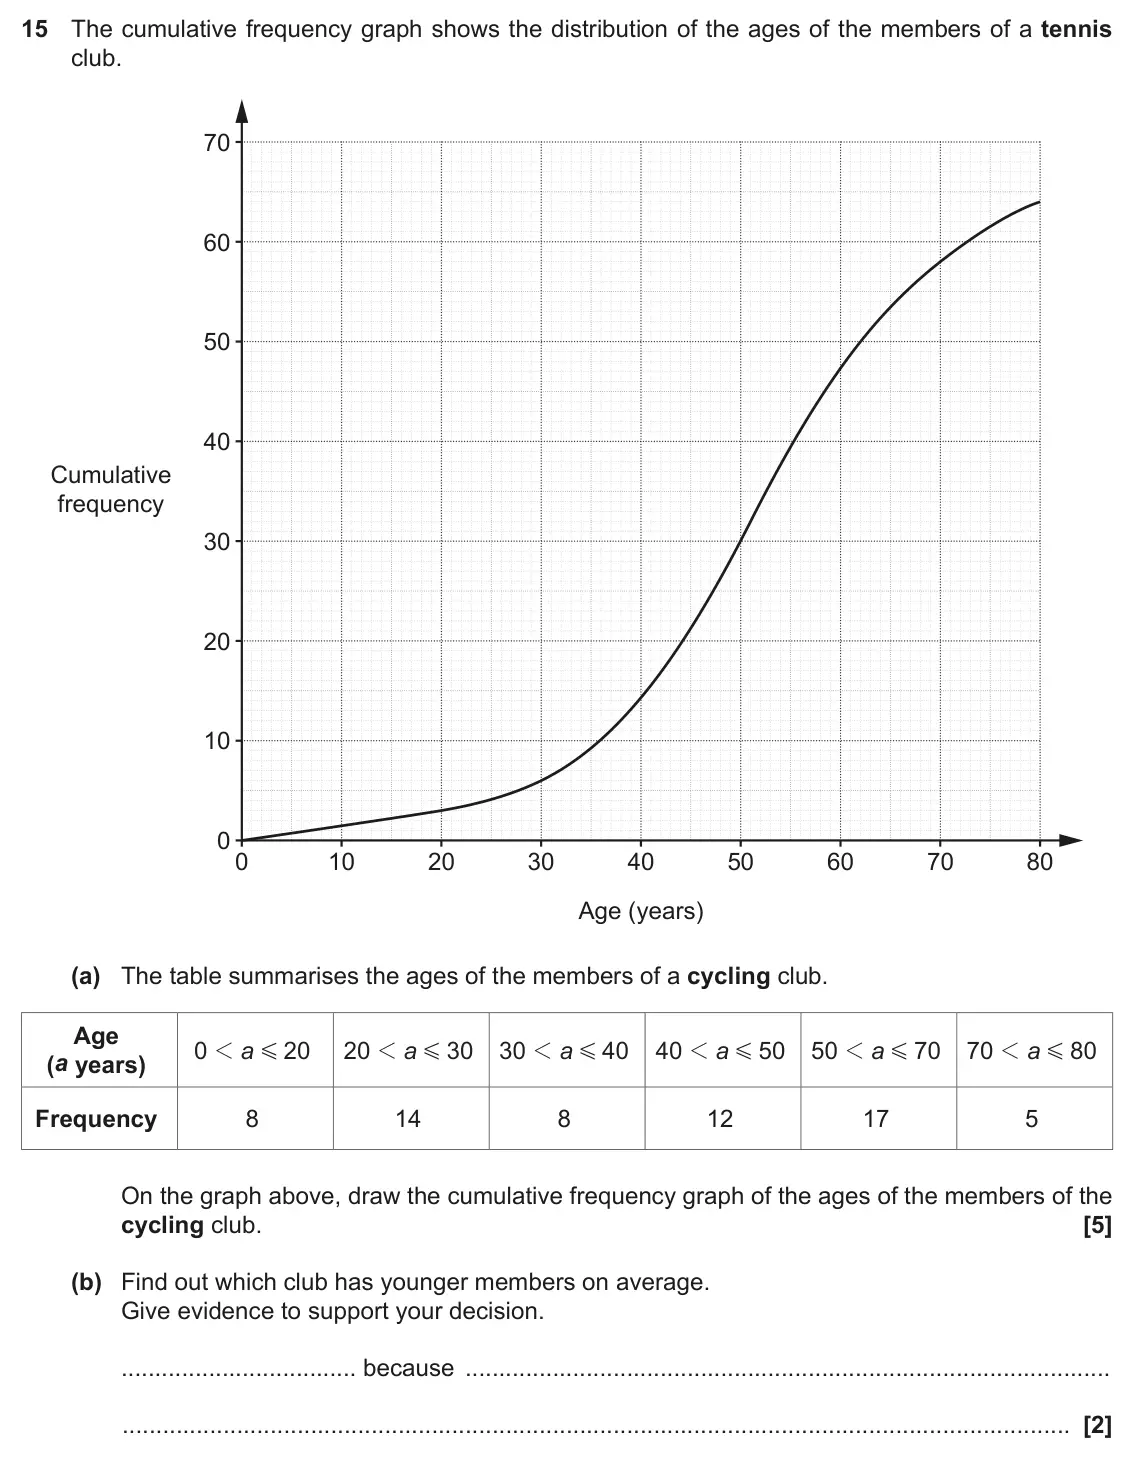
  9. November 2022 Paper 4, question 15: The cumulative frequency graph shows the distribution of the ages of the members of a tennis club. 70 60 50 40 Cumulative frequency 30 20 10 0 0 10 20 30 40 50
  10. Q17

    November 2022 · Paper 6

    The whole paper ↗
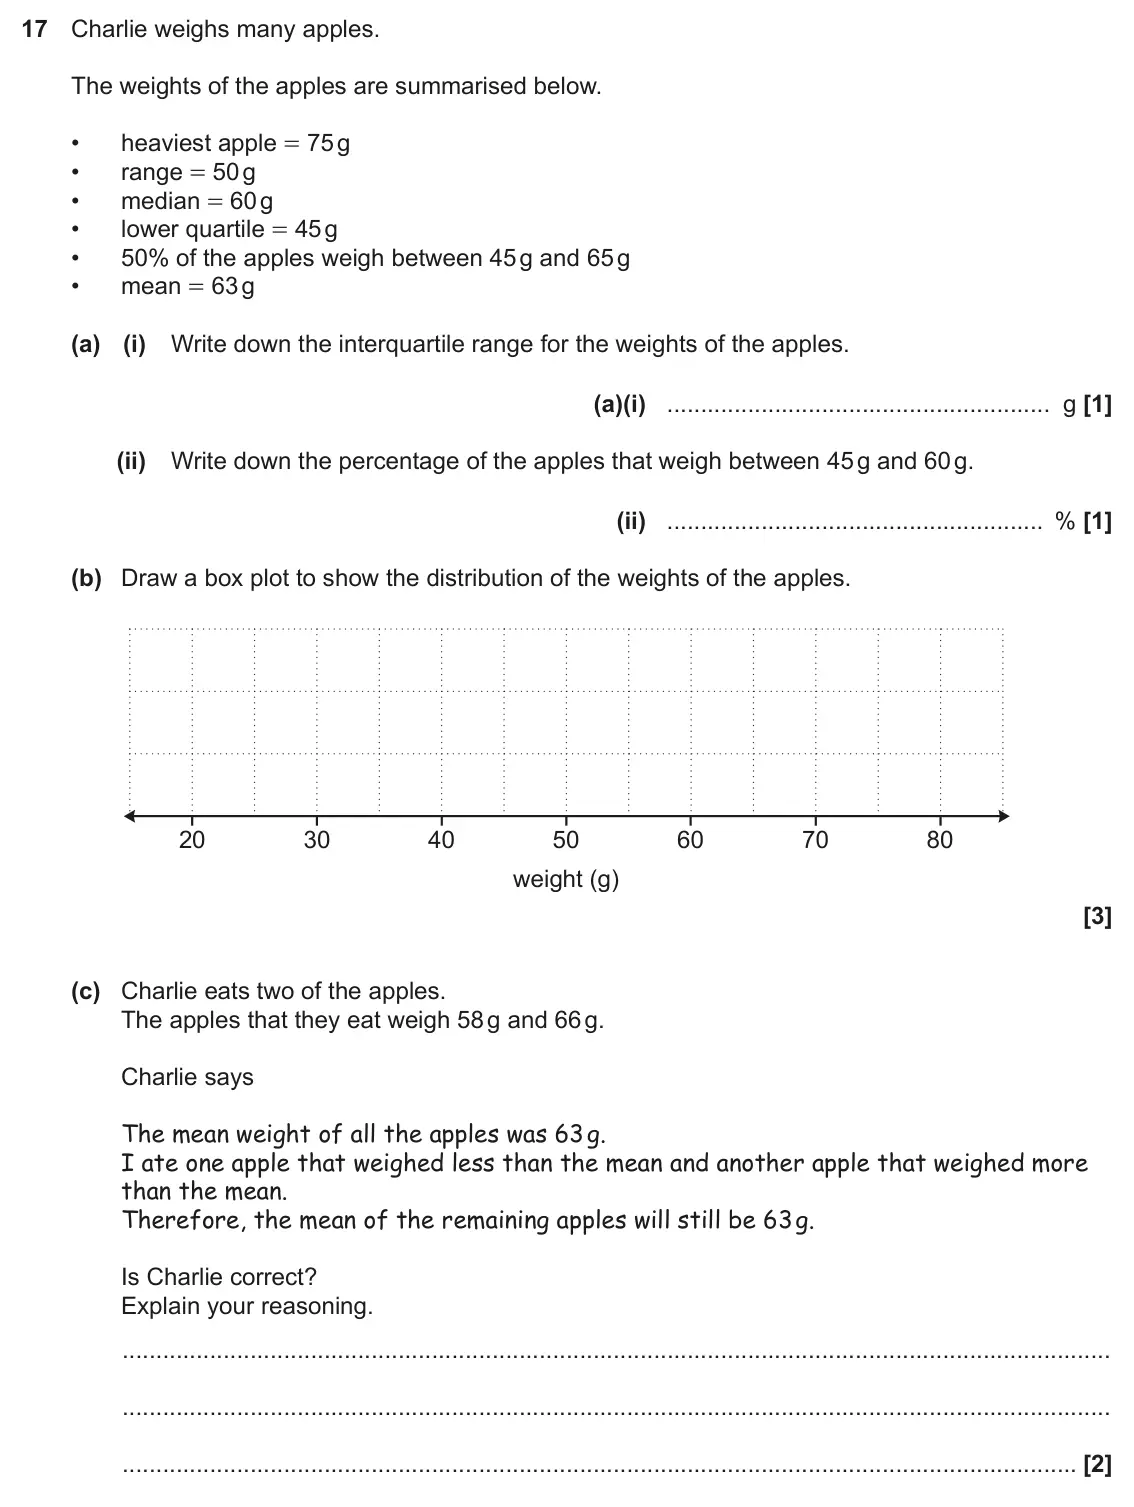
    November 2022 Paper 6, question 17: Charlie weighs many apples. The weights of the apples are summarised below. • heaviest apple = 75 g • range = 50 g • median = 60 g • lower quartile = 45 g • 50%
  11. Q12

    November 2021 · Paper 5

    The whole paper ↗
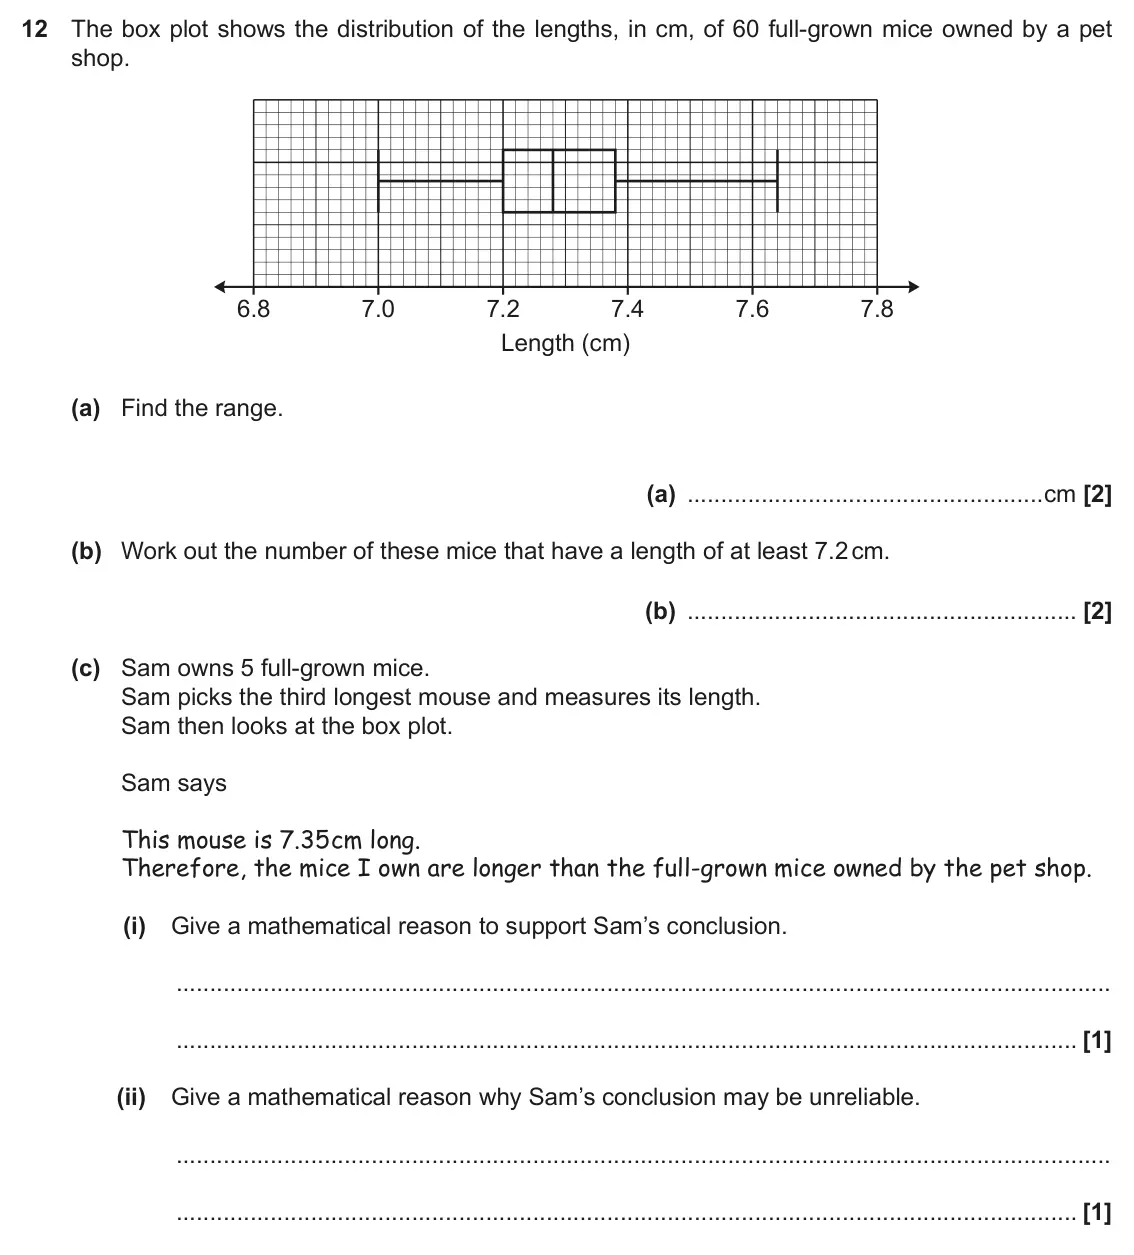
    November 2021 Paper 5, question 12: The box plot shows the distribution of the lengths, in cm, of 60 full-grown mice owned by a pet shop. 6.8 7.0 7.2 7.4 7.6 7.8 Length (cm) (a) Find the range. (a
  12. Q13

    November 2020 · Paper 4

    The whole paper ↗
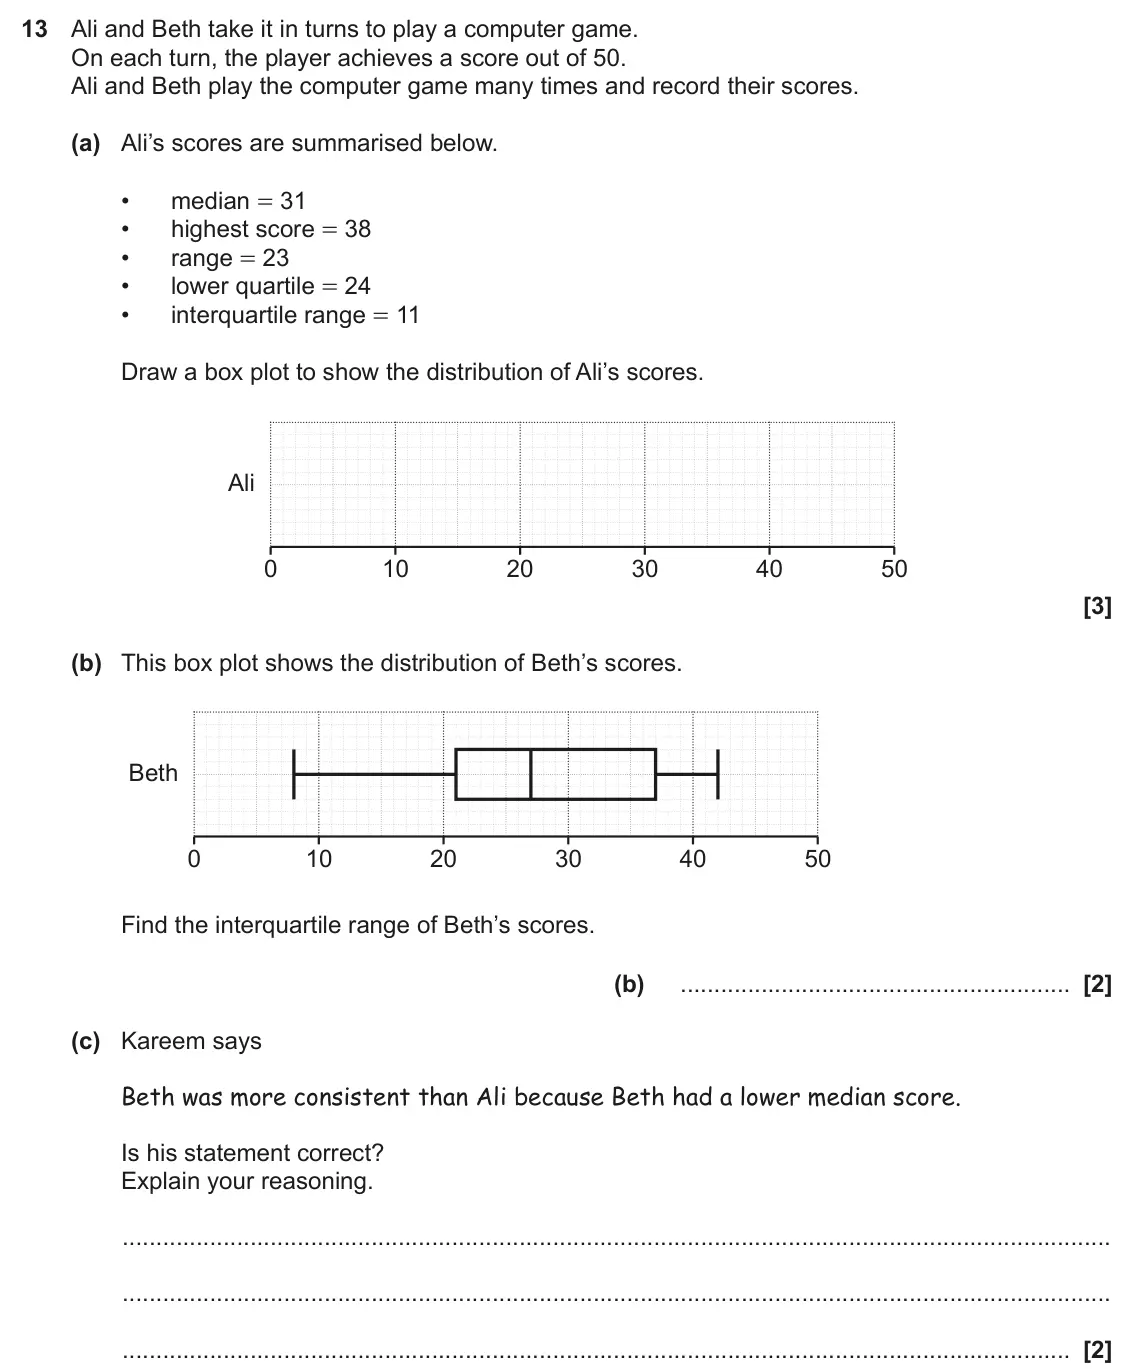
    November 2020 Paper 4, question 13: Ali and Beth take it in turns to play a computer game. On each turn, the player achieves a score out of 50. Ali and Beth play the computer game many times and r
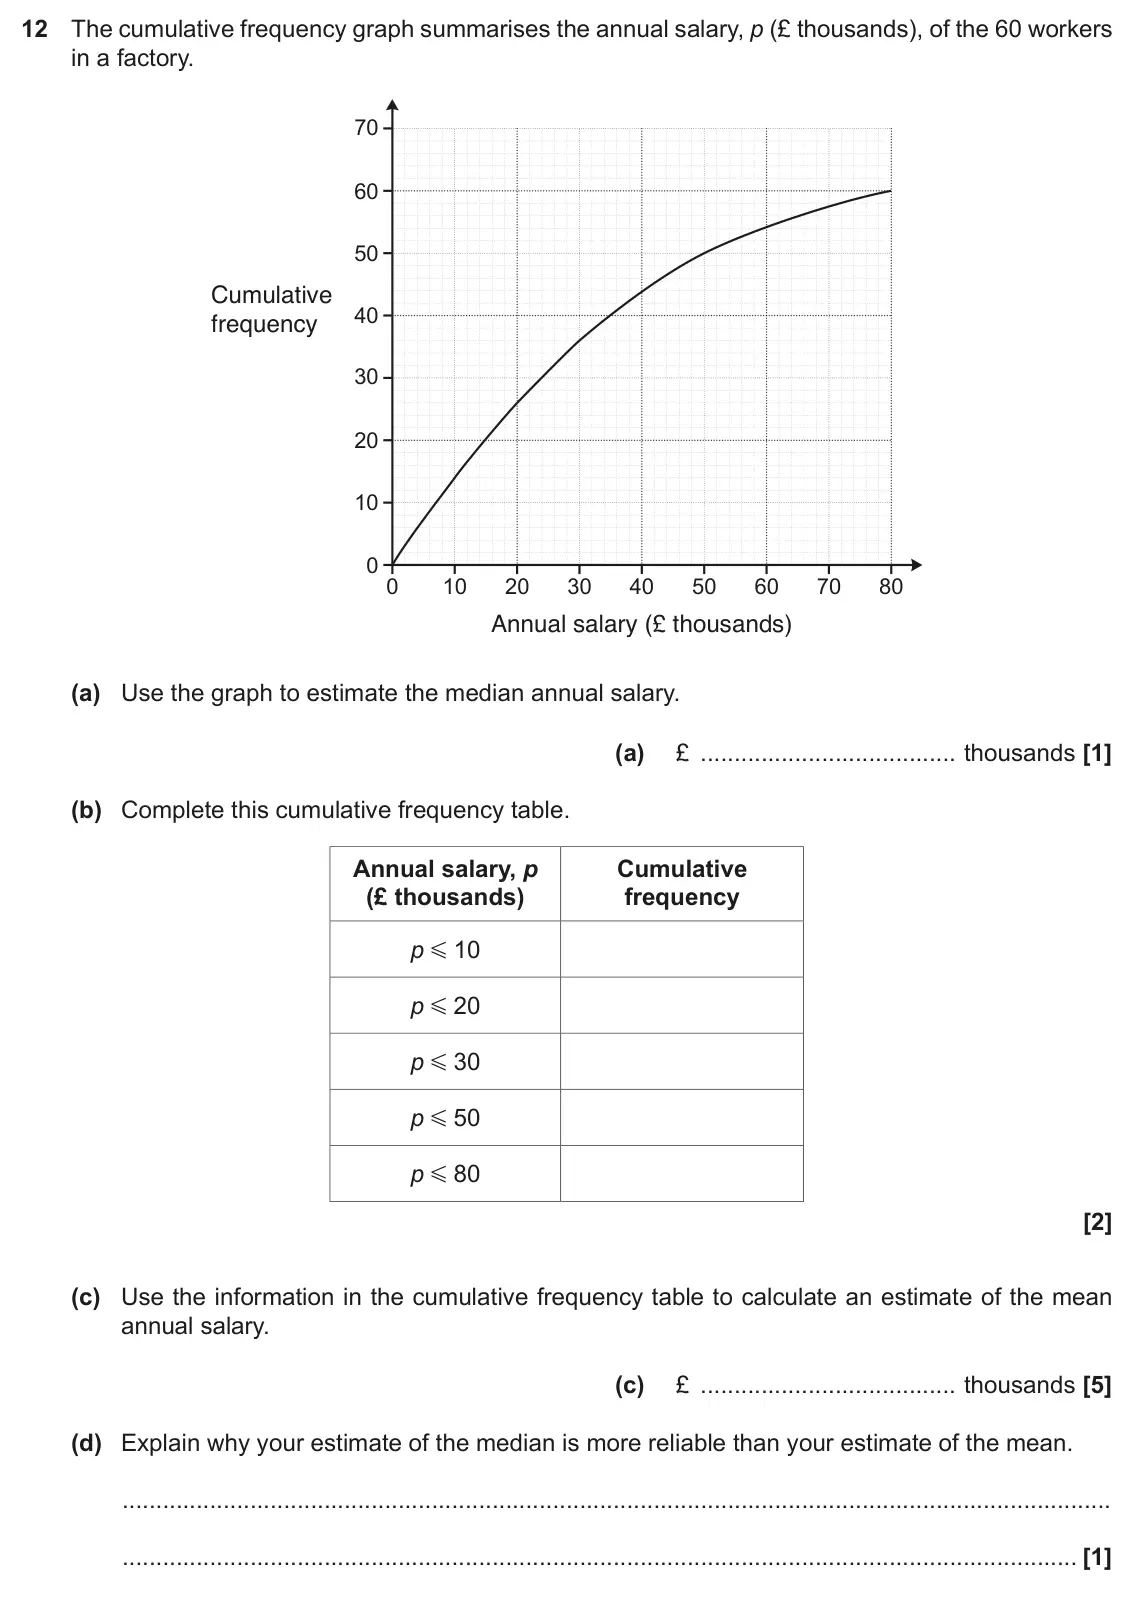
  13. November 2019 Paper 4, question 12: The cumulative frequency graph summarises the annual salary, p (£ thousands), of the 60 workers in a factory. 70 60 50 Cumulative 40 frequency 30 20 10 0 0 10 2
  14. Q12

    November 2019 · Paper 5

    The whole paper ↗
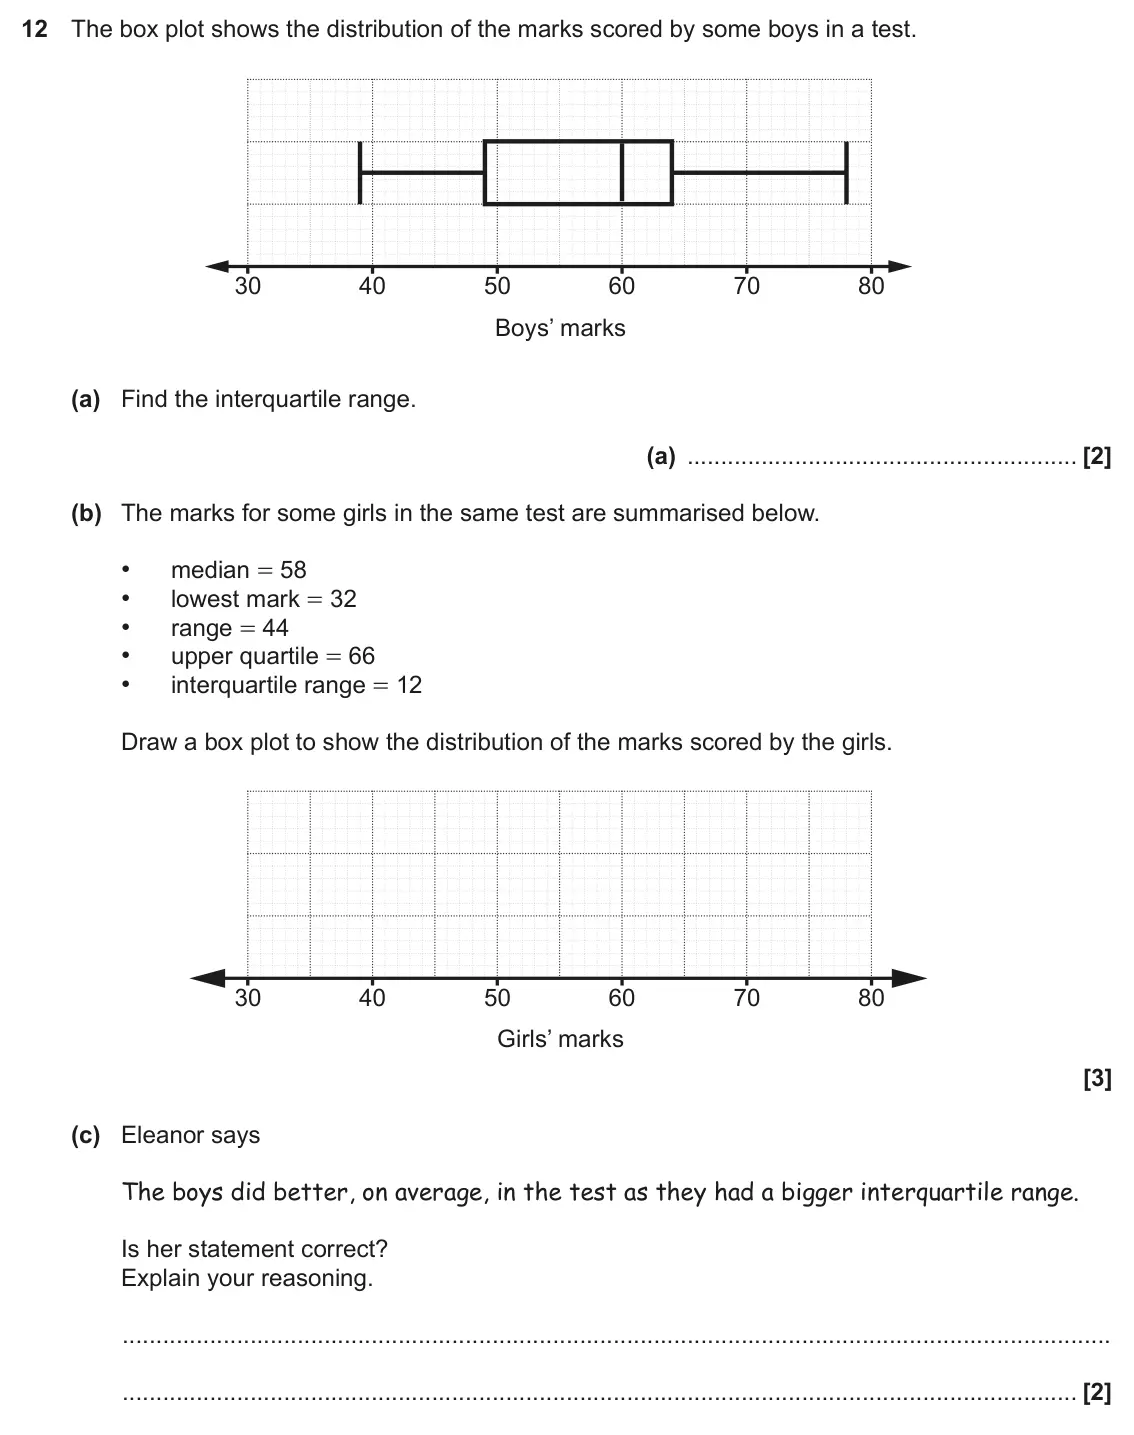
    November 2019 Paper 5, question 12: The box plot shows the distribution of the marks scored by some boys in a test. 30 40 50 60 70 80 Boys’ marks (a) Find the interquartile range. (a) (b) The mark
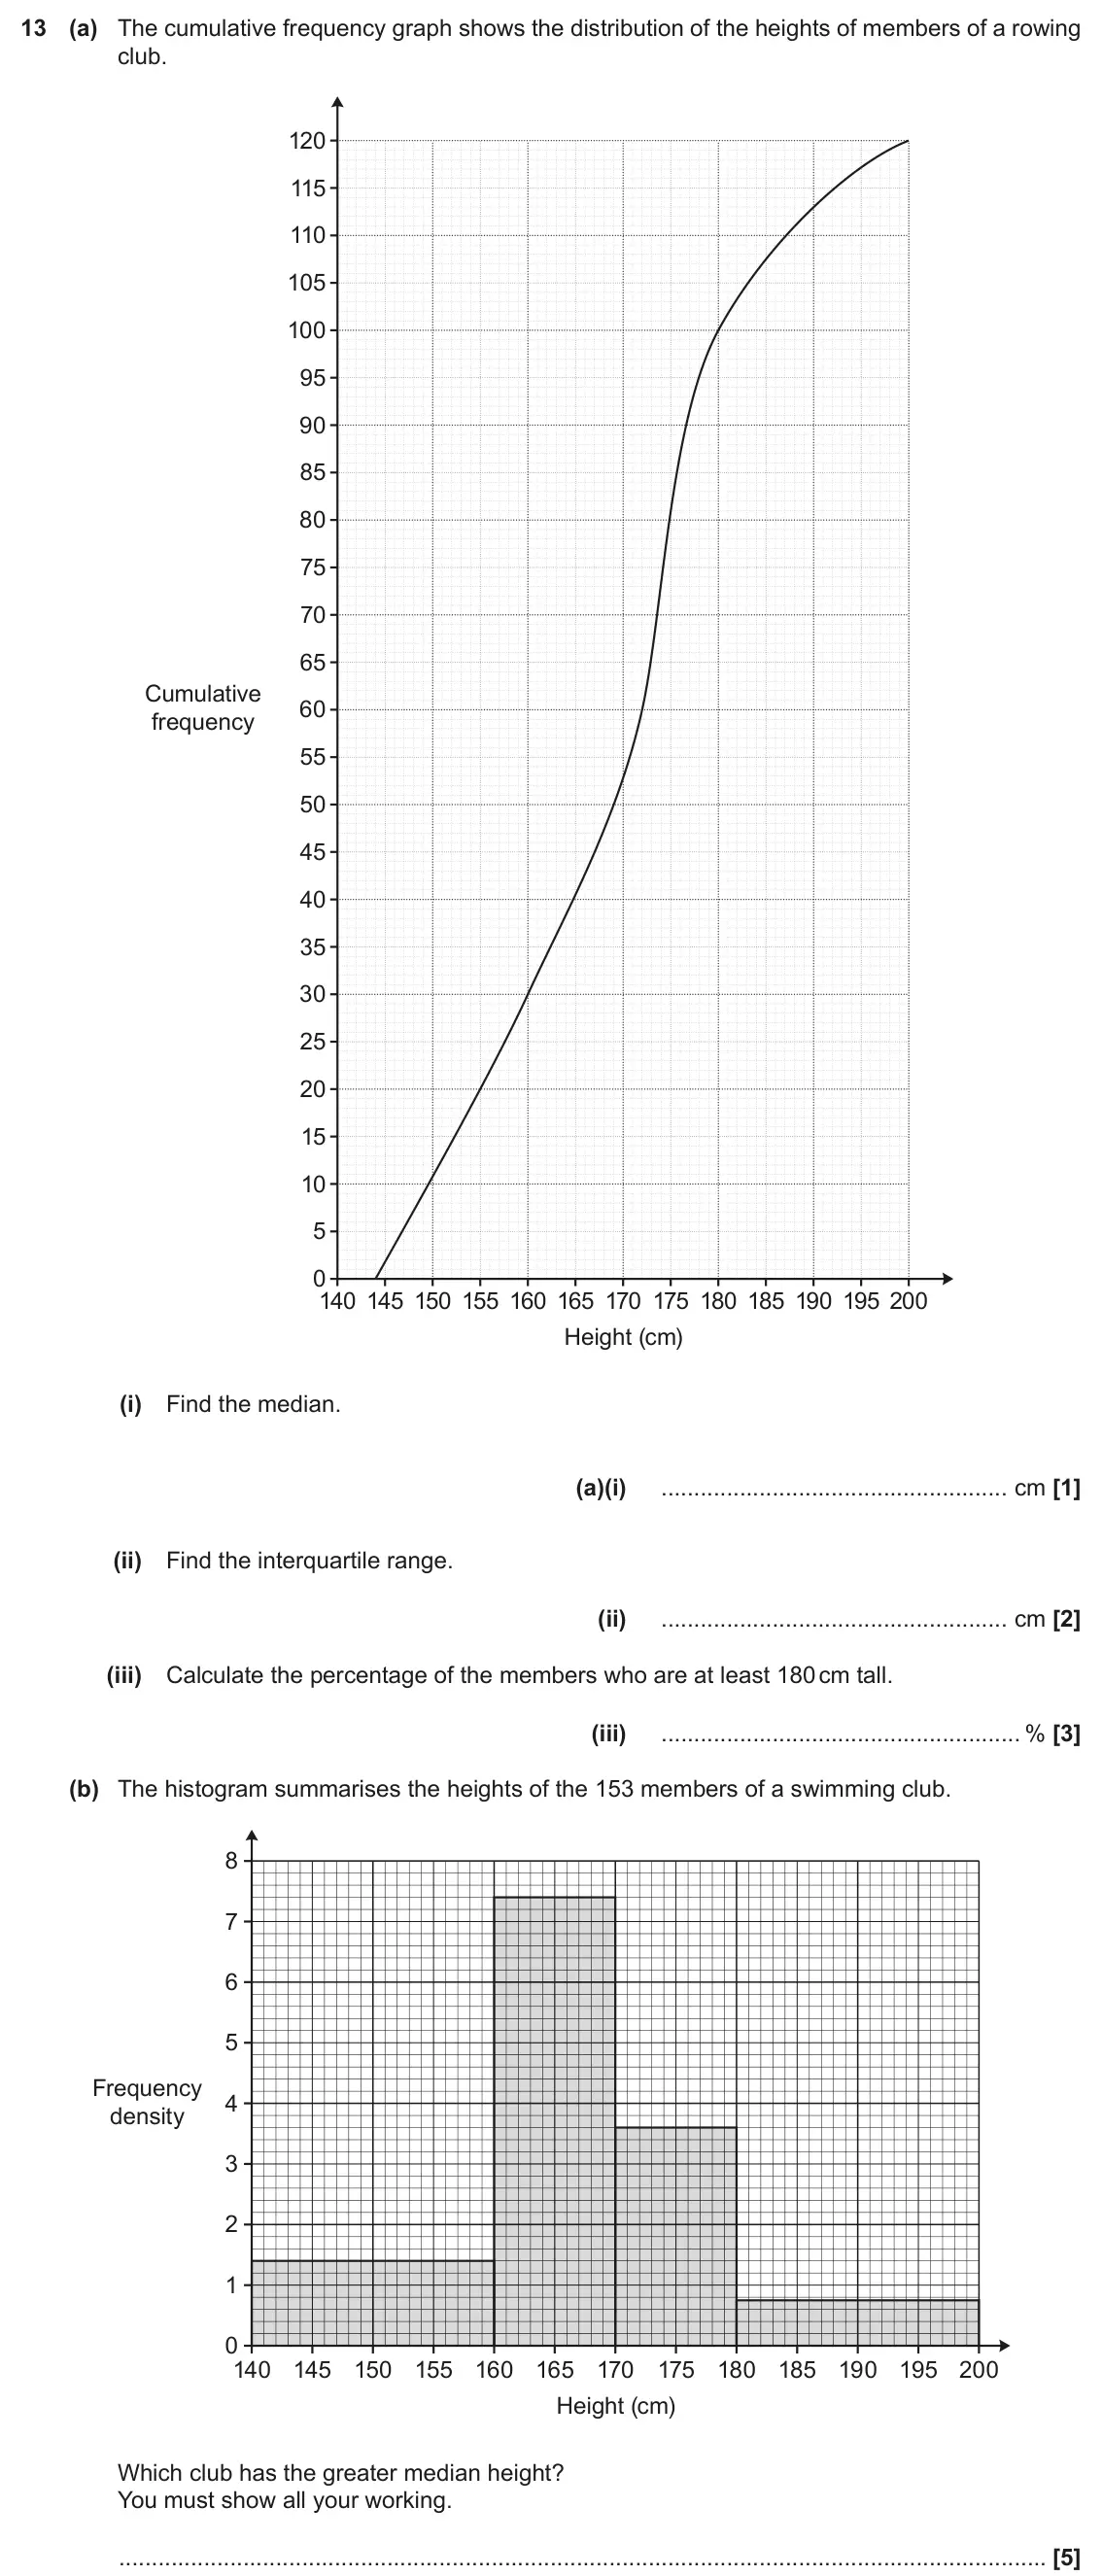
  15. June 2019 Paper 4, question 13: (a) The cumulative frequency graph shows the distribution of the heights of members of a rowing club. 120 115 110 105 100 95 90 85 80 75 70 65 Cumulative 60 fre
  16. Q15

    November 2018 · Paper 4

    The whole paper ↗
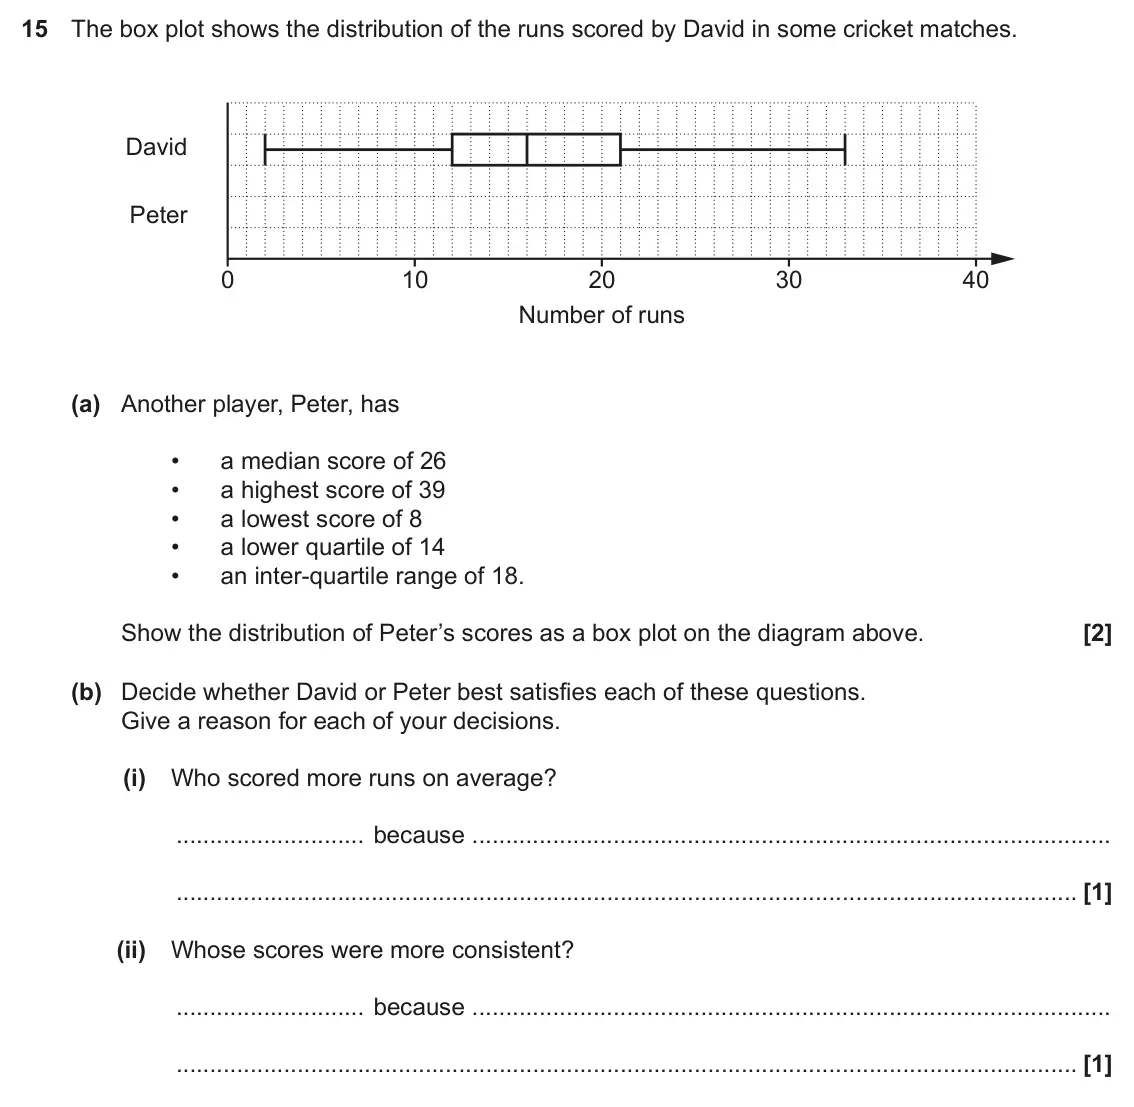
    November 2018 Paper 4, question 15: The box plot shows the distribution of the runs scored by David in some cricket matches. David Peter 0 10 20 30 40 Number of runs (a) Another player, Peter, has
  17. Q2

    November 2018 · Paper 6

    The whole paper ↗
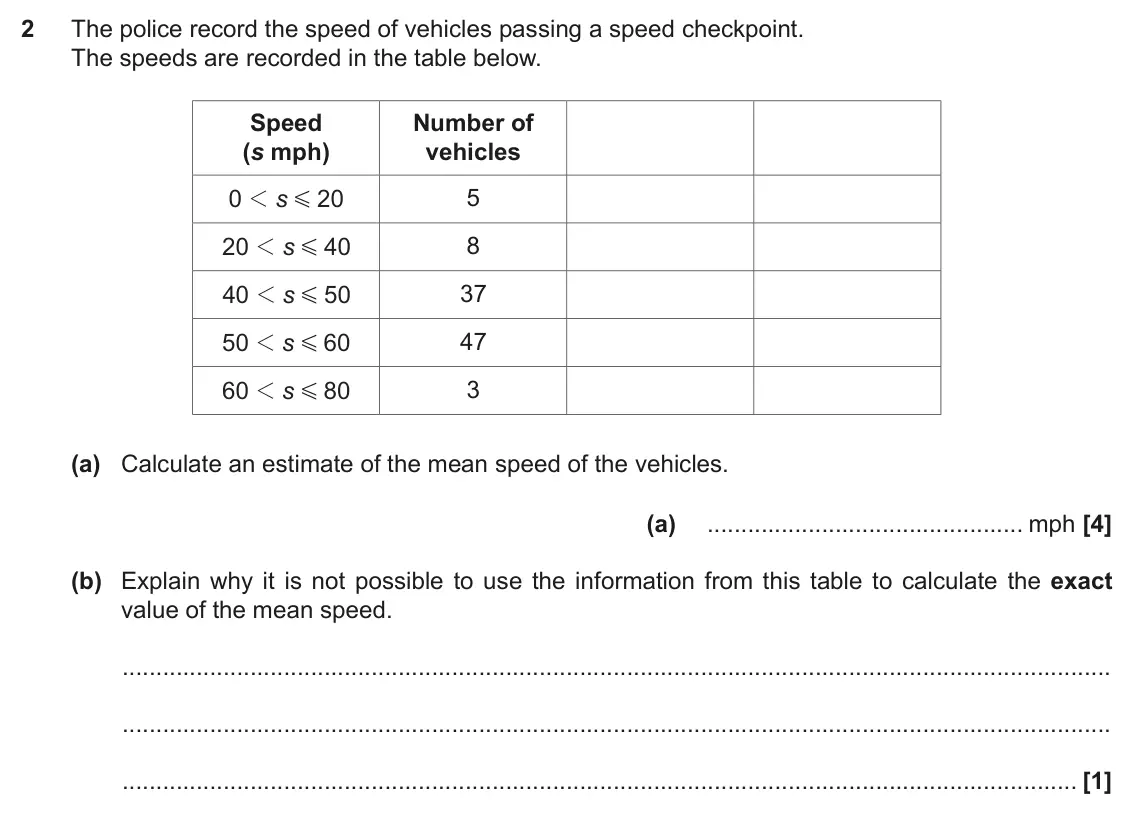
    November 2018 Paper 6, question 2: The police record the speed of vehicles passing a speed checkpoint. The speeds are recorded in the table below. Speed Number of (s mph) vehicles 0 20 5 1 s G 8
  18. Q1

    June 2018 · Paper 6

    The whole paper ↗
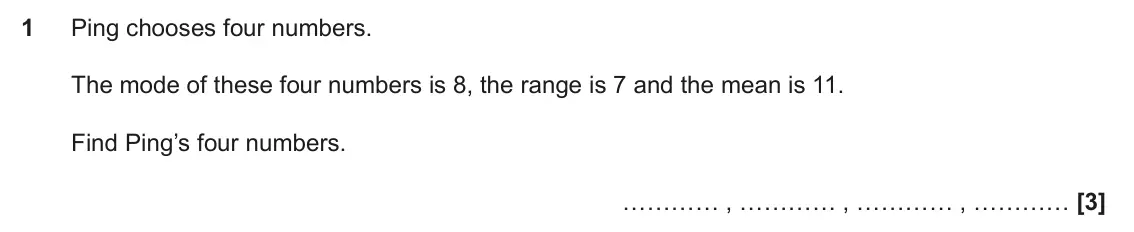
    June 2018 Paper 6, question 1: Ping chooses four numbers. The mode of these four numbers is 8, the range is 7 and the mean is 11. Find Ping’s four numbers. ………… , ………… , ………… , …………
  19. Q16

    June 2018 · Paper 6

    The whole paper ↗
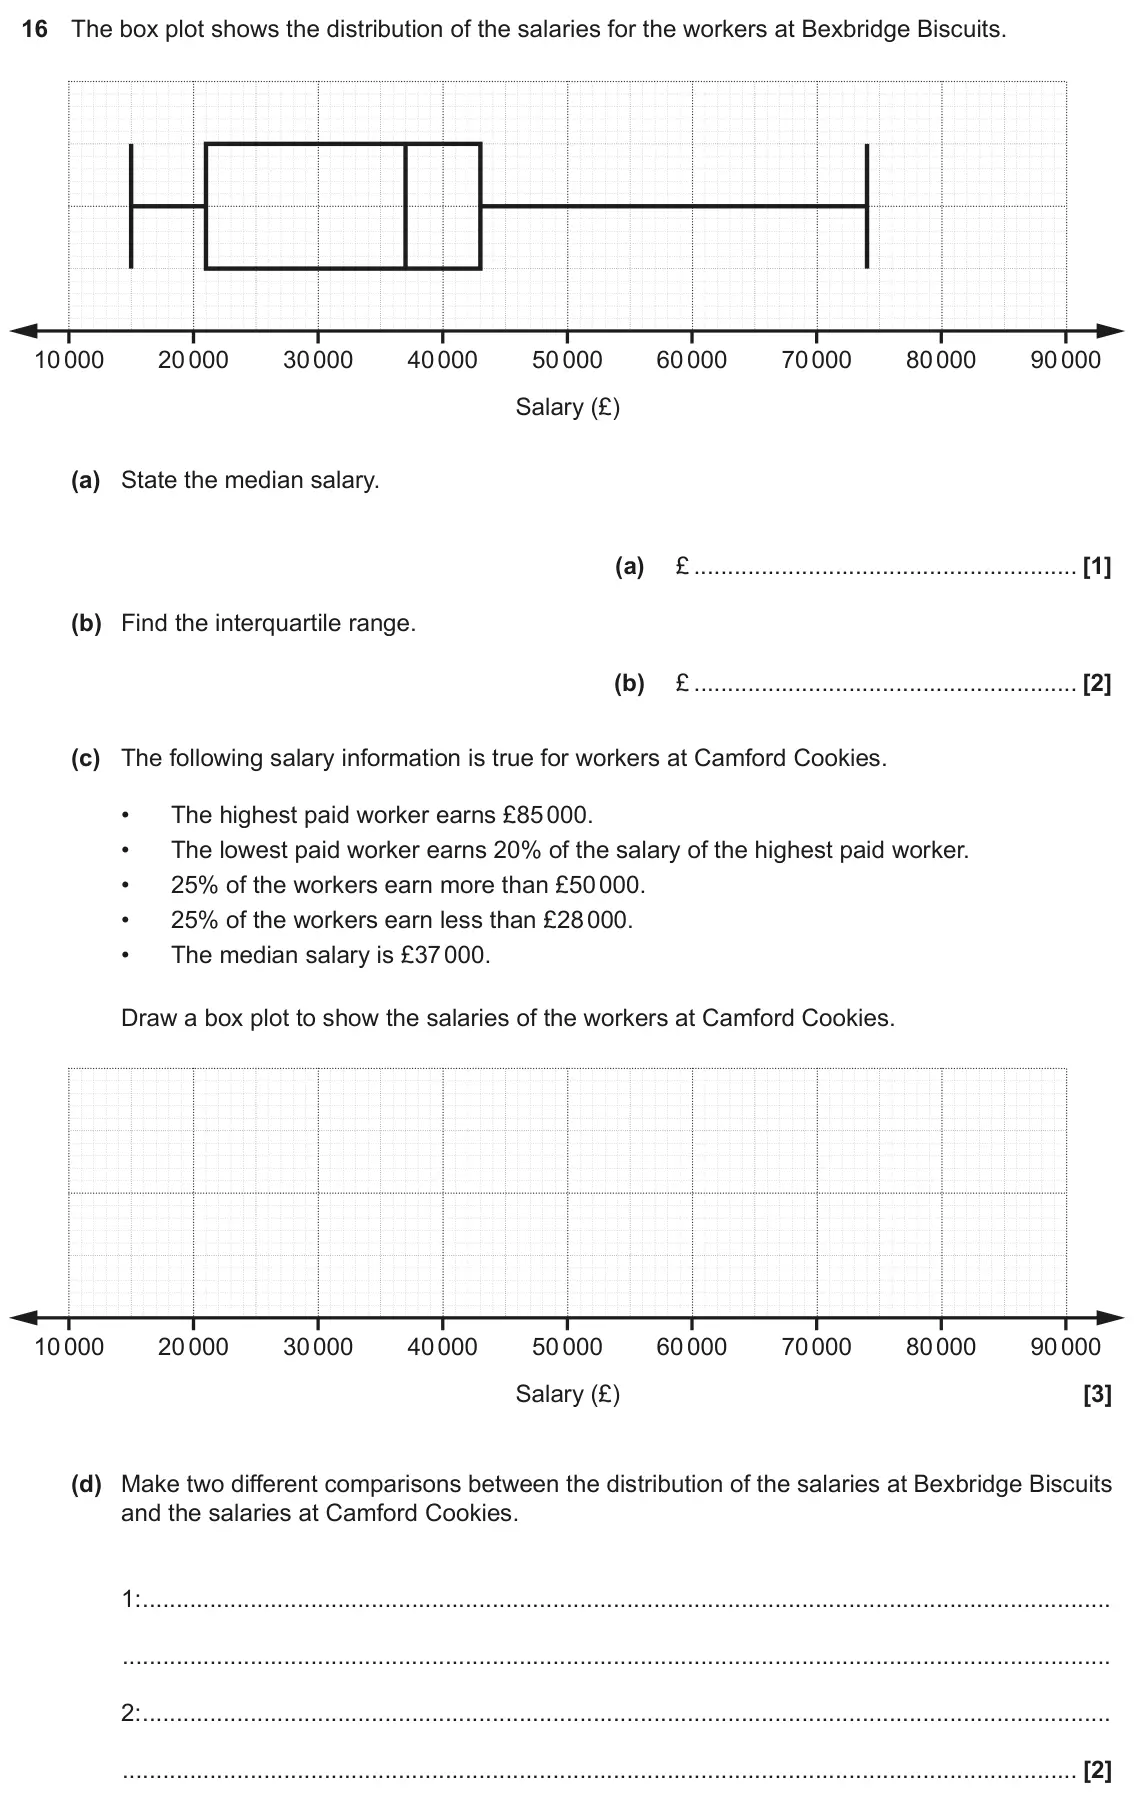
    June 2018 Paper 6, question 16: The box plot shows the distribution of the salaries for the workers at Bexbridge Biscuits. 10 000 20 000 30 000 40 000 50 000 60 000 70 000 80 000 90 000 Salary
  20. Q3

    November 2017 · Paper 6

    The whole paper ↗
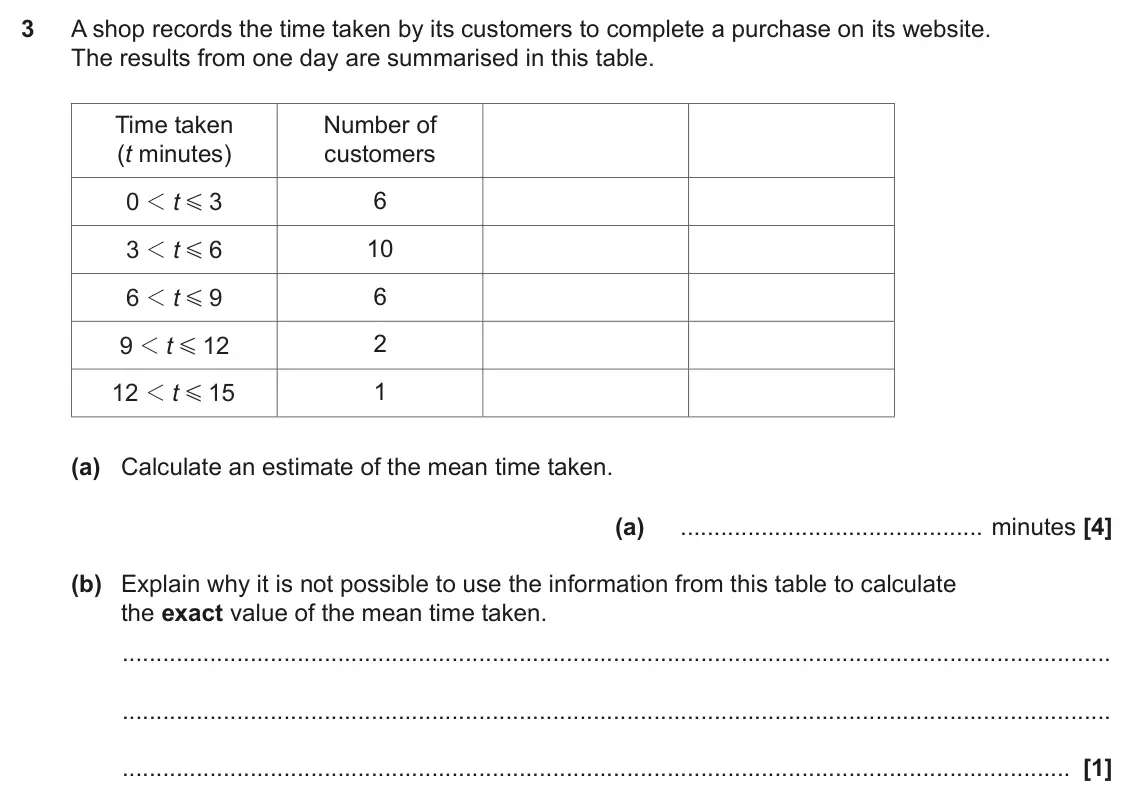
    November 2017 Paper 6, question 3: A shop records the time taken by its customers to complete a purchase on its website. The results from one day are summarised in this table. Time taken Number o
All 21 questions on Averages, spread and box plots, as a list
  1. June 2025, Paper 4, Q14 (5 marks): The cumulative frequency graph shows the distribution of the examination scores for 120 students. 120 100 80 Cumulative frequency 60 40 20 0 0 10 20 30 40 50 60
  2. June 2025, Paper 6, Q17 (3 marks): Two Year 11 classes, 11G and 11K, record their times for a race. The box plots show the distribution of the times, in seconds, for each class. 11G 11K 11 12 13
  3. November 2024, Paper 6, Q4 (5 marks): A farmer has 60 pear trees. The table shows the heights, h metres, of the pear trees. Height (h metres) Frequency 1 2 5 1 h G 8 2 1 h 3 G 32 3 1 h 4 G 15 4 1 h
  4. June 2024, Paper 4, Q3 (5 marks): Four numbers are written, in ascending order, as algebraic expressions. a a b a 2 b 3 - a b + + The mean of these four numbers is 27. The range of these four nu
  5. June 2024, Paper 4, Q17 (3 marks): The box plot shows the distribution of the waiting time of cars at a road junction. 0 10 20 30 40 50 60 70 80 90 100 110 120 130 140 150 Waiting time (seconds)
  6. November 2023, Paper 5, Q16 (4 marks): The box plot shows the distribution of the times, in seconds, taken by class 11P to complete a problem. 11P 11Q 0 20 40 60 80 100 Time (seconds) (a) The times,
  7. June 2023, Paper 4, Q6 (4 marks): A six-sided numbered spinner is thrown 50 times. The score for each throw is recorded. Some of the results are shown in the table. An 8 was thrown f times. An u
  8. June 2023, Paper 6, Q13 (8 marks): A running club records the distances run by each member during December. The results are shown in this histogram. December Frequency density 0 10 20 30 40 50 60
  9. November 2022, Paper 4, Q15 (7 marks): The cumulative frequency graph shows the distribution of the ages of the members of a tennis club. 70 60 50 40 Cumulative frequency 30 20 10 0 0 10 20 30 40 50
  10. November 2022, Paper 6, Q17 (7 marks): Charlie weighs many apples. The weights of the apples are summarised below. • heaviest apple = 75 g • range = 50 g • median = 60 g • lower quartile = 45 g • 50%
  11. November 2021, Paper 5, Q12 (6 marks): The box plot shows the distribution of the lengths, in cm, of 60 full-grown mice owned by a pet shop. 6.8 7.0 7.2 7.4 7.6 7.8 Length (cm) (a) Find the range. (a
  12. November 2020, Paper 4, Q13 (7 marks): Ali and Beth take it in turns to play a computer game. On each turn, the player achieves a score out of 50. Ali and Beth play the computer game many times and r
  13. November 2019, Paper 4, Q12 (9 marks): The cumulative frequency graph summarises the annual salary, p (£ thousands), of the 60 workers in a factory. 70 60 50 Cumulative 40 frequency 30 20 10 0 0 10 2
  14. November 2019, Paper 5, Q12 (7 marks): The box plot shows the distribution of the marks scored by some boys in a test. 30 40 50 60 70 80 Boys’ marks (a) Find the interquartile range. (a) (b) The mark
  15. June 2019, Paper 4, Q13 (11 marks): (a) The cumulative frequency graph shows the distribution of the heights of members of a rowing club. 120 115 110 105 100 95 90 85 80 75 70 65 Cumulative 60 fre
  16. November 2018, Paper 4, Q15 (4 marks): The box plot shows the distribution of the runs scored by David in some cricket matches. David Peter 0 10 20 30 40 Number of runs (a) Another player, Peter, has
  17. November 2018, Paper 6, Q2 (5 marks): The police record the speed of vehicles passing a speed checkpoint. The speeds are recorded in the table below. Speed Number of (s mph) vehicles 0 20 5 1 s G 8
  18. June 2018, Paper 6, Q1 (3 marks): Ping chooses four numbers. The mode of these four numbers is 8, the range is 7 and the mean is 11. Find Ping’s four numbers. ………… , ………… , ………… , …………
  19. June 2018, Paper 6, Q16 (8 marks): The box plot shows the distribution of the salaries for the workers at Bexbridge Biscuits. 10 000 20 000 30 000 40 000 50 000 60 000 70 000 80 000 90 000 Salary
  20. November 2017, Paper 6, Q3 (5 marks): A shop records the time taken by its customers to complete a purchase on its website. The results from one day are summarised in this table. Time taken Number o
  21. June 2017, Paper 5, Q6 (4 marks): Jenny played four games of golf. For these games her modal score was 76 and her mean score was 75. Her range of scores was 10. What were her scores for the four

Questions, mark schemes and examiner’s reports are © OCR, from their published past papers. Plumi isn’t affiliated with any exam board. Want whole papers? Every OCR GCSE Maths paper.

Rather write your answers by hand on iPad? Plumi marks them against the same mark schemes.