 plumi
How are populations affected by the conditions in an ecosystem?: OCR GCSE Combined Science B questions
Every OCR GCSE Combined Science B exam question on B3.4 How are populations affected by the conditions in an ecosystem?, 2018–2025, with its mark scheme and examiner’s report.
Paper
All papers
Exam
All years
Calculations
Q3(a)
The whole paper ↗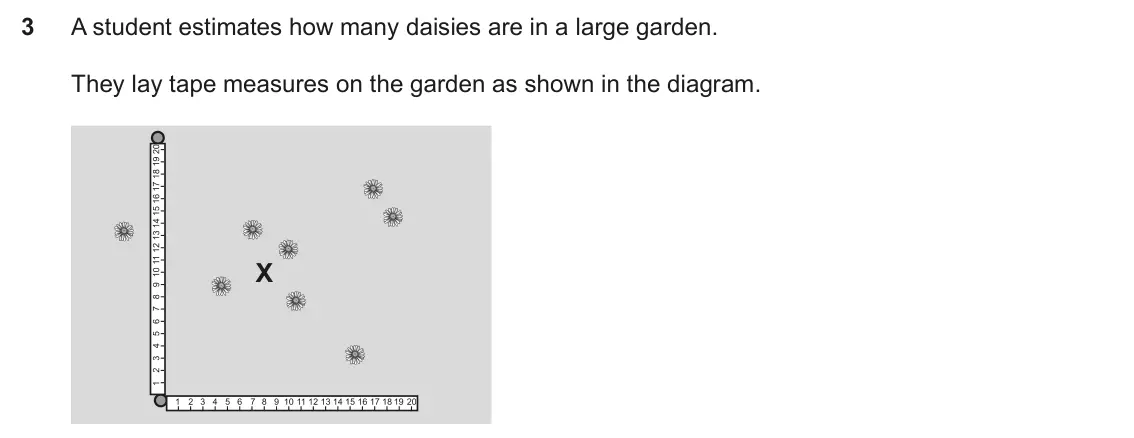
Q3(b)(i)
The whole paper ↗Q3(b)(ii)
The whole paper ↗Q3(b)(iii)
The whole paper ↗Q3(b)(iv)
The whole paper ↗Q3(c)(i)
The whole paper ↗Q3(c)(ii)
The whole paper ↗Q3(d)
The whole paper ↗Q4(b)(iii)
The whole paper ↗
Q6(a)
The whole paper ↗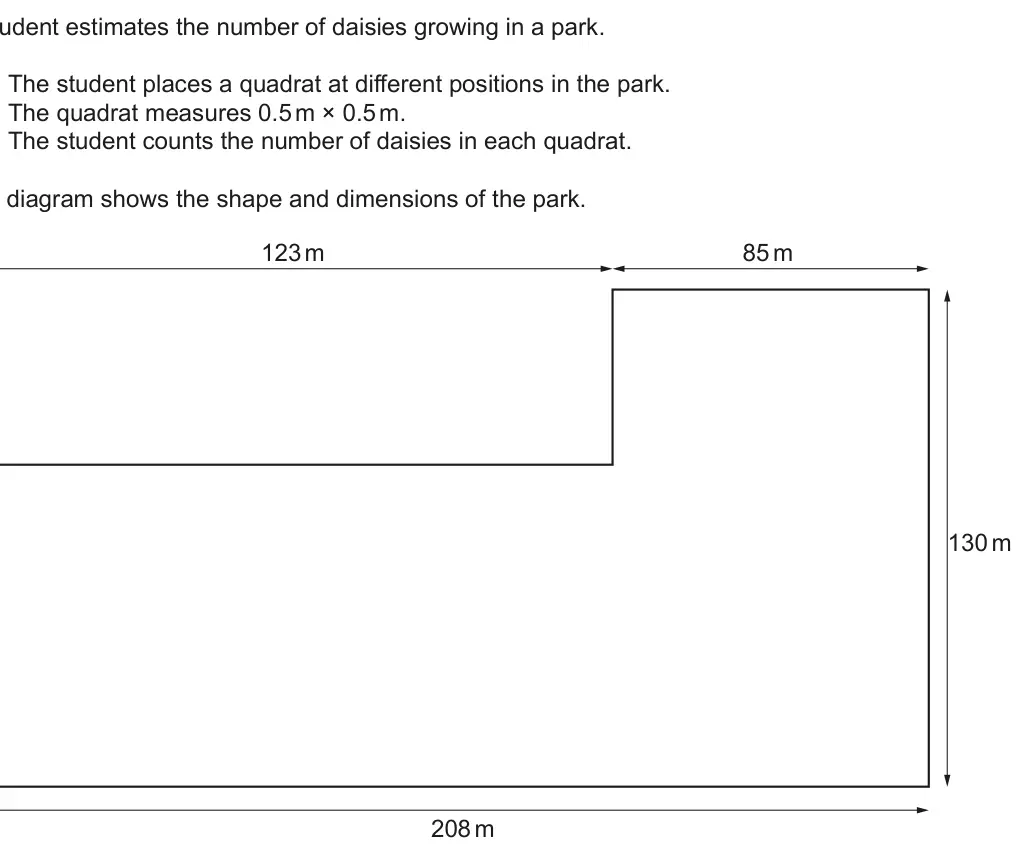
Q6(b)
The whole paper ↗Q5(b)(i)
The whole paper ↗Q5(c)
The whole paper ↗Q5(d)
The whole paper ↗Q5(e)
The whole paper ↗Q5(f)
The whole paper ↗Q5(c)(i)
The whole paper ↗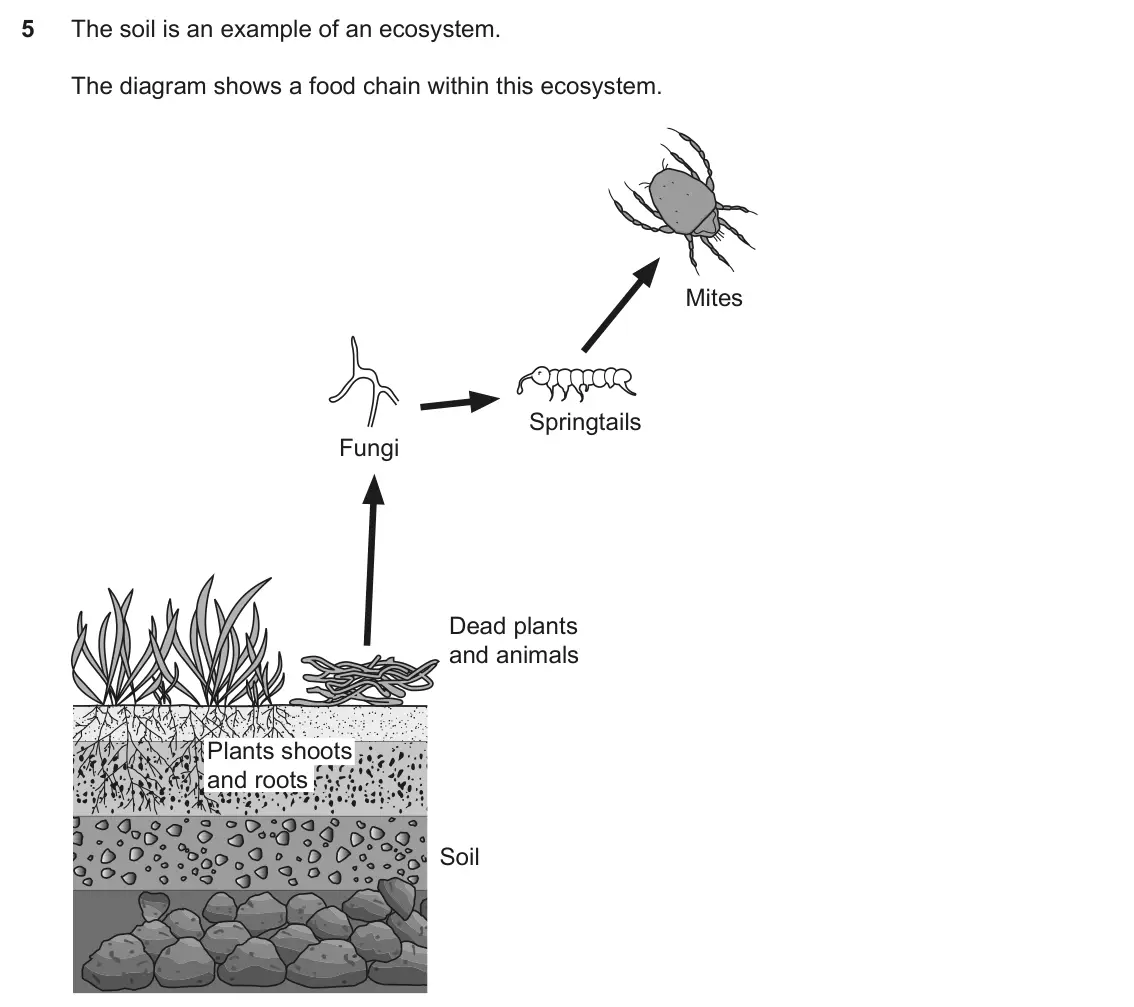
Q5(c)(ii)
The whole paper ↗Q8(a)
The whole paper ↗
Q8(b)
The whole paper ↗
All 42 questions on How are populations affected by the conditions in an ecosystem?, as a list
- June 2025, Biology Paper 1 Foundation, Q3(a) (1 mark): The student places a metal square at point X. They count the daisies in the square. What is the scientific name for the metal square? Tick (✓) one box. Identifi
- June 2025, Biology Paper 1 Foundation, Q3(b)(i) (2 marks): Calculate the mean number of daisies in the sample of five squares. Mean = [2]
- June 2025, Biology Paper 1 Foundation, Q3(b)(ii) (1 mark): Write down the mode number of daisies in the sample. Mode = [1]
- June 2025, Biology Paper 1 Foundation, Q3(b)(iii) (1 mark): Write down the median number of daisies in the sample. Median = [1]
- June 2025, Biology Paper 1 Foundation, Q3(b)(iv) (1 mark): The student did not decide for themselves where to place the metal squares. Instead they used a random number generator to produce coordinates to decide where t
- June 2025, Biology Paper 1 Foundation, Q3(c)(i) (2 marks): The area of the metal square is 0.25 m2. Calculate the estimated population size of daisies in the garden. Use the equation: area of garden estimated population
- June 2025, Biology Paper 1 Foundation, Q3(c)(ii) (1 mark): This is the student’s method: 1. Generate random coordinates to decide where to place the metal squares. Use metal squares with an area of 0.25 m2. 2. 3. Place
- June 2025, Biology Paper 1 Foundation, Q3(d) (3 marks): Population size can be affected by abiotic and biotic factors. Complete the table to show if each factor is abiotic or biotic. Tick (✓) one box in each row. Fac
- June 2025, Biology Paper 5 Higher, Q4(b)(iii) (1 mark): Scientists estimate the tiger population size in India each year. Suggest one reason why scientists can only estimate the tiger population size. [1]
- June 2025, Biology Paper 5 Higher, Q6(a) (5 marks): The mean number of daisies in each quadrat is 8. Calculate the estimated population of daisies in the park. Give your answer in standard form and to two signifi
- June 2025, Biology Paper 5 Higher, Q6(b) (2 marks): Suggest two ways in which the student could improve the investigation so that the estimate is not biased. 1 2 [2]
- June 2024, Biology Paper 1 Foundation, Q5(b)(i) (2 marks): Suggest why the tortoise population size decreased after the introduction of the goats. Tick (✓) two boxes. The tortoises became too hot. The tortoises’ habitat
- June 2024, Biology Paper 1 Foundation, Q5(c) (3 marks): Riley wants to estimate the population size of the goats on the island. A capture-mark-recapture method is used. Statements A to E describe the steps in the met
- June 2024, Biology Paper 1 Foundation, Q5(d) (1 mark): Write down one reason why Riley takes a sample instead of counting the whole population. [1]
- June 2024, Biology Paper 1 Foundation, Q5(e) (2 marks): The table shows Riley’s results: Number of goats in sample 1 10 Number of goats in sample 2 14 Number of marked goats recaptured in sample 2 7 Calculate the est
- June 2024, Biology Paper 1 Foundation, Q5(f) (1 mark): Describe one way Riley can change their approach to be more confident in their estimate of the population size. [1]
- November 2021, Biology Paper 1 Foundation, Q5(c)(i) (2 marks): Calculate the mean number of mites after 8 weeks, when 15 mites were added. Mean = [2]
- November 2021, Biology Paper 1 Foundation, Q5(c)(ii) (2 marks): When 3 mites were added the number of mites increased after 8 weeks. When 15 mites were added the number of mites decreased after 8 weeks. Explain why. Use idea
- November 2021, Combined Science Paper 4 Foundation, Q8(a) (4 marks): This is part of Beth’s method: 1. Divide the garden into four equal sections. 2. Count the number of buttercup plants in the section that has the most buttercup
- November 2021, Combined Science Paper 4 Foundation, Q8(b) (2 marks): Beth thinks three factors are having an effect on the growth of buttercup plants in her garden. Draw lines to connect each factor with the correct explanation o
- November 2021, Combined Science Paper 4 Foundation, Q8(c)(i) (1 mark): How many gardens are sampled to produce the graph? [1]
- November 2021, Combined Science Paper 4 Foundation, Q8(c)(ii) (1 mark): Kai estimates that he has 450 buttercup plants in his garden. Which percentile of the students’ data does Kai’s estimation lie below? Put a ring around the corr
- November 2021, Combined Science Paper 8 Higher, Q1(a) (4 marks): This is part of Beth’s method: 1. Divide the garden into four equal sections. 2. Count the number of buttercup plants in the section that has the most buttercup
- November 2021, Combined Science Paper 8 Higher, Q1(b) (2 marks): Beth thinks three factors are having an effect on the growth of buttercup plants in her garden. Draw lines to connect each factor with the correct explanation o
- November 2021, Combined Science Paper 8 Higher, Q1(c)(i) (1 mark): How many gardens are sampled to produce the graph? [1]
- November 2021, Combined Science Paper 8 Higher, Q1(c)(ii) (1 mark): Kai estimates that he has 450 buttercup plants in his garden. Which percentile of the students’ data does Kai’s estimation lie below? Put a ring around the corr
- November 2020, Biology Paper 1 Foundation, Q8(a) (2 marks): Amaya records how often she sees each bird species feeding and produces a dominance rank, as shown in the table. The highest ranked species, the house sparrow,
- November 2020, Biology Paper 1 Foundation, Q8(b)(i) (2 marks): Plot a graph of dominance rank against rounded body mass, using the data in the table. [2]
- November 2020, Biology Paper 1 Foundation, Q8(b)(ii) (1 mark): Draw a line of best fit. [1]
- November 2020, Biology Paper 1 Foundation, Q8(c)(i) (1 mark): Do Amaya’s findings support her hypothesis? Use the graph to explain your answer. [1]
- November 2020, Biology Paper 1 Foundation, Q8(c)(ii) (2 marks): Explain why Amaya’s findings do not prove her hypothesis. [2]
- November 2020, Biology Paper 5 Higher, Q1(a) (2 marks): Amaya records how often she sees each bird species feeding and produces a dominance rank, as shown in the table. The highest ranked species, the house sparrow,
- November 2020, Biology Paper 5 Higher, Q1(b)(i) (2 marks): Plot a graph of dominance rank against rounded body mass, using the data in the table. [2]
- November 2020, Biology Paper 5 Higher, Q1(b)(ii) (1 mark): Draw a line of best fit. [1]
- November 2020, Biology Paper 5 Higher, Q1(c)(i) (1 mark): Do Amaya’s findings support her hypothesis? Use the graph to explain your answer. [1]
- November 2020, Biology Paper 5 Higher, Q1(c)(ii) (2 marks): Explain why Amaya’s findings do not prove her hypothesis. [2]
- June 2019, Biology Paper 1 Foundation, Q1(c) (3 marks): Read the statements about the graph. Tick (✓) true or false for each statement. Statement True False Catches of over 0.8 million tonnes are recorded for 4 years
- June 2019, Biology Paper 1 Foundation, Q1(d) (2 marks): Since 1998 the fishing of herring from the North Sea has been described as sustainable. Which statements are true for sustainable fishing of herring? Tick (✓) t
- June 2019, Biology Paper 5 Higher, Q2(b)(i) (1 mark): In which year was the catch greatest and how big was it? Year Catch [1]
- June 2019, Biology Paper 5 Higher, Q2(b)(ii) (1 mark): By 1977 the herring population in the North Sea was so low that fishing for herring was banned. Fishing restarted in 1984. A limit was put on the number of tonn
- June 2019, Biology Paper 5 Higher, Q2(b)(iii) (3 marks): Calculate the rate of increase in the herring catch from 1984 to 1988. Rate = million tonnes / year [3]
- June 2019, Biology Paper 5 Higher, Q2(c) (2 marks): Since 1998 North Sea herring fishing has been described as sustainable. Explain what sustainable means in this context. [2]
Questions, mark schemes and examiner’s reports are © OCR, from their published past papers. Plumi isn’t affiliated with any exam board. Want whole papers? Full past papers.
Rather write your answers by hand on iPad? Plumi marks them against the same mark schemes.