 plumi
Income distribution and welfare: OCR A‑Level Economics questions
Every OCR A-Level Economics exam question on 2.7 Income distribution and welfare, 2021–2025, with its mark scheme and examiner’s report.
Find questions478
Exam
All years
Calculations
 Your answer
 Your answer

 Your answer
 Your answer
Q1(c)
The whole paper ↗


 Your answer
All 12 questions on Income distribution and welfare, as a list
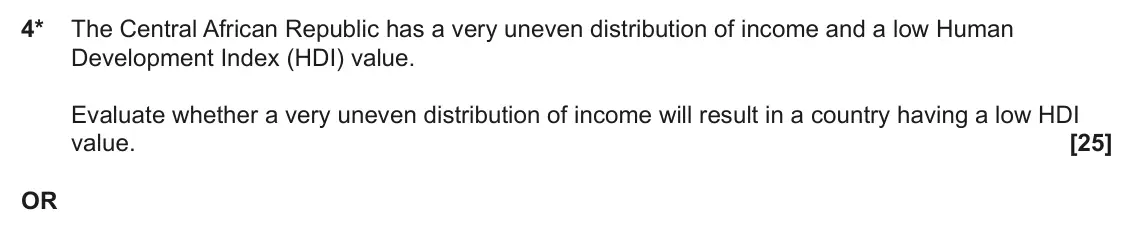
- June 2025, Paper 2, Q4 (25 marks): 4* The Central African Republic has a very uneven distribution of income and a low Human Development Index (HDI) value. Evaluate whether a very uneven distribut
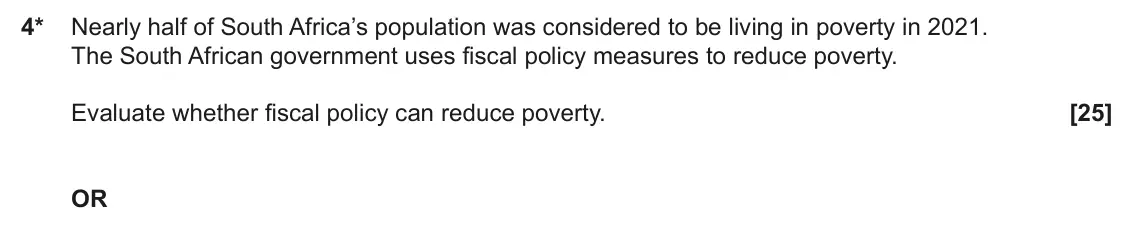
- June 2024, Paper 2, Q4 (25 marks): 4* Nearly half of South Africa’s population was considered to be living in poverty in 2021. The South African government uses fiscal policy measures to reduce p
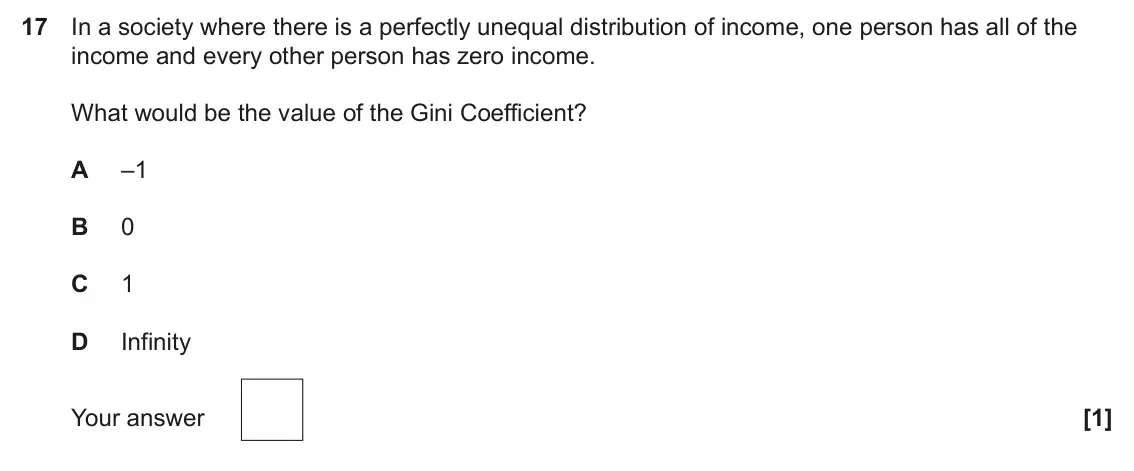
- June 2024, Paper 3, Q17 (1 mark): In a society where there is a perfectly unequal distribution of income, one person has all of the income and every other person has zero income. What would be t
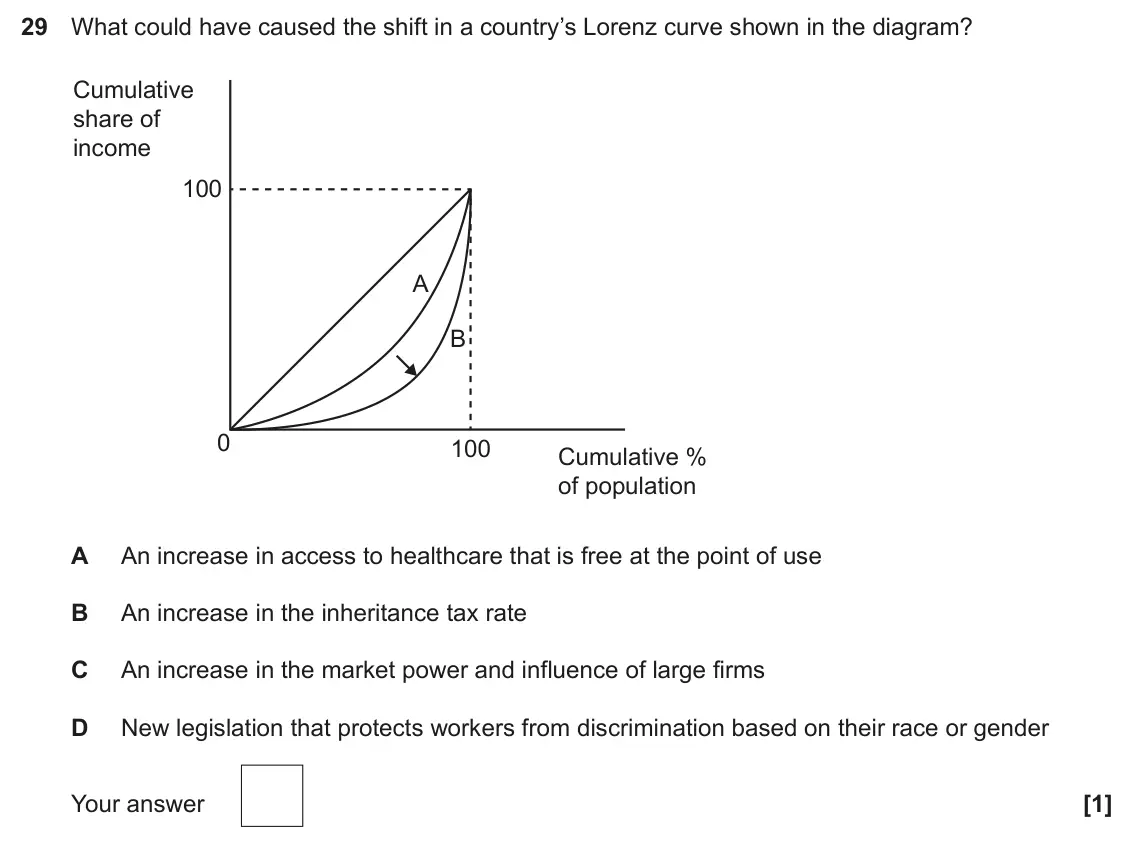
- June 2024, Paper 3, Q29 (1 mark): What could have caused the shift in a country’s Lorenz curve shown in the diagram? Cumulative share of income 100 A B 0 100 Cumulative % of population A An incr
- June 2023, Paper 2, Q4 (25 marks): 4* Since 1978, more than 800 million people have been lifted out of poverty in China. In this period, the Chinese government has made increasing use of supply s
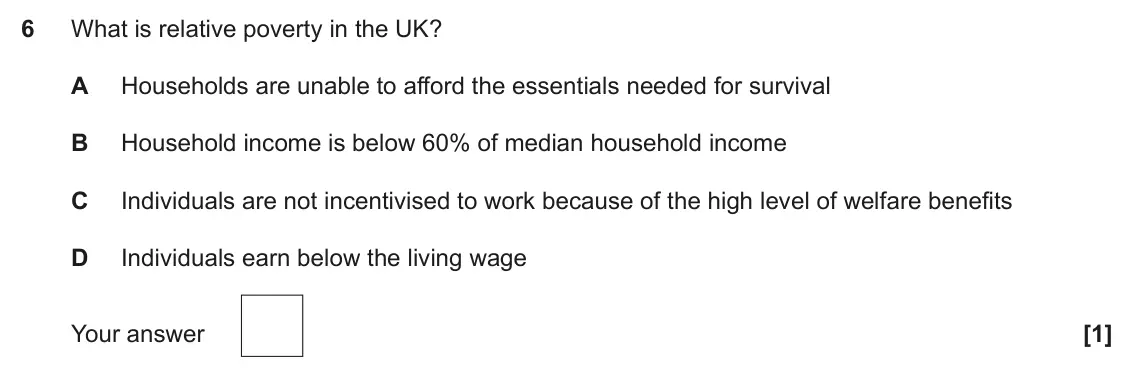
- June 2023, Paper 3, Q6 (1 mark): What is relative poverty in the UK? A Households are unable to afford the essentials needed for survival B Household income is below 60% of median household inc
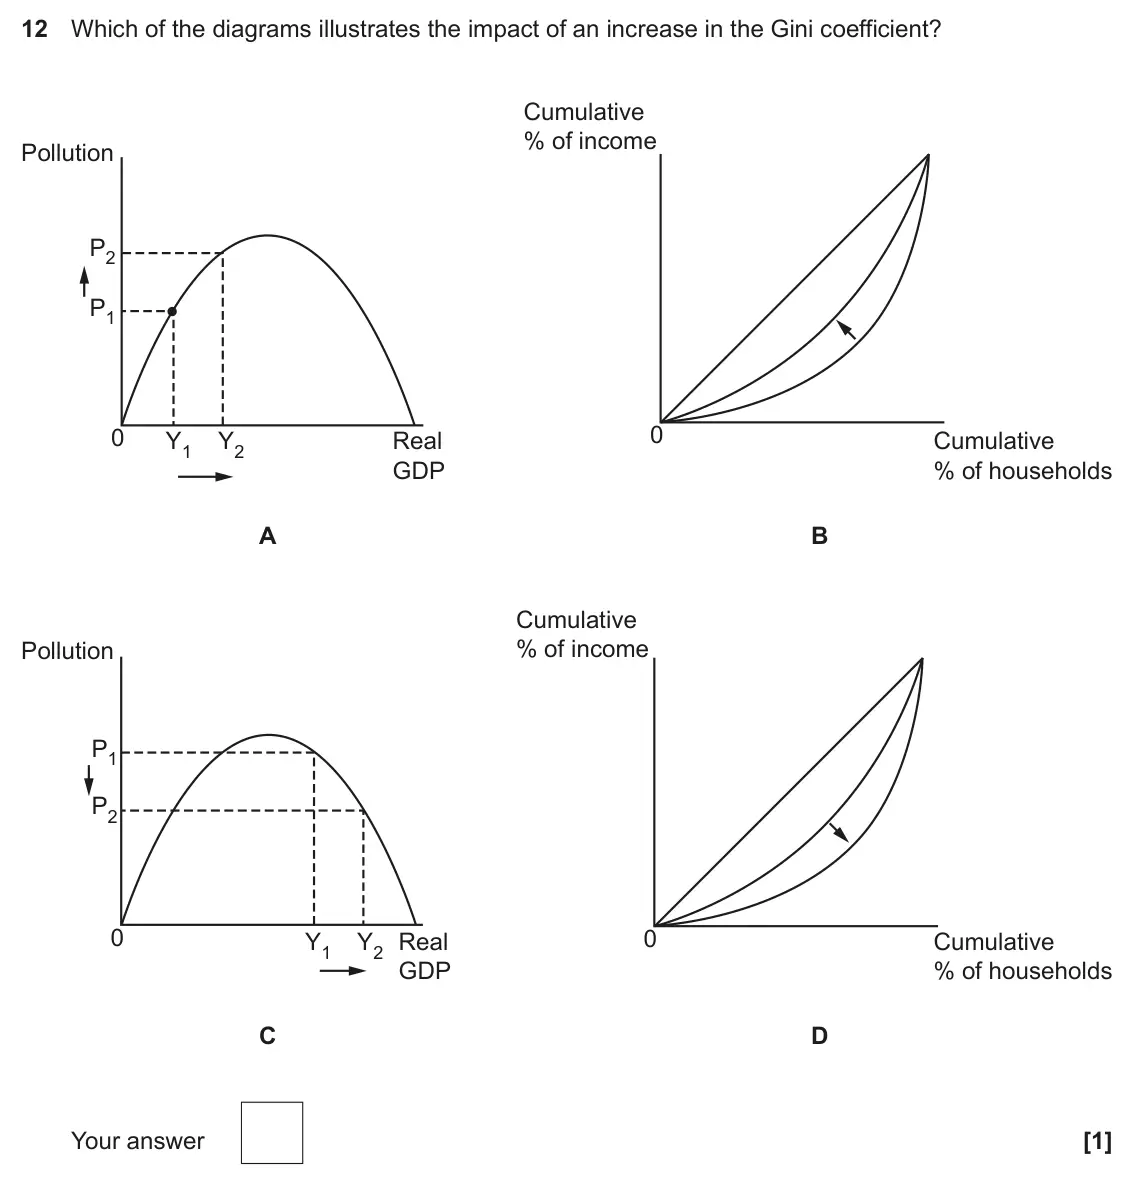
- June 2023, Paper 3, Q12 (1 mark): Which of the diagrams illustrates the impact of an increase in the Gini coefficient? Cumulative % of income Pollution P2 P1 0 0 Y1 Y2 Real Cumulative GDP % of h
- June 2022, Paper 2, Q1(c) (4 marks): Using Fig. 2, explain the relationship between the Gini coefficient and economic growth rate. [4]
- June 2022, Paper 3, Q34 (2 marks): Explain, how the data in Fig. 2.1 can be used to measure the level of income inequality in the UK. [2]
- June 2022, Paper 3, Q36 (8 marks): Evaluate, using the information in Extract 2, whether subsidising research and development in ‘left behind regions’ would be the most effective macroeconomic po
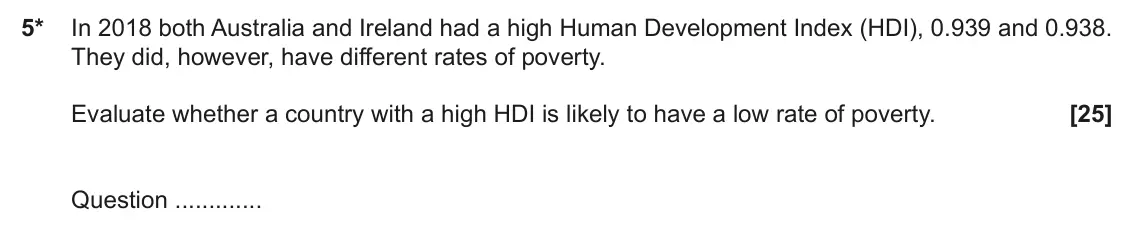
- November 2021, Paper 2, Q5 (25 marks): 5* In 2018 both Australia and Ireland had a high Human Development Index (HDI), 0.939 and 0.938. They did, however, have different rates of poverty. Evaluate wh
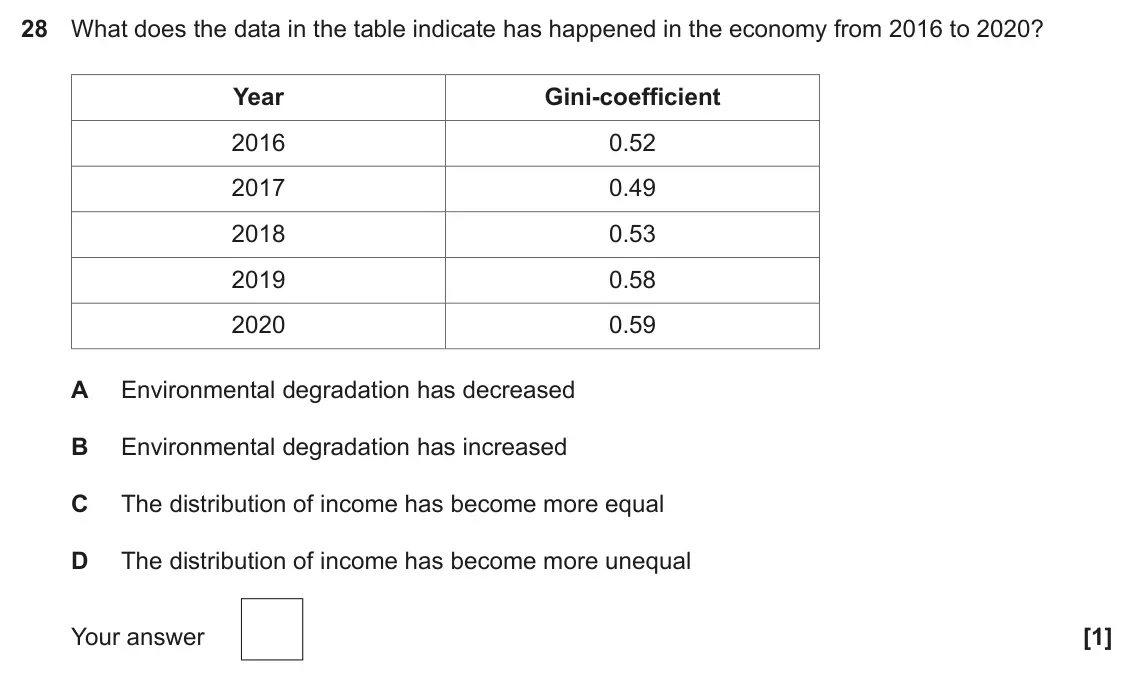
- November 2021, Paper 3, Q28 (1 mark): What does the data in the table indicate has happened in the economy from 2016 to 2020? Year Gini-coefficient 2016 0.52 2017 0.49 2018 0.53 2019 0.58 2020 0.59
Questions, mark schemes and examiner’s reports are © OCR, from their published past papers. Plumi isn’t affiliated with any exam board. Want whole papers? Full past papers.
Rather write your answers by hand on iPad? Plumi marks them against the same mark schemes.