 plumi
pH titration curves and indicators: OCR A‑Level Chemistry A questions
OCR A-Level Chemistry A past-paper questions on 5.1.3.6 pH titration curves and indicators, 2016–2025, with mark schemes and examiner’s reports where available.
Paper
All papers
Exam
All years
Calculations
- Your answer
Q19(b)(i)
The whole paper ↗
Q19(b)(ii)
The whole paper ↗- Your answer
Q20(b)(i)
The whole paper ↗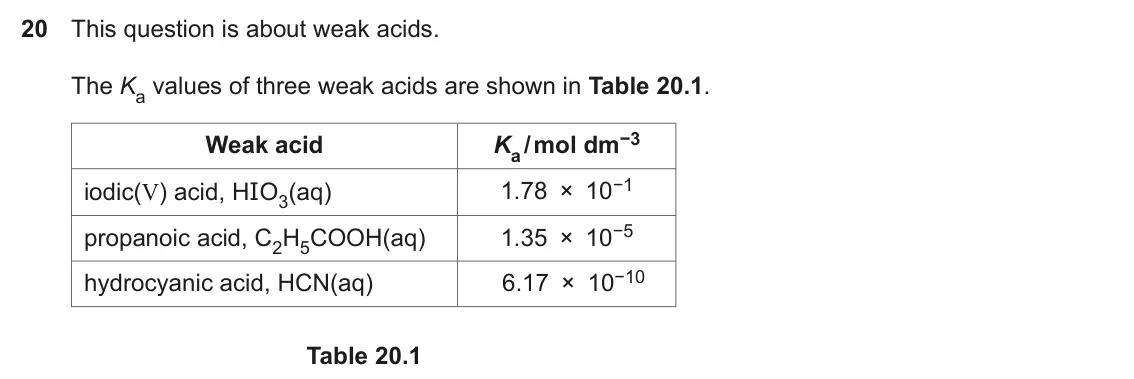
Q20(b)(iii)
The whole paper ↗Q20(b)(iv)
The whole paper ↗Q20(b)(v)
The whole paper ↗
All 8 questions on pH titration curves and indicators, as a list
- June 2025, Paper 1, Q13 (1 mark): A mixture of ethanoic acid and ethanol is left to reach equilibrium. A student determines the amount of ethanoic acid remaining in the equilibrium mixture by ti
- June 2024, Paper 1, Q19(b)(i) (5 marks): Draw a best-fit curve on the graph and calculate the concentration of the CH3COOH solution. CH3COOH concentration = mol dm–3 [5]
- June 2024, Paper 1, Q19(b)(ii) (1 mark): The end point of the titration can also be found by observing the colour change of an indicator. The pH ranges of some indicators are shown in the table. Indica
- June 2022, Paper 1, Q11 (1 mark): The equilibrium equation for an indicator, HA, is shown below. A–(aq) H+(aq) Equation: HA(aq) + Colour: Blue Yellow The indicator is added to a solution. The in
- June 2019, Paper 1, Q20(b)(i) (1 mark): Show by calculation that 20.0 cm3 of NaOH(aq) is required to reach the end point. [1]
- June 2019, Paper 1, Q20(b)(iii) (3 marks): On the axes below, sketch a pH curve for the pH changes during the addition of 45.0 cm3 of 0.100 mol dm−3 NaOH(aq) to 25.0 cm3 of 0.0800 mol dm−3 C2H5COOH(aq).
- June 2019, Paper 1, Q20(b)(iv) (1 mark): The student considers using the four indicators in Table 20.2 for the titration. Indicator pH range Cresol red 0.2 – 1.8 Bromophenol blue 3.0 – 4.6 Cresol purpl
- June 2019, Paper 1, Q20(b)(v) (2 marks): The student repeats the experiment starting with 25.0 cm3 of 0.0800 mol dm−3 HCN(aq) and adding a total of 45.0 cm3 of 0.100 mol dm−3 NaOH(aq). Predict one simi
Questions, mark schemes and examiner’s reports are © OCR, from their published past papers. Plumi isn’t affiliated with any exam board. Want whole papers? OCR A-Level Chemistry A past papers, or our free OCR-style practice pack.
The Plumi iPad app also offers exam-style questions with AI feedback on your handwritten working.