 plumi
Stopping distances and road safety: Edexcel GCSE Physics questions
Every Edexcel GCSE Physics exam question on Stopping distances and road safety (specification points 2.27–2.33), 2018–2025, with its mark scheme and examiner’s report.
Find questions1,554
Exam
All years
Calculations
Q5(a)
The whole paper ↗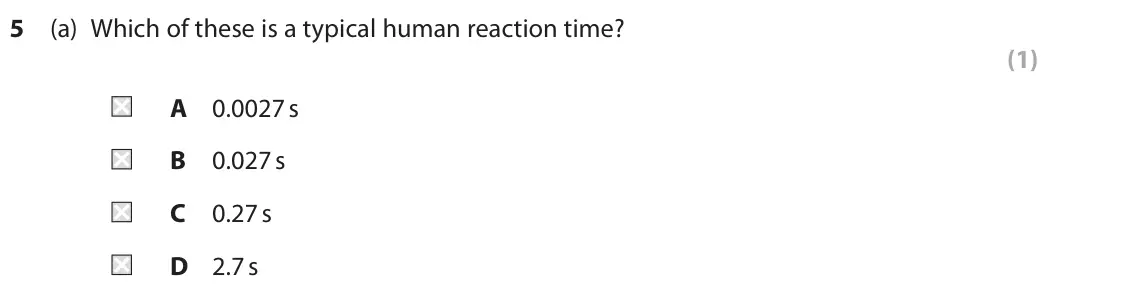
Q5(b)
The whole paper ↗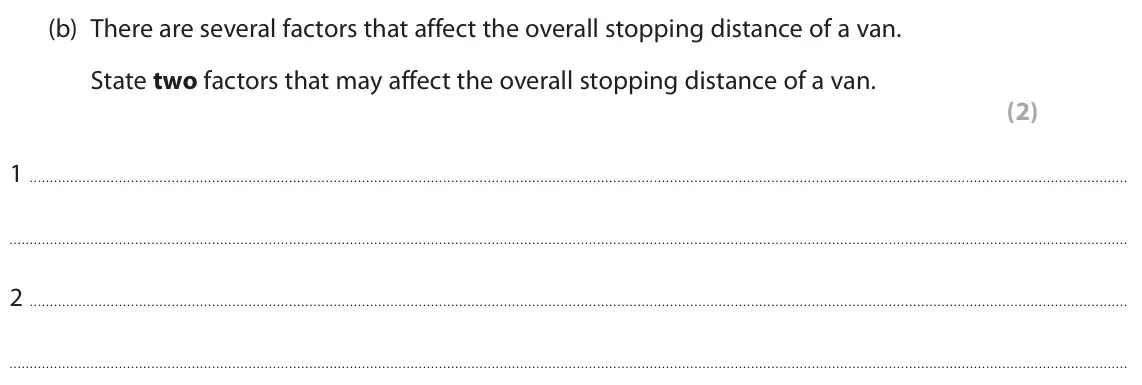
Q5(c)(i)
The whole paper ↗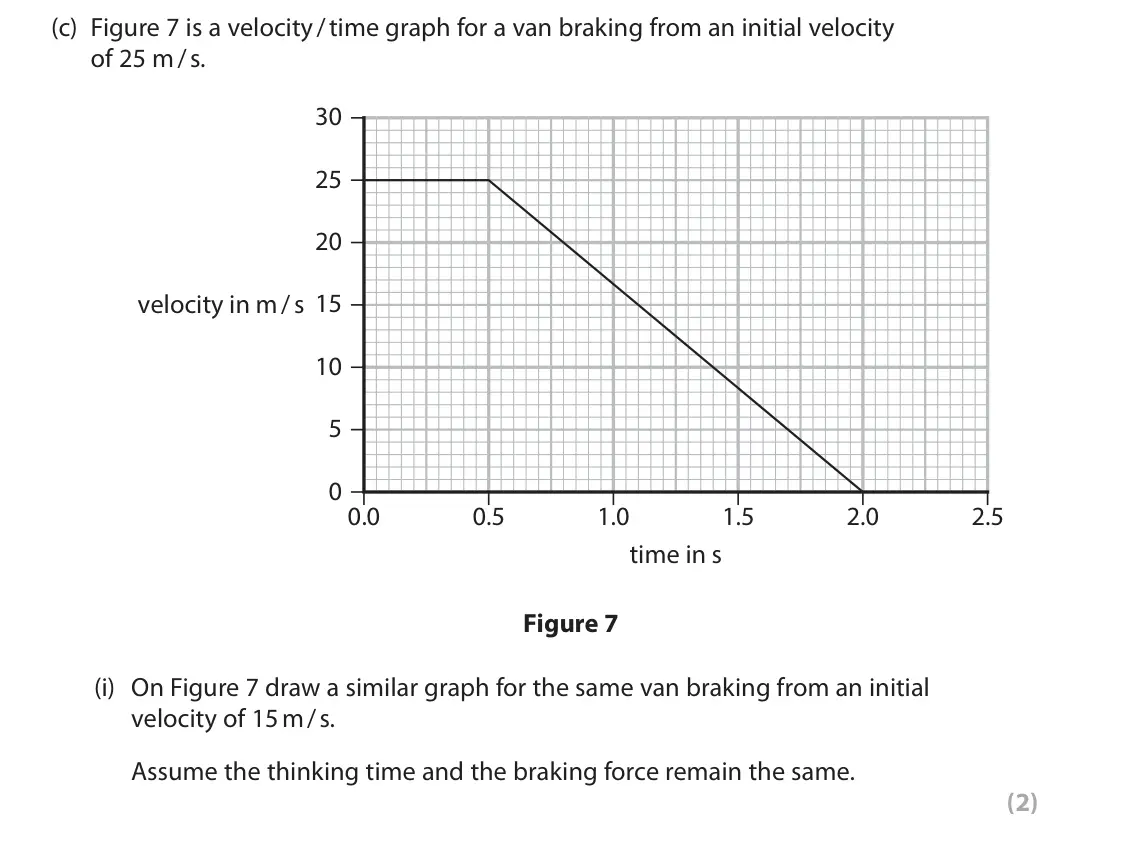
Q4(a)(i)
The whole paper ↗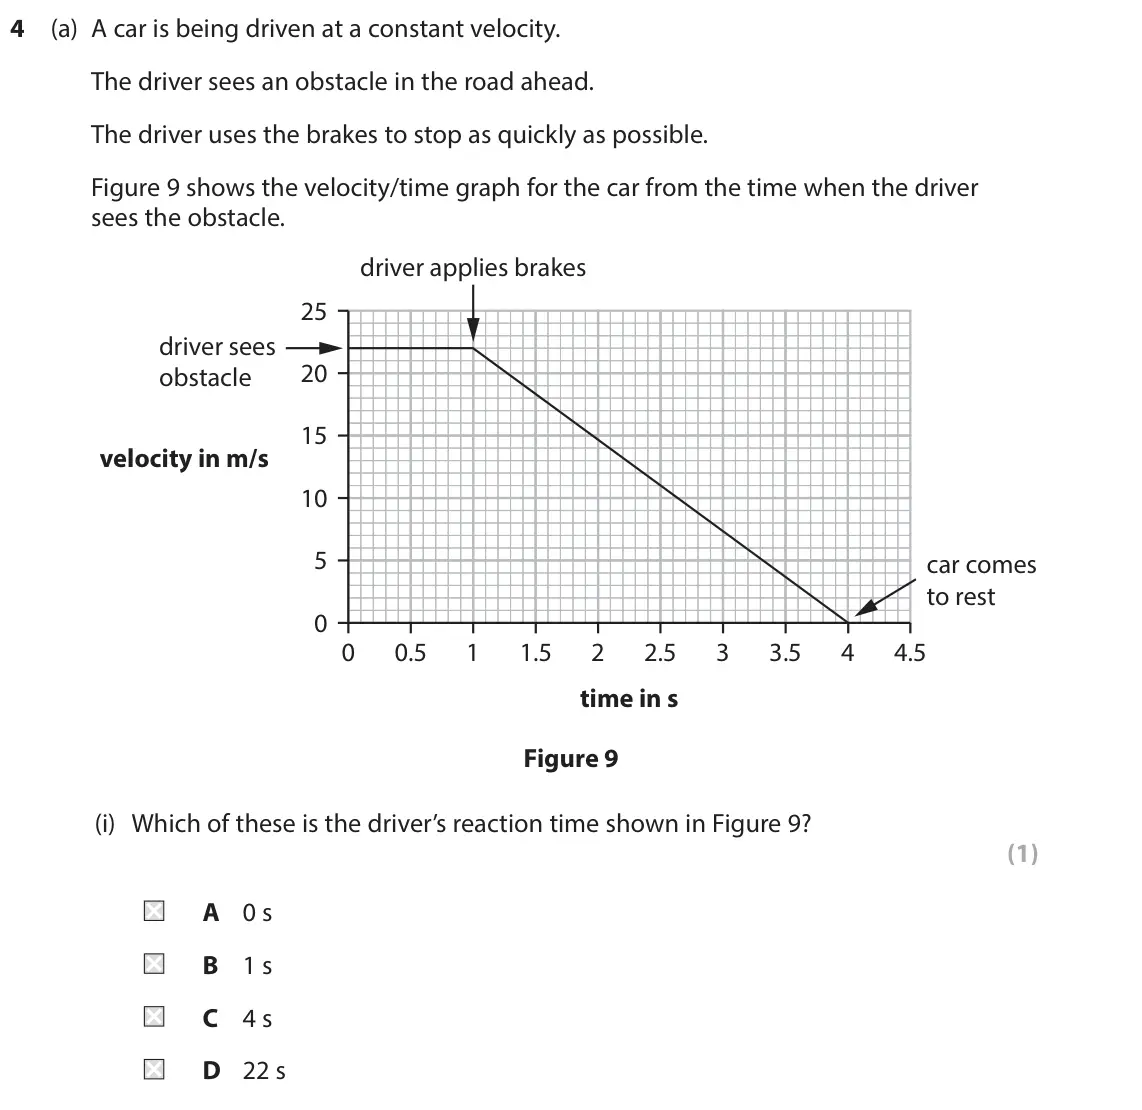
Q4(a)(ii)
The whole paper ↗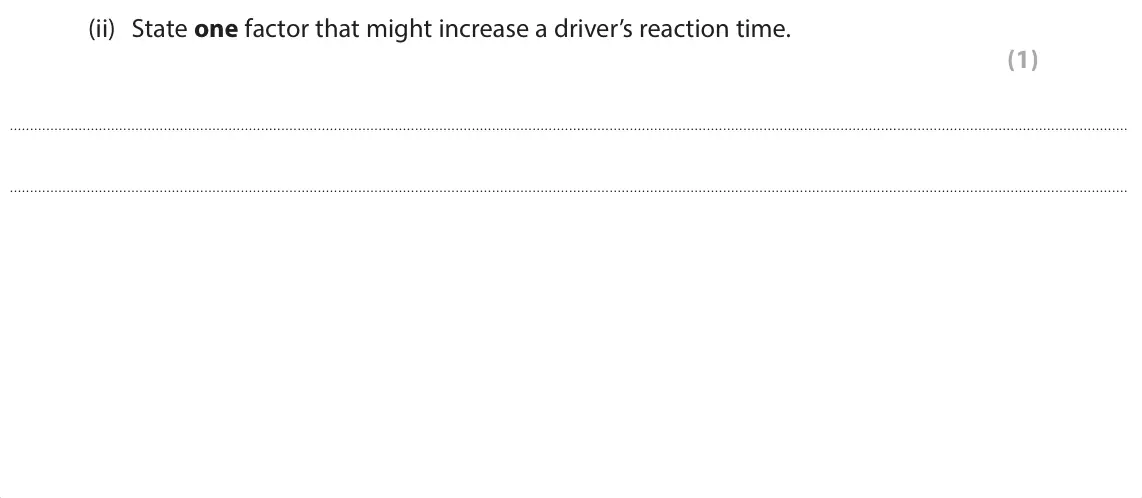
Q4(a)(iii)
The whole paper ↗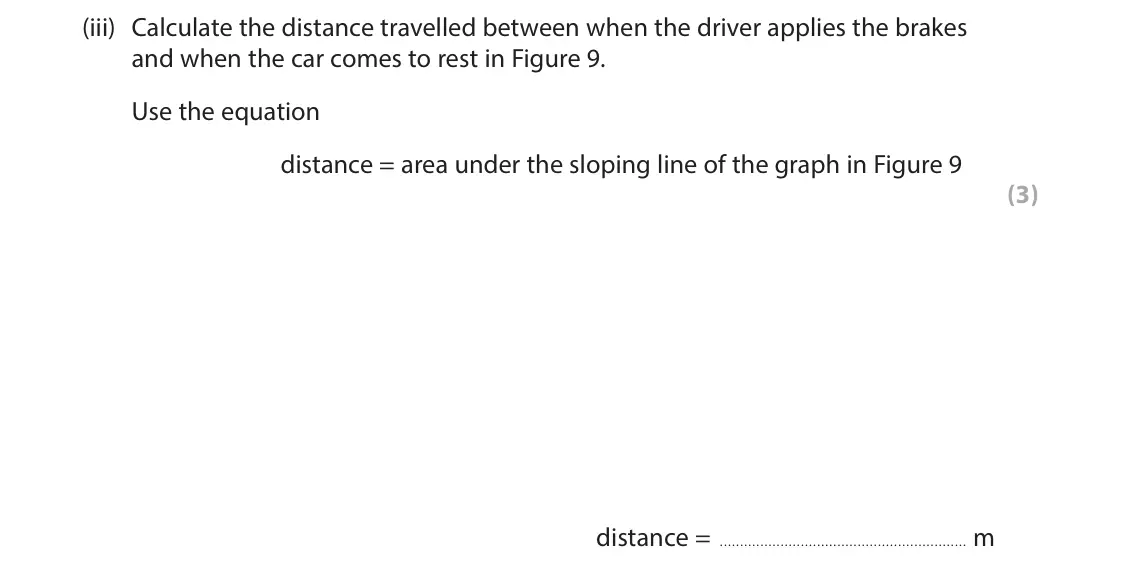
Q4(b)
The whole paper ↗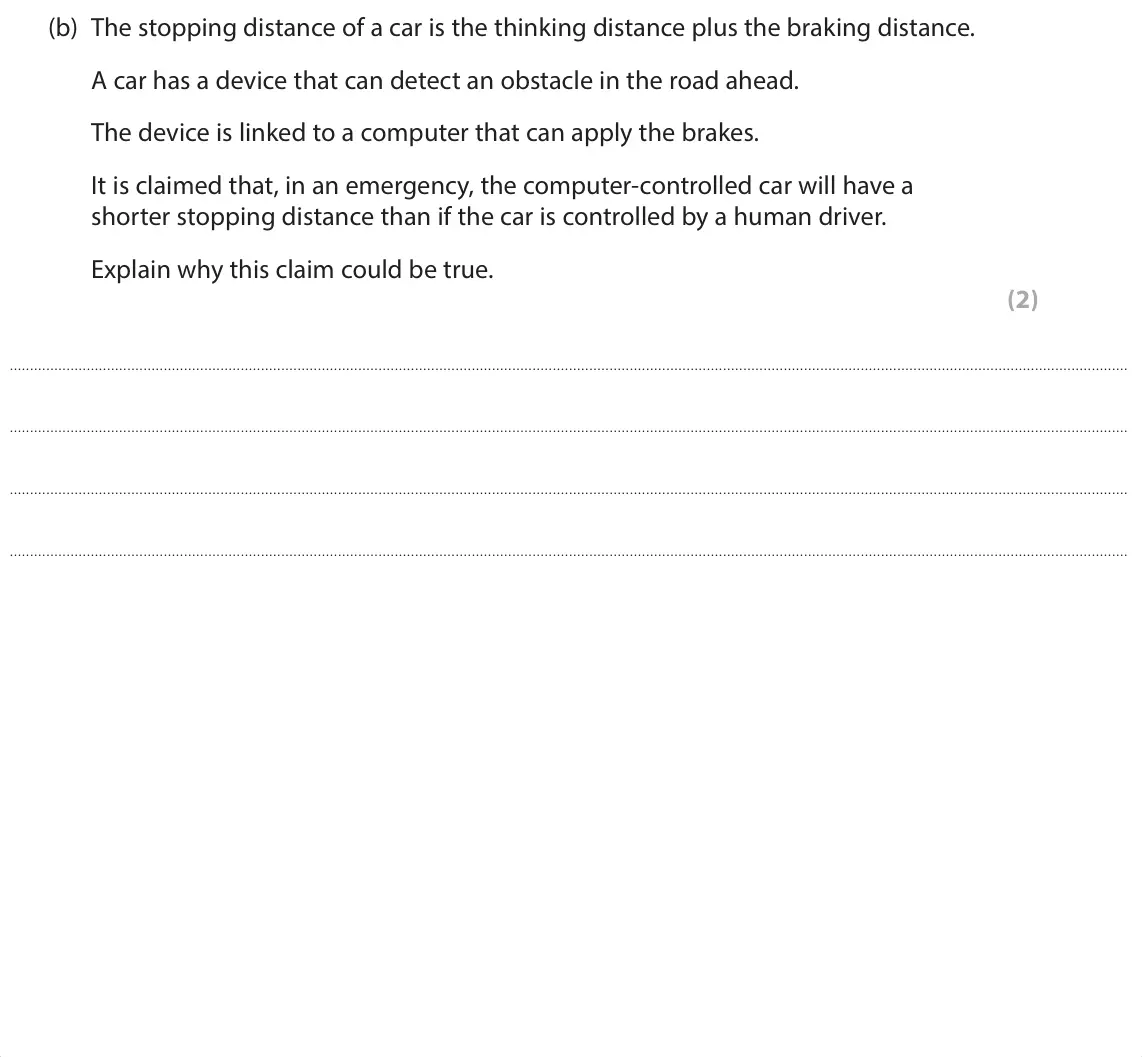
Q4(c)(i)
The whole paper ↗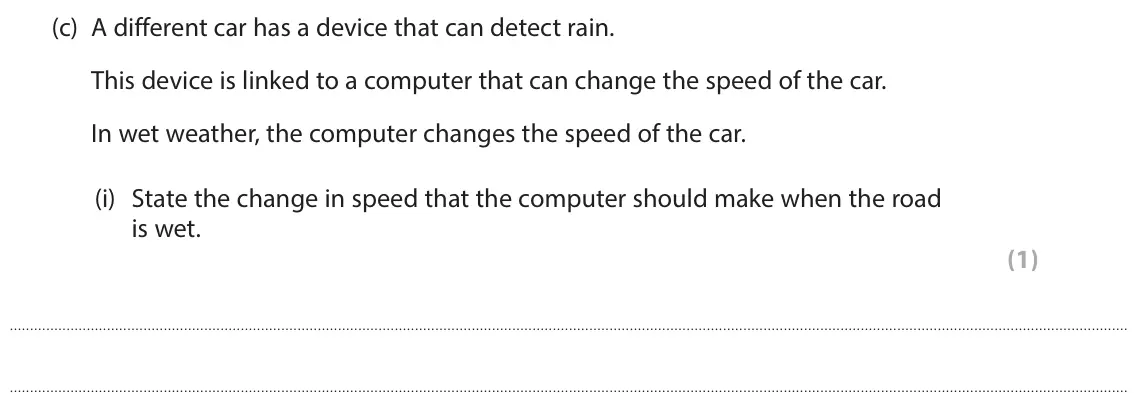
Q4(c)(ii)
The whole paper ↗
Q6(a)(i)
The whole paper ↗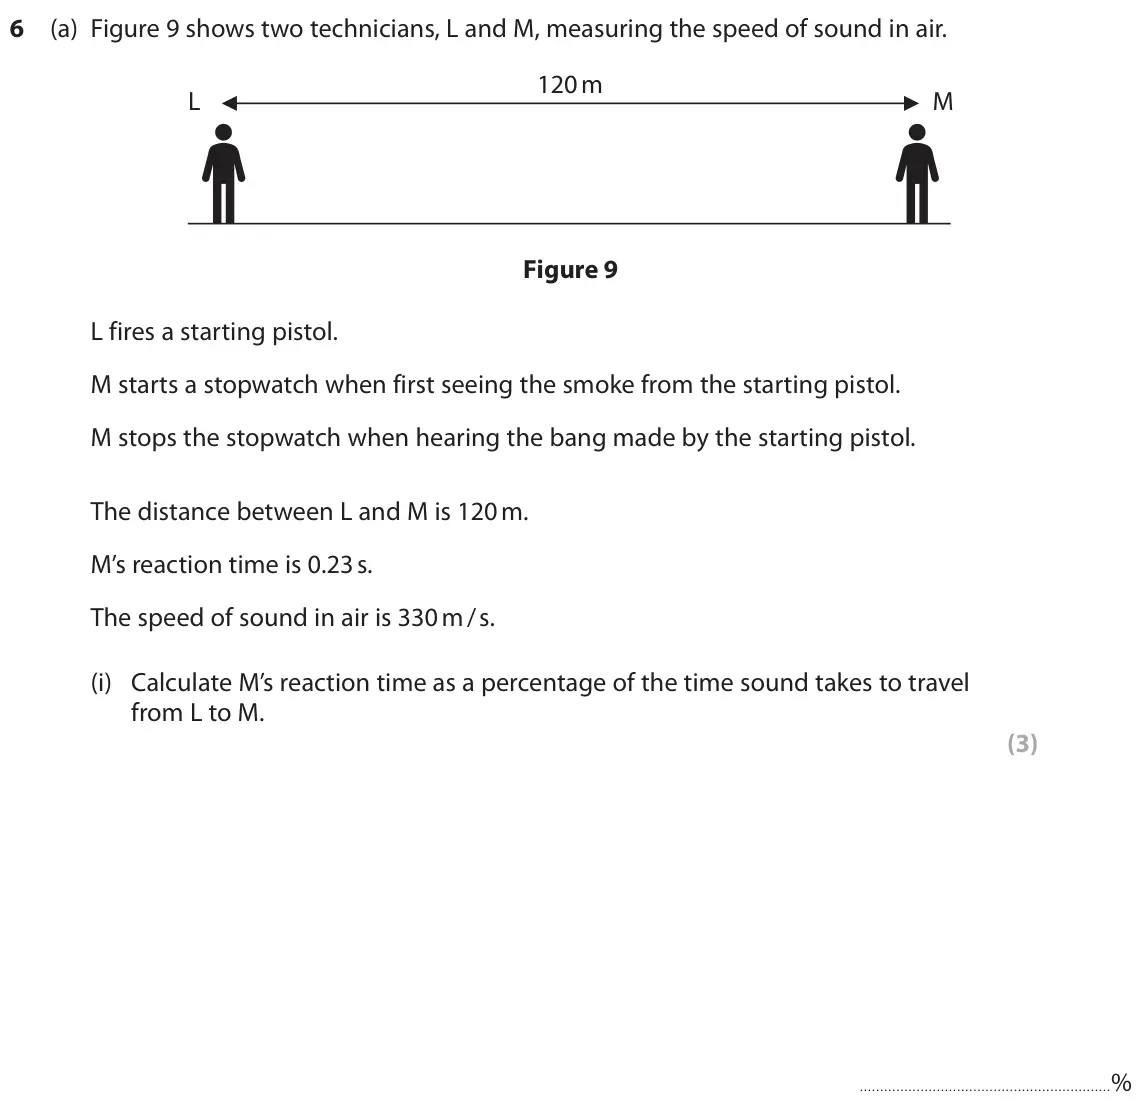
Q3(a)(i)
The whole paper ↗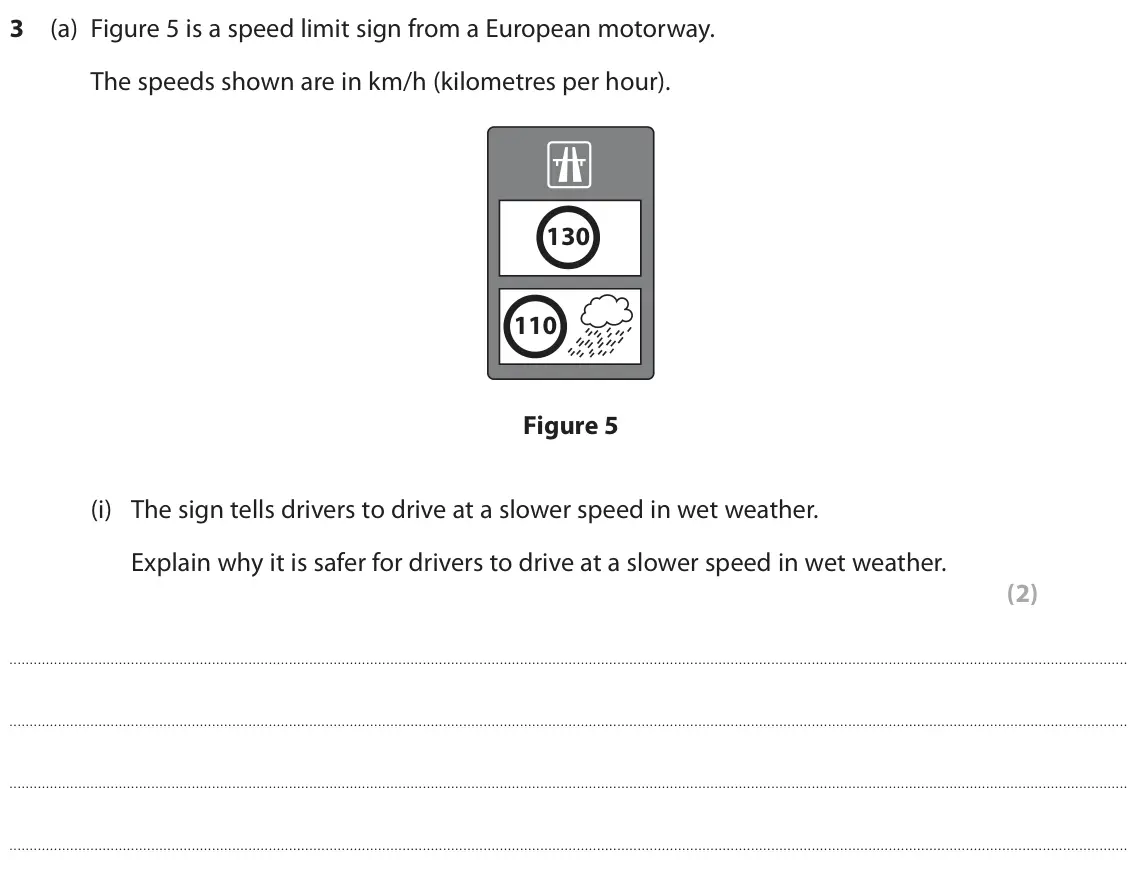
Q3(a)(iii)
The whole paper ↗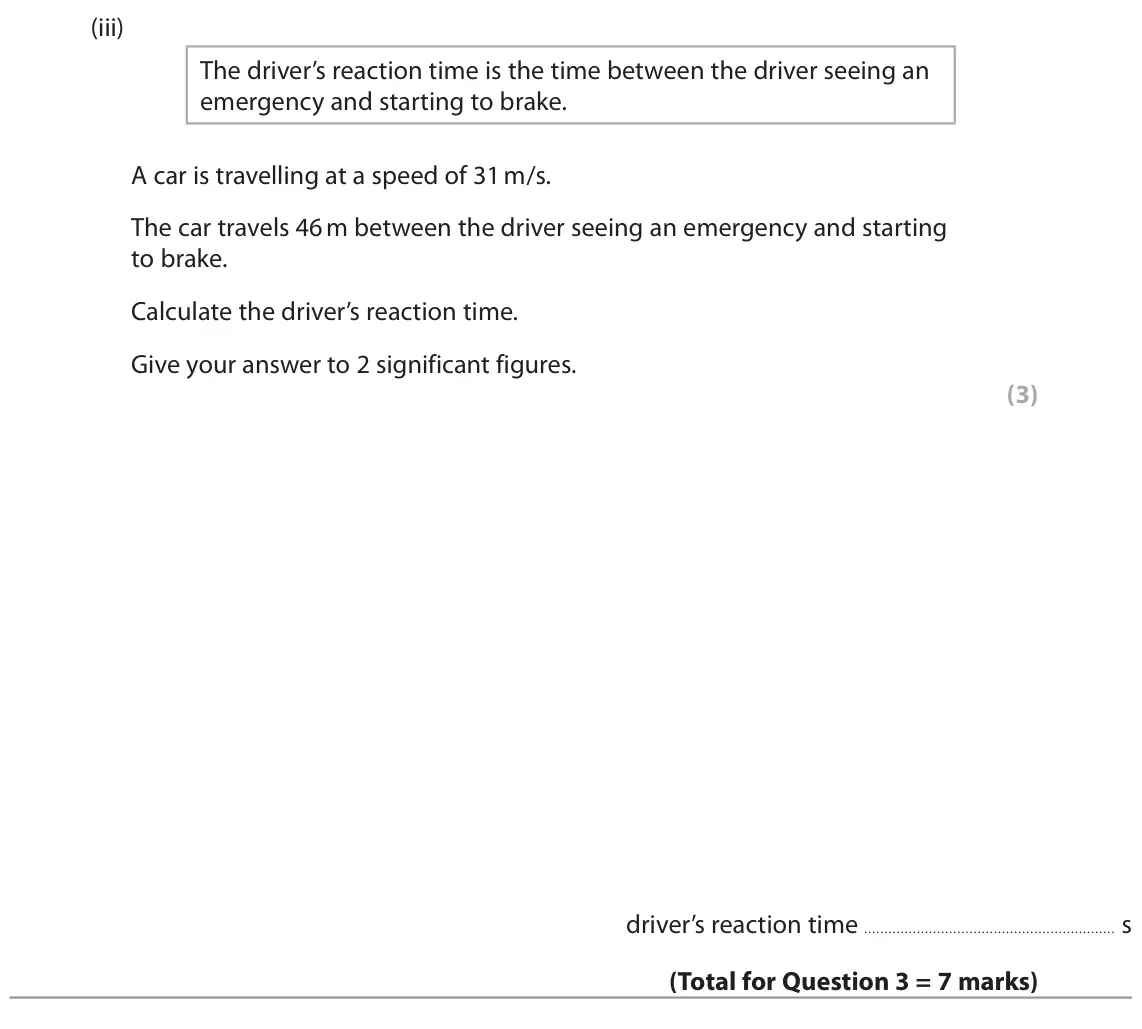
Q4(c)(iii)
The whole paper ↗
Q9(a)(i)
The whole paper ↗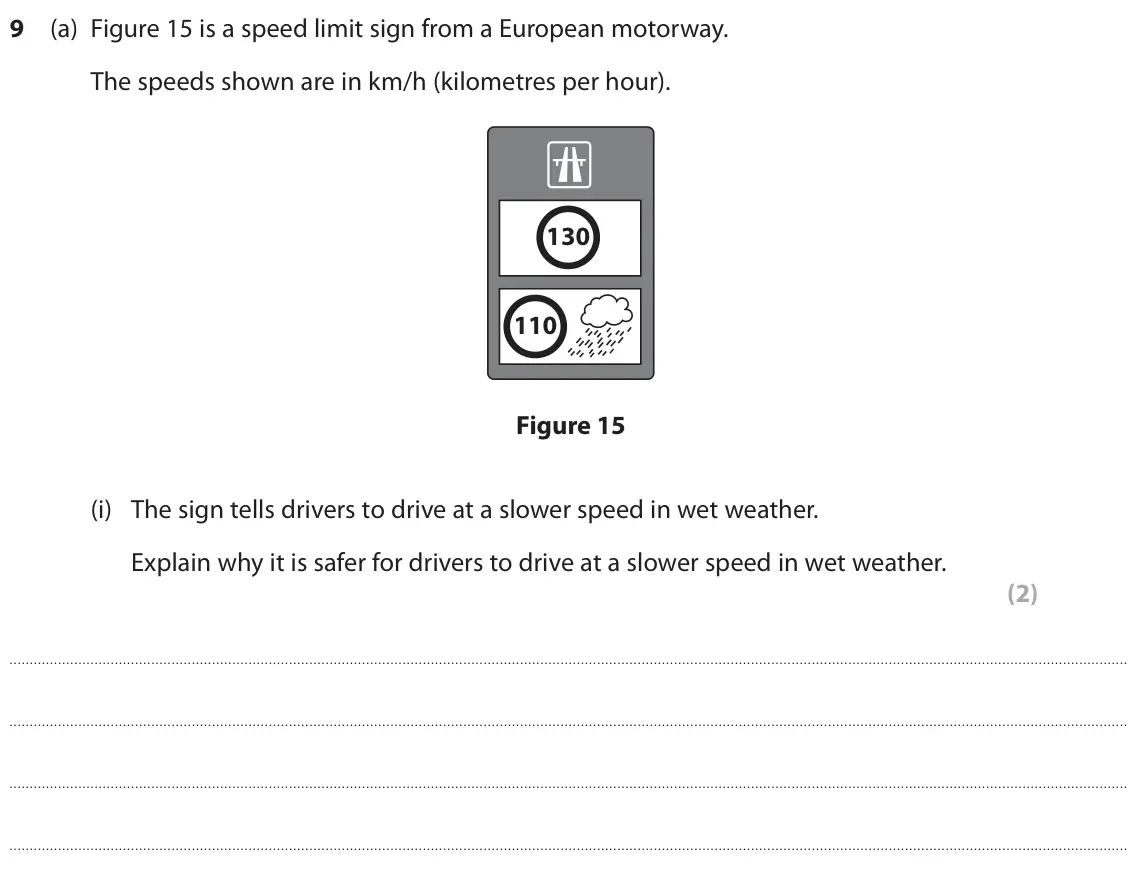
Q9(a)(iii)
The whole paper ↗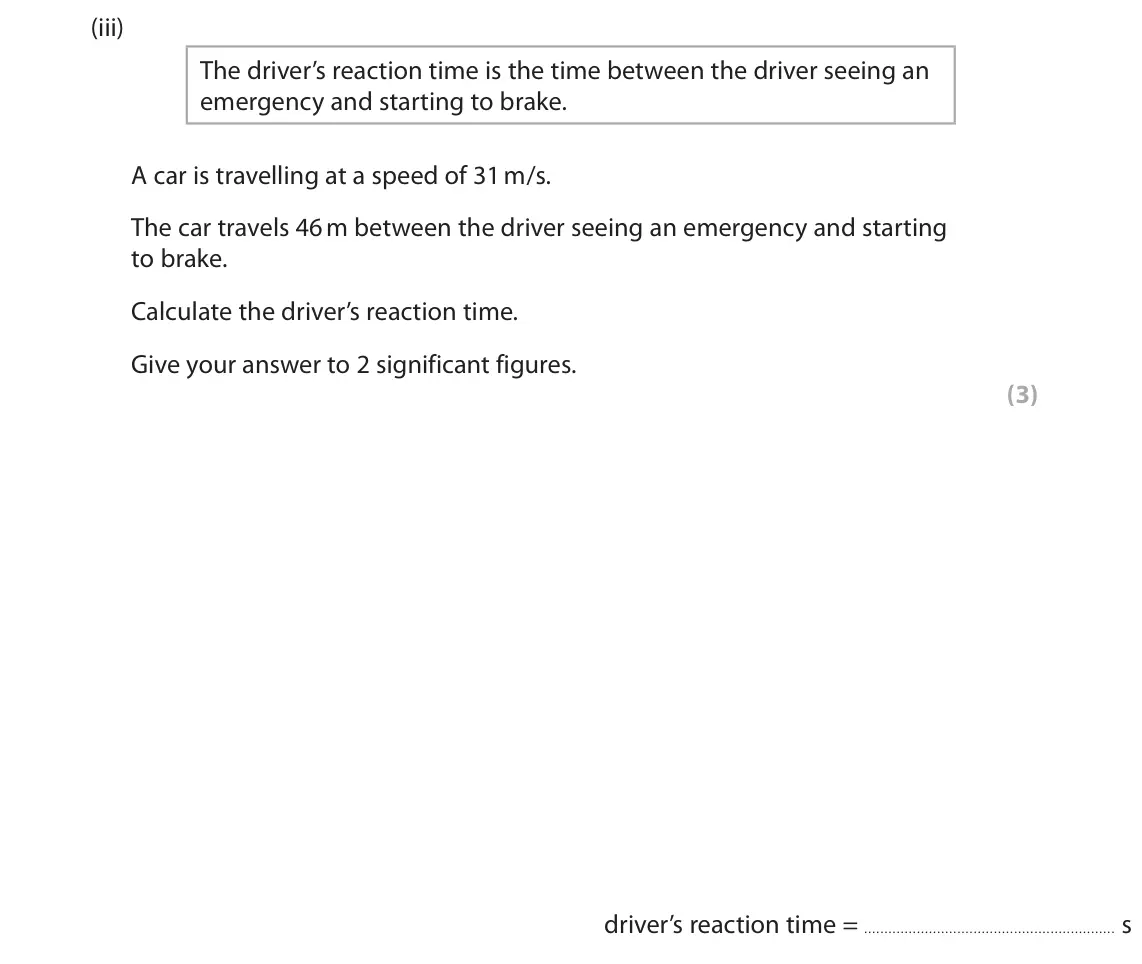
Q5(a)(i)
The whole paper ↗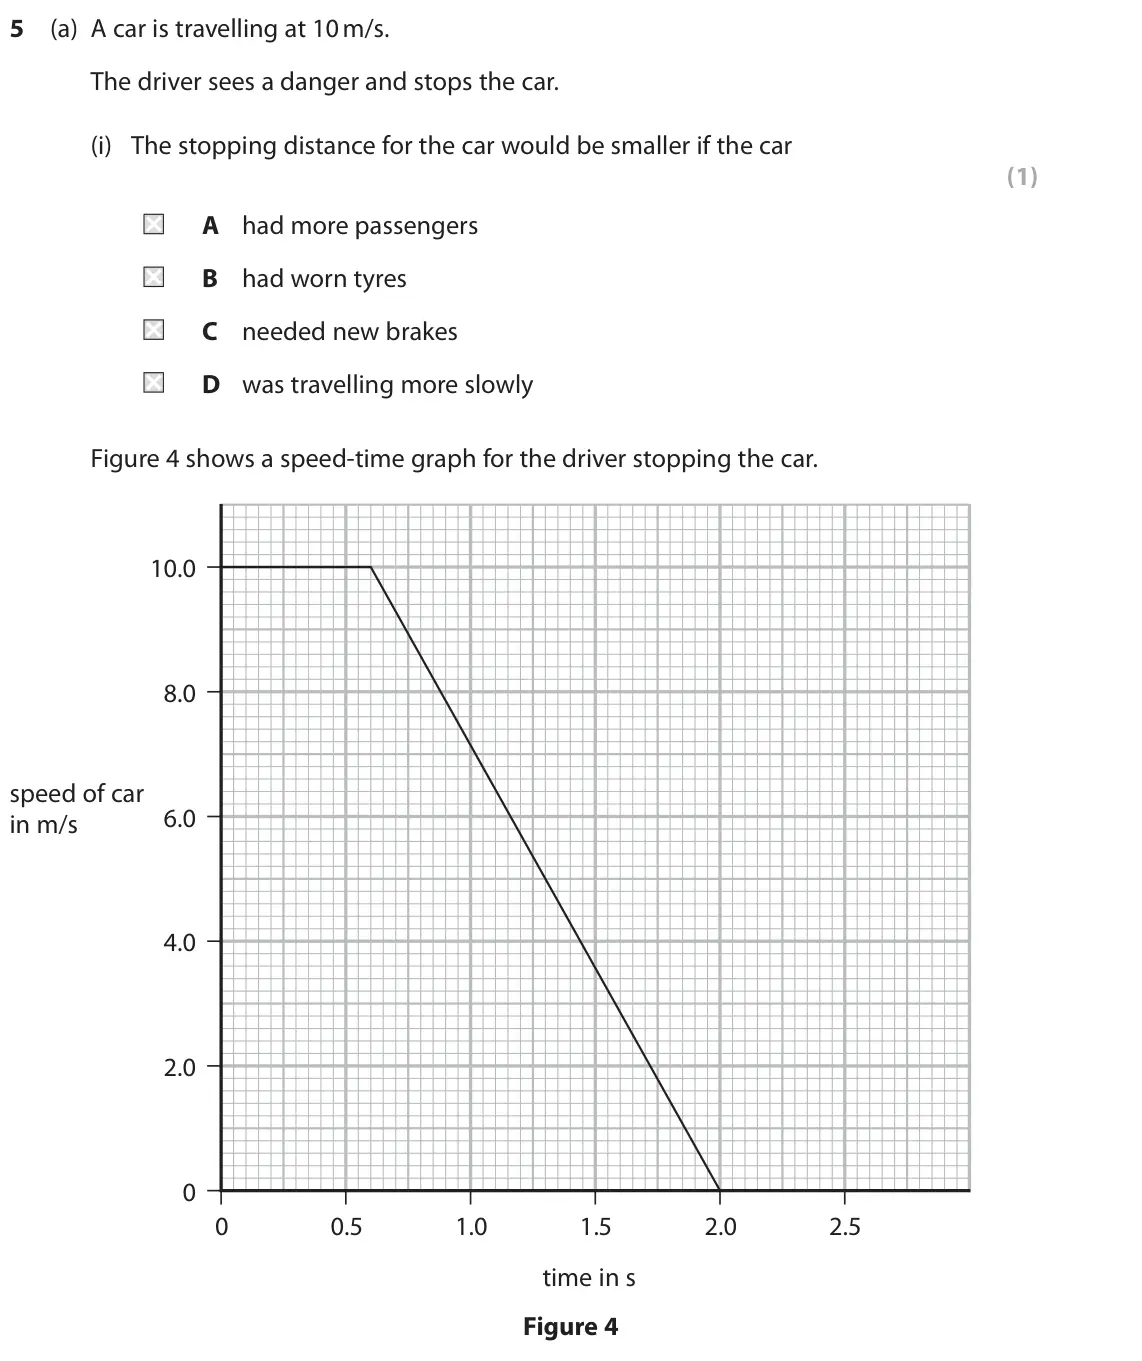
Q5(a)(ii)
The whole paper ↗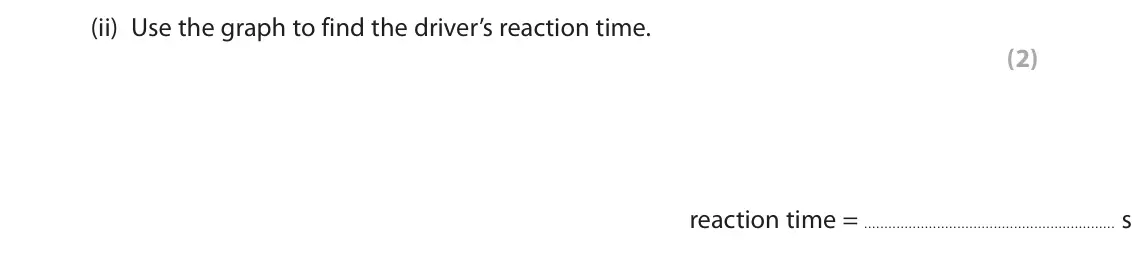
Q5(b)
The whole paper ↗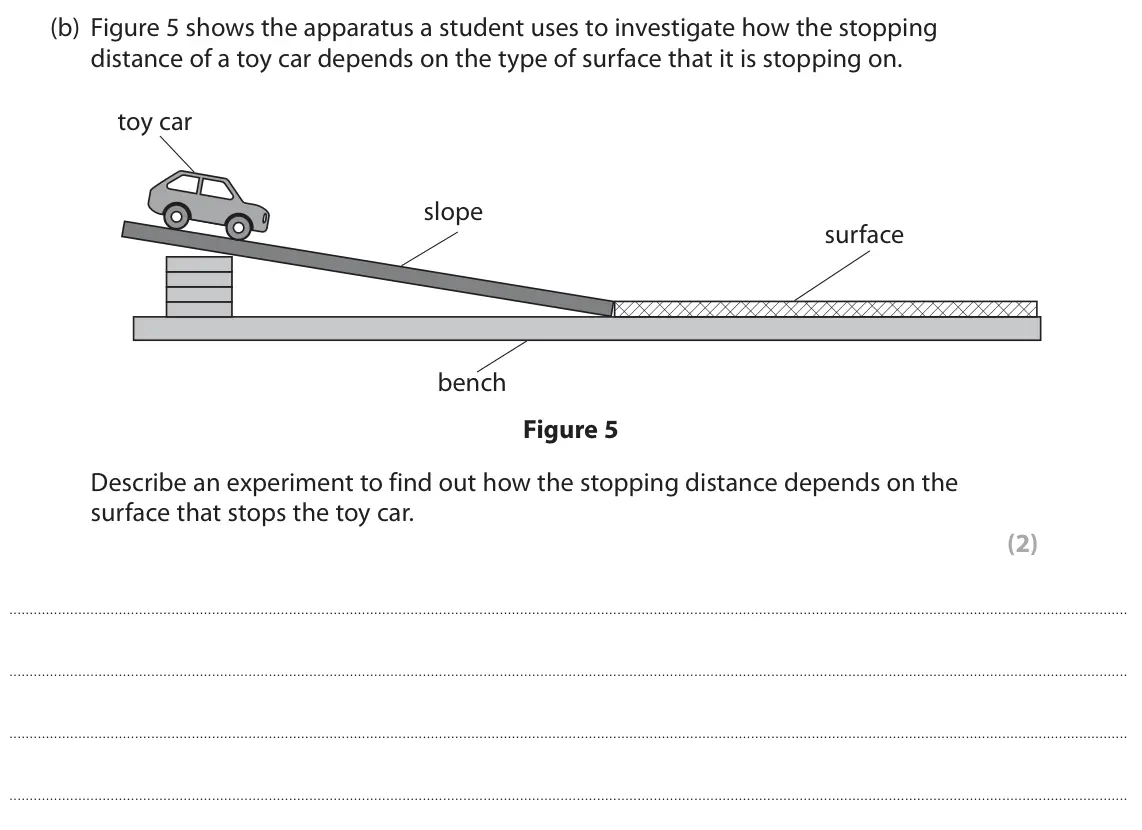
Q5(c)(i)
The whole paper ↗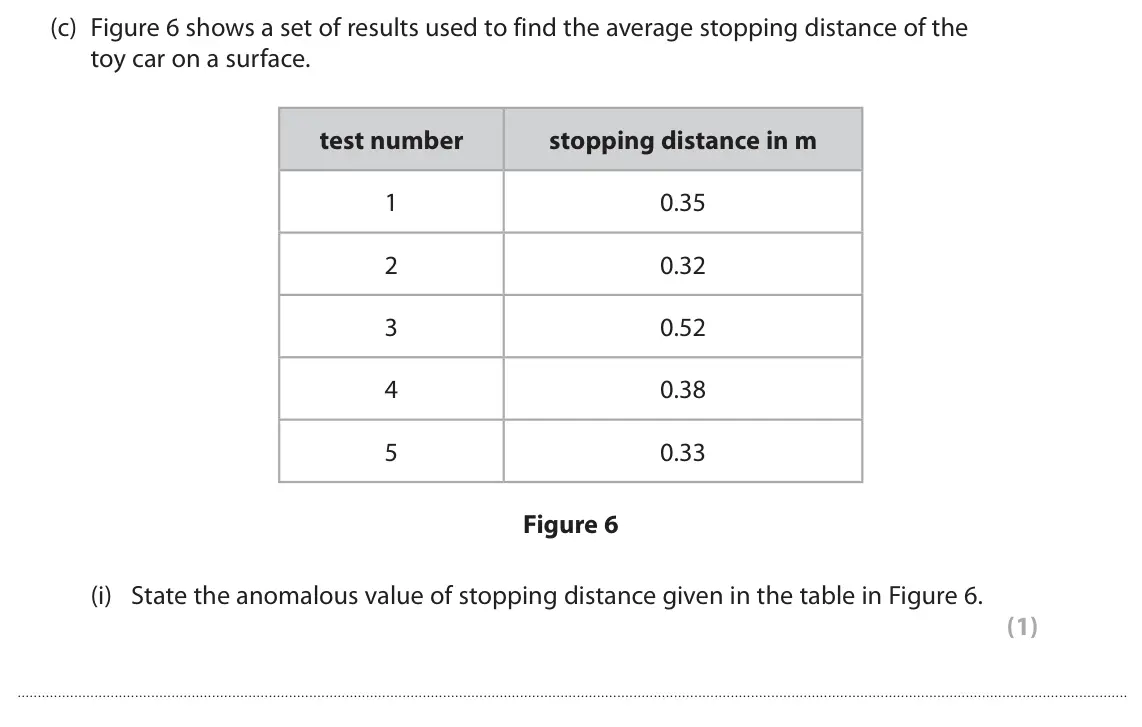
Q5(c)(ii)
The whole paper ↗
All 23 questions on Stopping distances and road safety, as a list
- June 2025, Paper 1 Foundation, Q5(a) (1 mark): Which of these is a typical human reaction time? (1) A 0.0027 s B 0.027 s C 0.27 s D 2.7 s
- June 2025, Paper 1 Foundation, Q5(b) (2 marks): There are several factors that affect the overall stopping distance of a van. State two factors that may affect the overall stopping distance of a van. (2) 1 2
- June 2025, Paper 1 Foundation, Q5(c)(i) (2 marks): On Figure 7 draw a similar graph for the same van braking from an initial velocity of 15 m / s. Assume the thinking time and the braking force remain the same.
- June 2024, Paper 1 Foundation, Q4(a)(i) (1 mark): Which of these is the driver’s reaction time shown in Figure 9? (1) A 0 s B 1 s C 4 s D 22 s
- June 2024, Paper 1 Foundation, Q4(a)(ii) (1 mark): State one factor that might increase a driver’s reaction time. (1)
- June 2024, Paper 1 Foundation, Q4(a)(iii) (3 marks): Calculate the distance travelled between when the driver applies the brakes and when the car comes to rest in Figure 9. Use the equation distance = area under t
- June 2024, Paper 1 Foundation, Q4(b) (2 marks): The stopping distance of a car is the thinking distance plus the braking distance. A car has a device that can detect an obstacle in the road ahead. The device
- June 2024, Paper 1 Foundation, Q4(c)(i) (1 mark): State the change in speed that the computer should make when the road is wet. (1)
- June 2024, Paper 1 Foundation, Q4(c)(ii) (1 mark): Give a reason why this change in speed is necessary when the road is wet. (1)
- June 2023, Paper 1 Higher, Q6(a)(i) (3 marks): Calculate M’s reaction time as a percentage of the time sound takes to travel from L to M. (3) %
- June 2022, Paper 1 Higher, Q3(a)(i) (2 marks): The sign tells drivers to drive at a slower speed in wet weather. Explain why it is safer for drivers to drive at a slower speed in wet weather. (2)
- June 2022, Paper 1 Higher, Q3(a)(iii) (3 marks): The driver’s reaction time is the time between the driver seeing an emergency and starting to brake. A car is travelling at a speed of 31 m/s. The car travels 4
- June 2022, Paper 1 Foundation, Q4(c)(iii) (2 marks): The student had a choice of how to measure the time the trolley takes to roll down the ramp. 1. Use a hand‑held stopwatch. 2. Use light gates at the top and bot
- June 2022, Paper 1 Foundation, Q9(a)(i) (2 marks): The sign tells drivers to drive at a slower speed in wet weather. Explain why it is safer for drivers to drive at a slower speed in wet weather. (2)
- June 2022, Paper 1 Foundation, Q9(a)(iii) (3 marks): The driver’s reaction time is the time between the driver seeing an emergency and starting to brake. A car is travelling at a speed of 31 m/s. The car travels 4
- November 2021, Paper 1 Foundation, Q5(a)(i) (1 mark): The stopping distance for the car would be smaller if the car (1) A had more passengers B had worn tyres C needed new brakes D was travelling more slowly Figure
- November 2021, Paper 1 Foundation, Q5(a)(ii) (2 marks): Use the graph to find the driver’s reaction time. (2) reaction time = s
- November 2021, Paper 1 Foundation, Q5(b) (2 marks): Figure 5 shows the apparatus a student uses to investigate how the stopping distance of a toy car depends on the type of surface that it is stopping on. toy car
- November 2021, Paper 1 Foundation, Q5(c)(i) (1 mark): State the anomalous value of stopping distance given in the table in Figure 6. (1)
- November 2021, Paper 1 Foundation, Q5(c)(ii) (2 marks): Use the results in Figure 6 to calculate the average stopping distance. (2) average stopping distance = m
- November 2021, Paper 1 Foundation, Q5(c)(iii) (1 mark): State one way the student could increase the speed of the car as it reaches the flat surface. (1)
- November 2020, Paper 1 Foundation, Q9(d) (6 marks): Many factors can affect the stopping distance of a car. Some of these factors involve the driver and some of these factors involve the car or the road. Explain
- June 2019, Paper 1 Higher, Q1(c) (4 marks): The graph in Figure 1 shows how the braking distance, d, of a car depends on the velocity, v, of the car when the brakes are first applied. 70 60 50 40 d in m 3
Questions, mark schemes and examiner’s reports are © Pearson Edexcel, from their published past papers. Plumi isn’t affiliated with any exam board. Want whole papers? Every Edexcel GCSE Physics paper.
Rather write your answers by hand on iPad? Plumi marks them against the same mark schemes.