 plumi
Gradients and areas under graphs: AQA GCSE Maths questions
Every AQA GCSE Maths exam question on A15 Gradients and areas under graphs, 2017–2025, with its mark scheme and examiner’s report.
Find questions1,304
Exam
All years
Calculator
All 14 questions on Gradients and areas under graphs, as a list
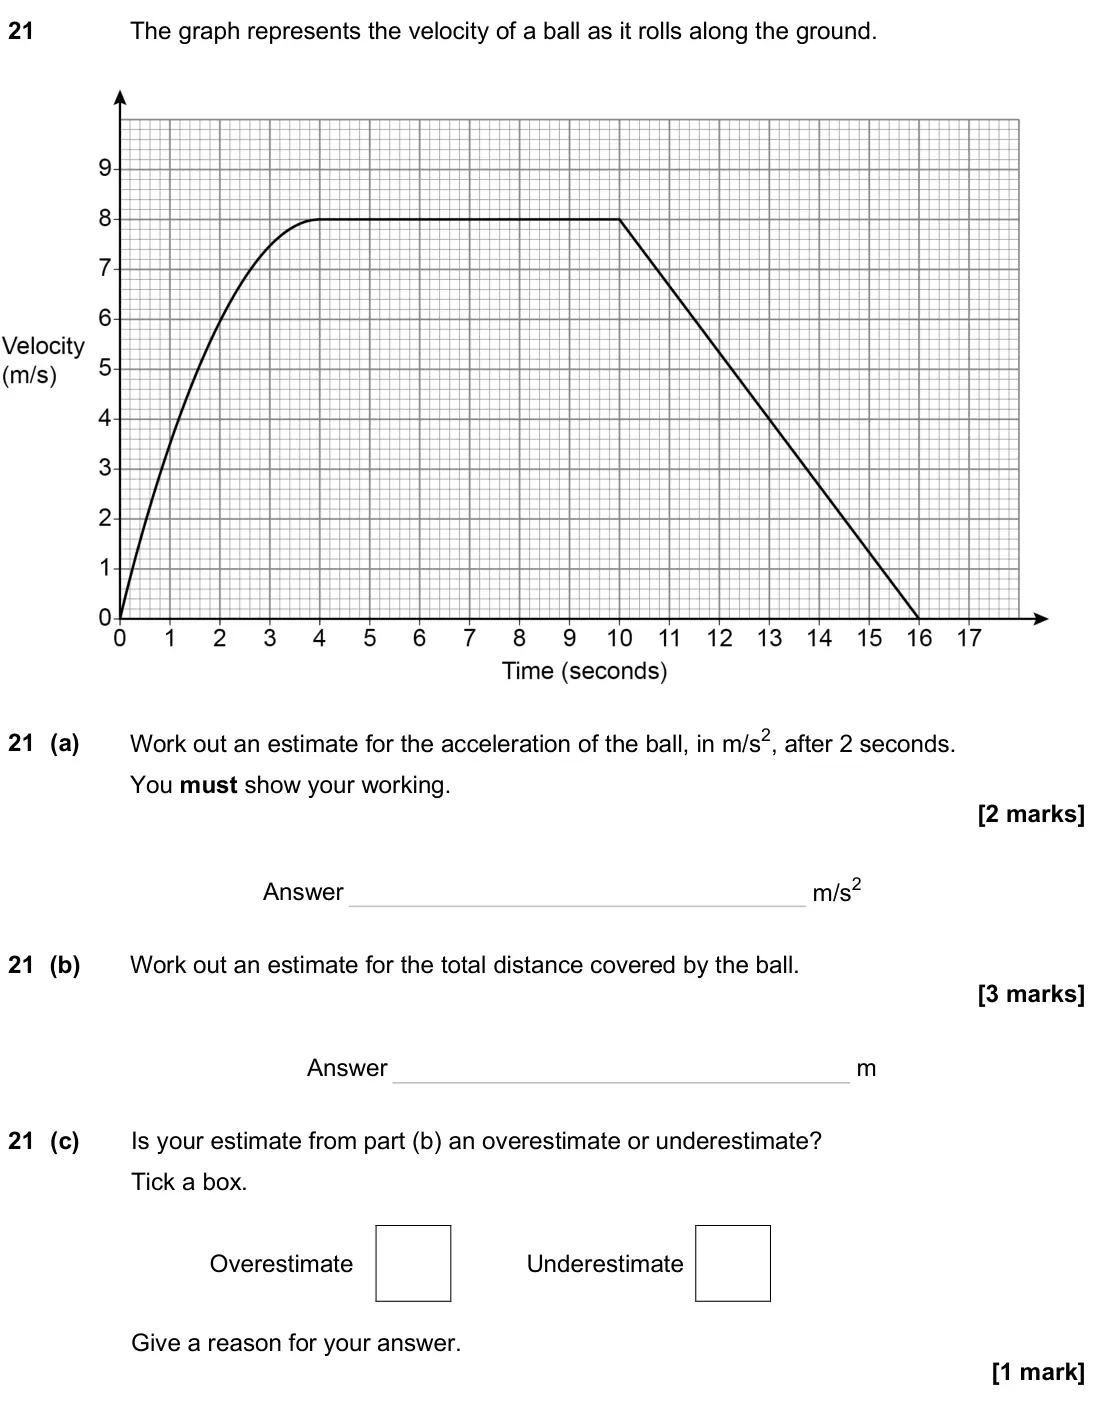
- November 2024, Paper 2H, Q21 (6 marks): The graph represents the velocity of a ball as it rolls along the ground. 21 (a) Work out an estimate for the acceleration of the ball, in m/s2, after 2 seconds
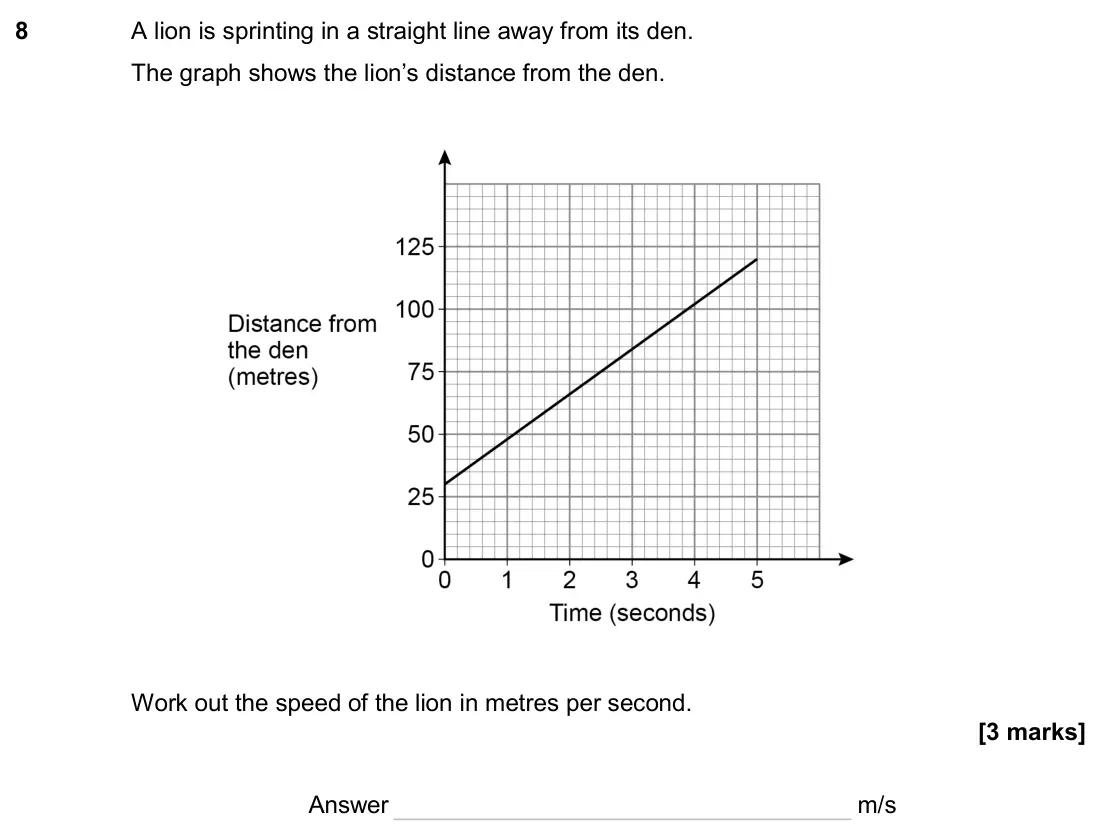
- June 2024, Paper 2H, Q8 (3 marks): A lion is sprinting in a straight line away from its den. The graph shows the lion’s distance from the den. Work out the speed of the lion in metres per second.
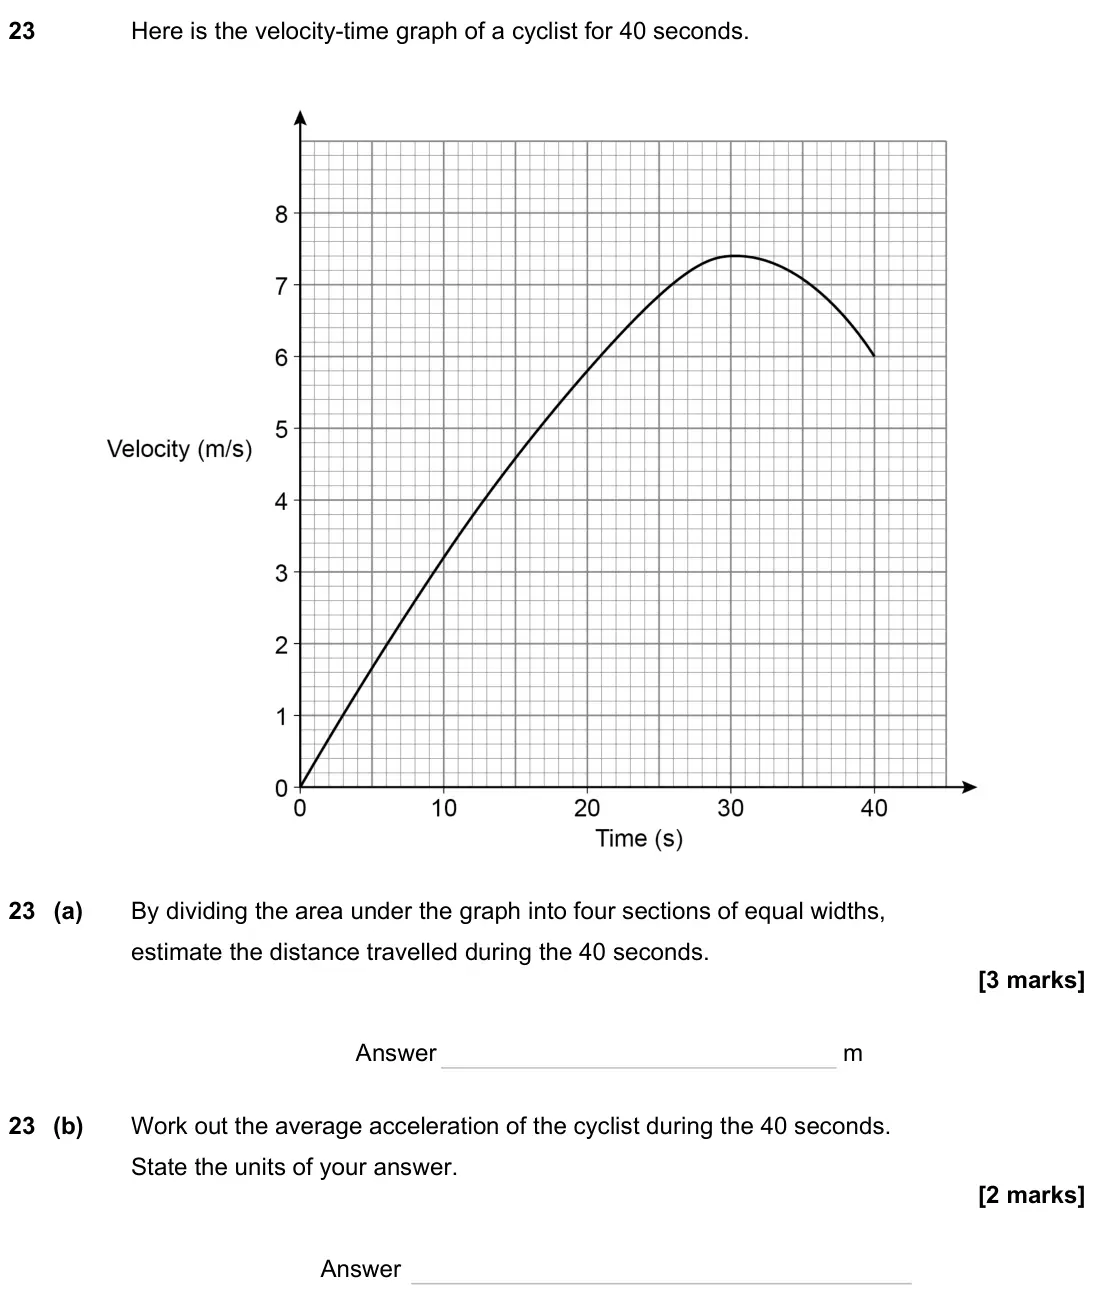
- November 2023, Paper 2H, Q23 (5 marks): Here is the velocity-time graph of a cyclist for 40 seconds. 23 (a) By dividing the area under the graph into four sections of equal widths, estimate the distan
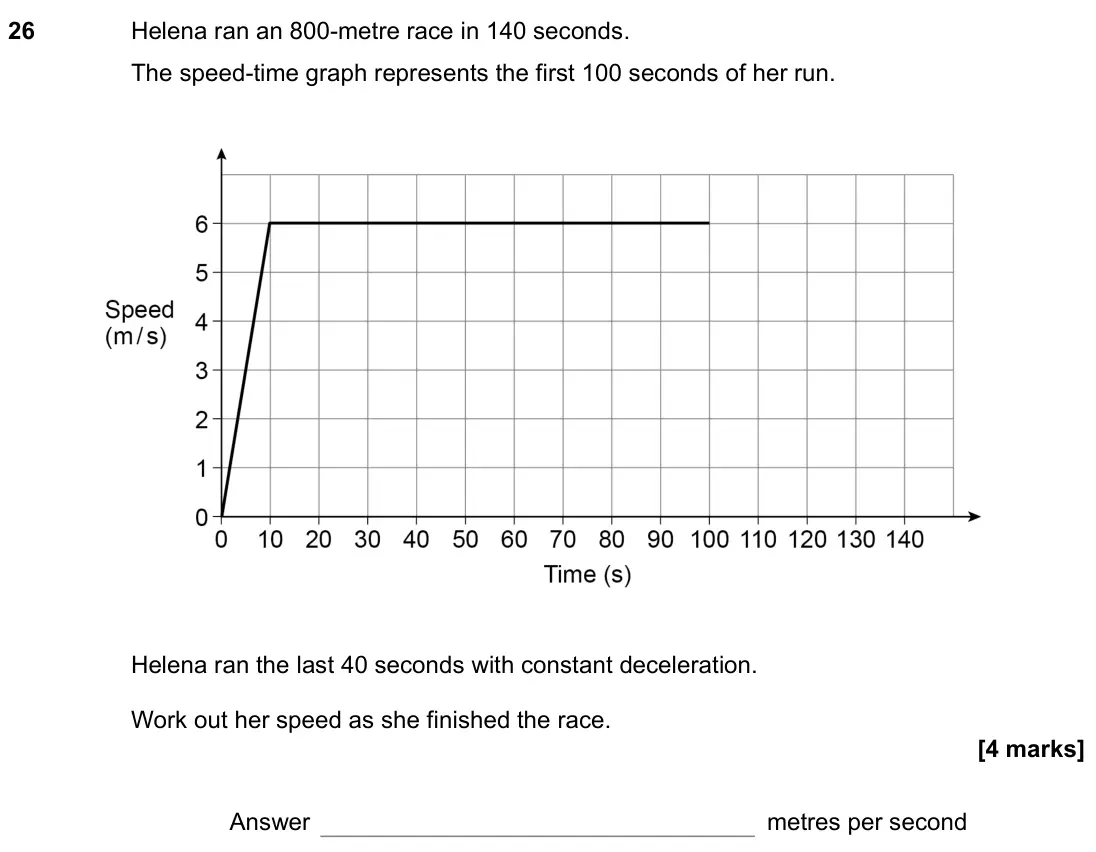
- November 2022, Paper 2H, Q26 (4 marks): Helena ran an 800-metre race in 140 seconds. The speed-time graph represents the first 100 seconds of her run. Helena ran the last 40 seconds with constant dece
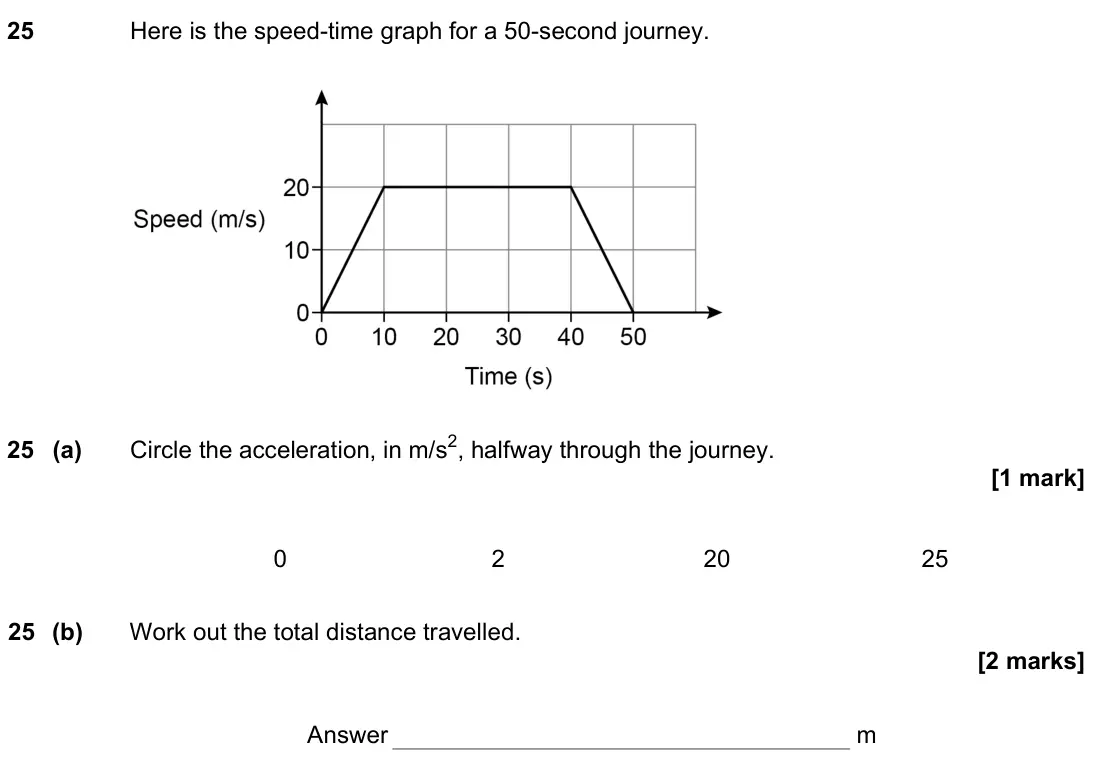
- June 2022, Paper 1H, Q25 (3 marks): Here is the speed-time graph for a 50-second journey. 25 (a) Circle the acceleration, in m/s2, halfway through the journey. 0 2 20 25 25 (b) Work out the total
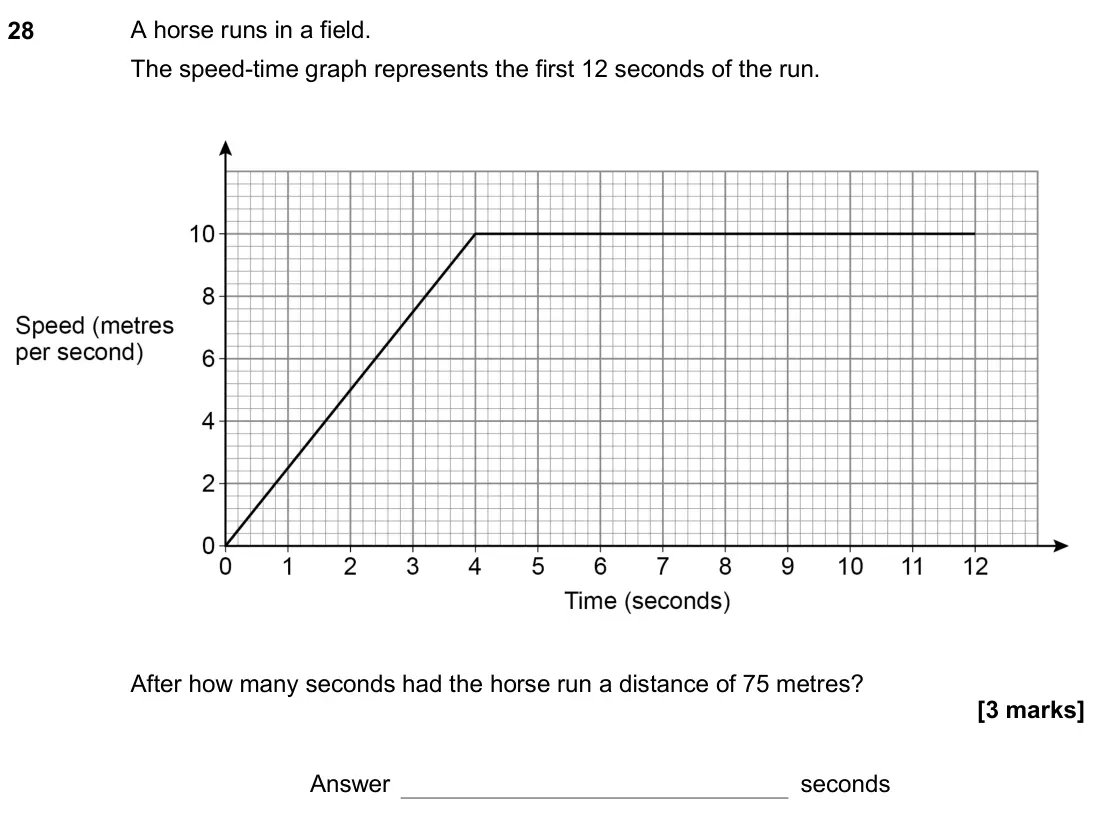
- November 2020, Paper 2H, Q28 (3 marks): A horse runs in a field. The speed-time graph represents the first 12 seconds of the run. After how many seconds had the horse run a distance of 75 metres? Answ
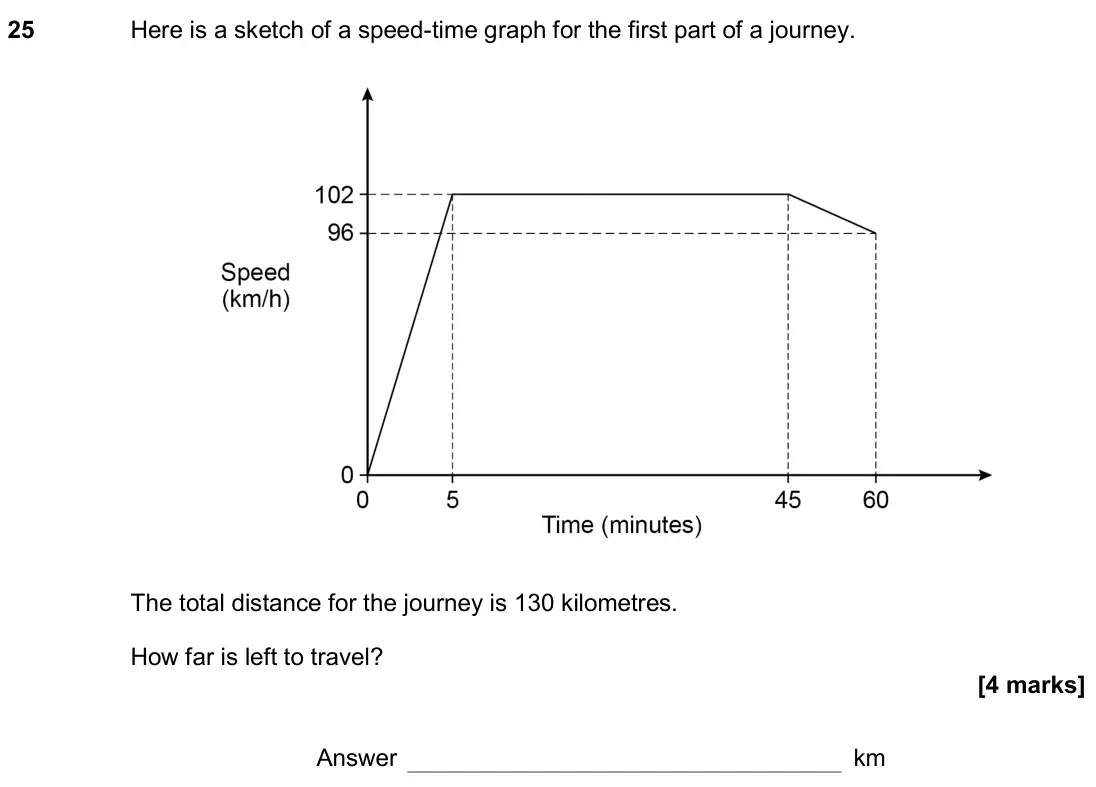
- November 2019, Paper 3H, Q25 (4 marks): Here is a sketch of a speed-time graph for the first part of a journey. The total distance for the journey is 130 kilometres. How far is left to travel? Answer
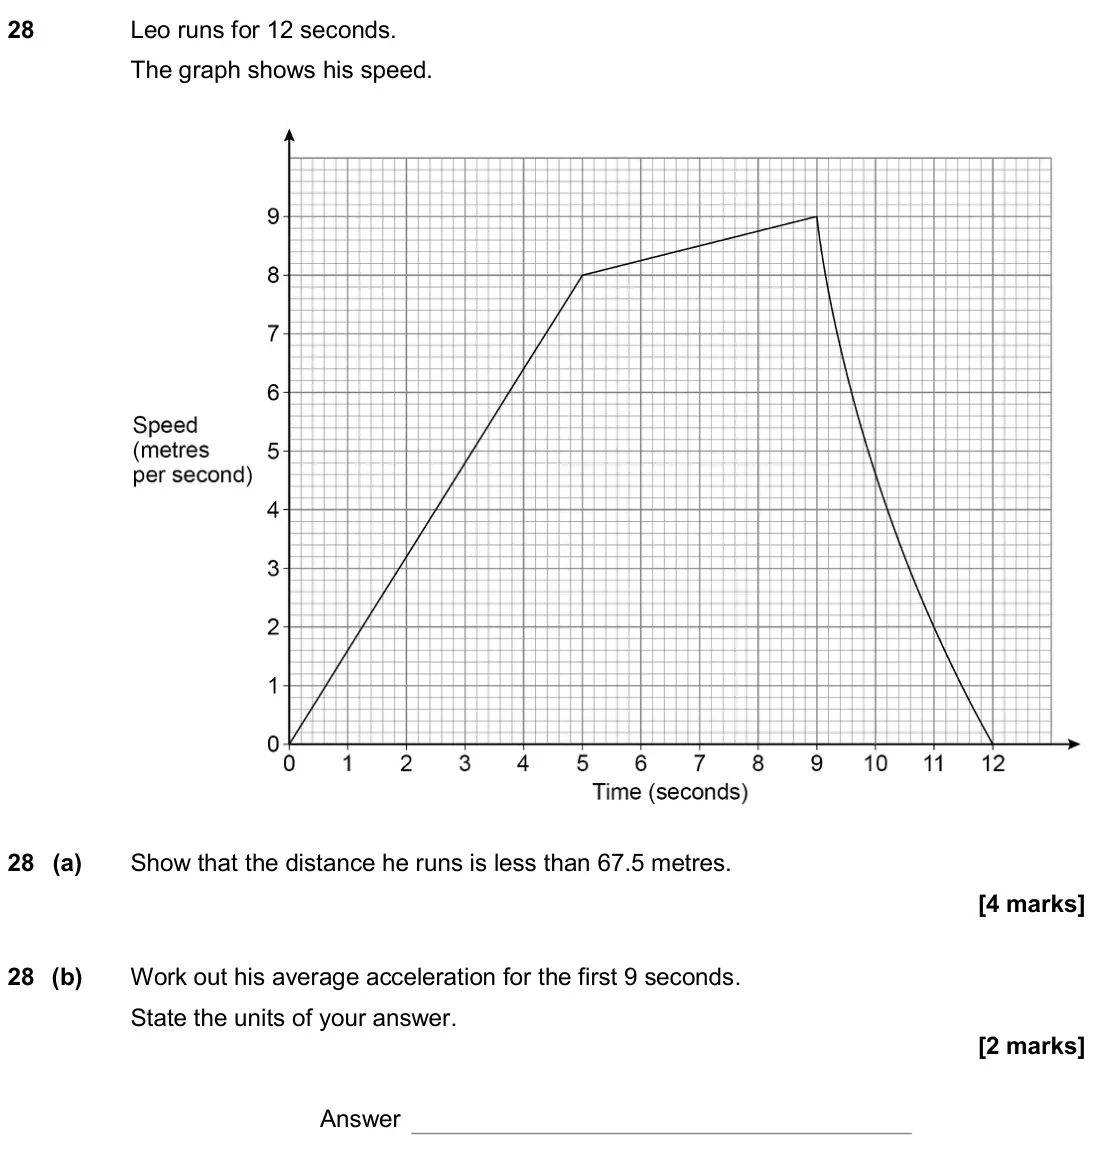
- June 2019, Paper 3H, Q28 (6 marks): Leo runs for 12 seconds. The graph shows his speed. 28 (a) Show that the distance he runs is less than 67.5 metres. 28 (b) Work out his average acceleration for
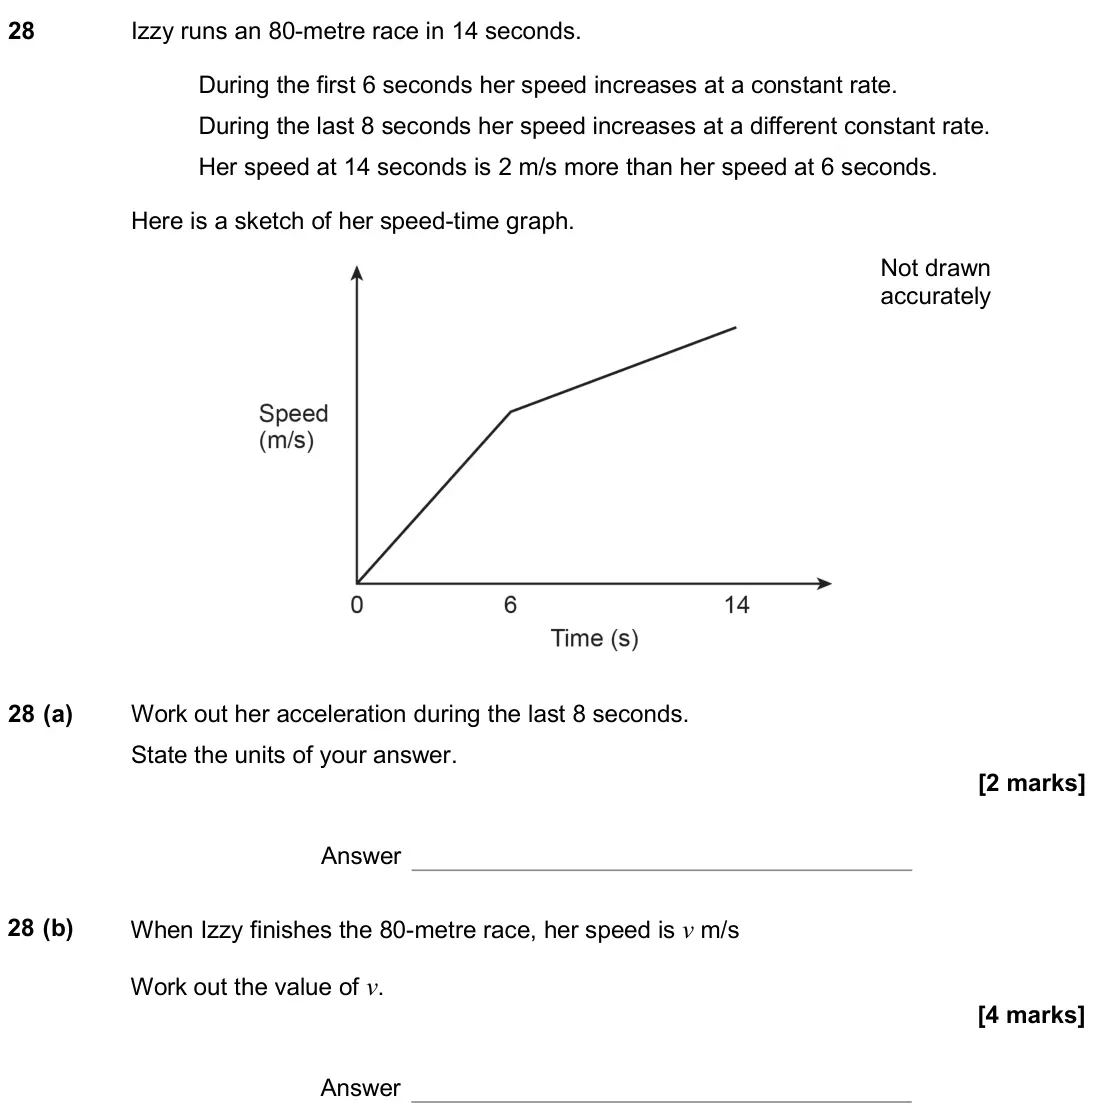
- November 2018, Paper 2H, Q28 (6 marks): Izzy runs an 80-metre race in 14 seconds. During the first 6 seconds her speed increases at a constant rate. During the last 8 seconds her speed increases at a
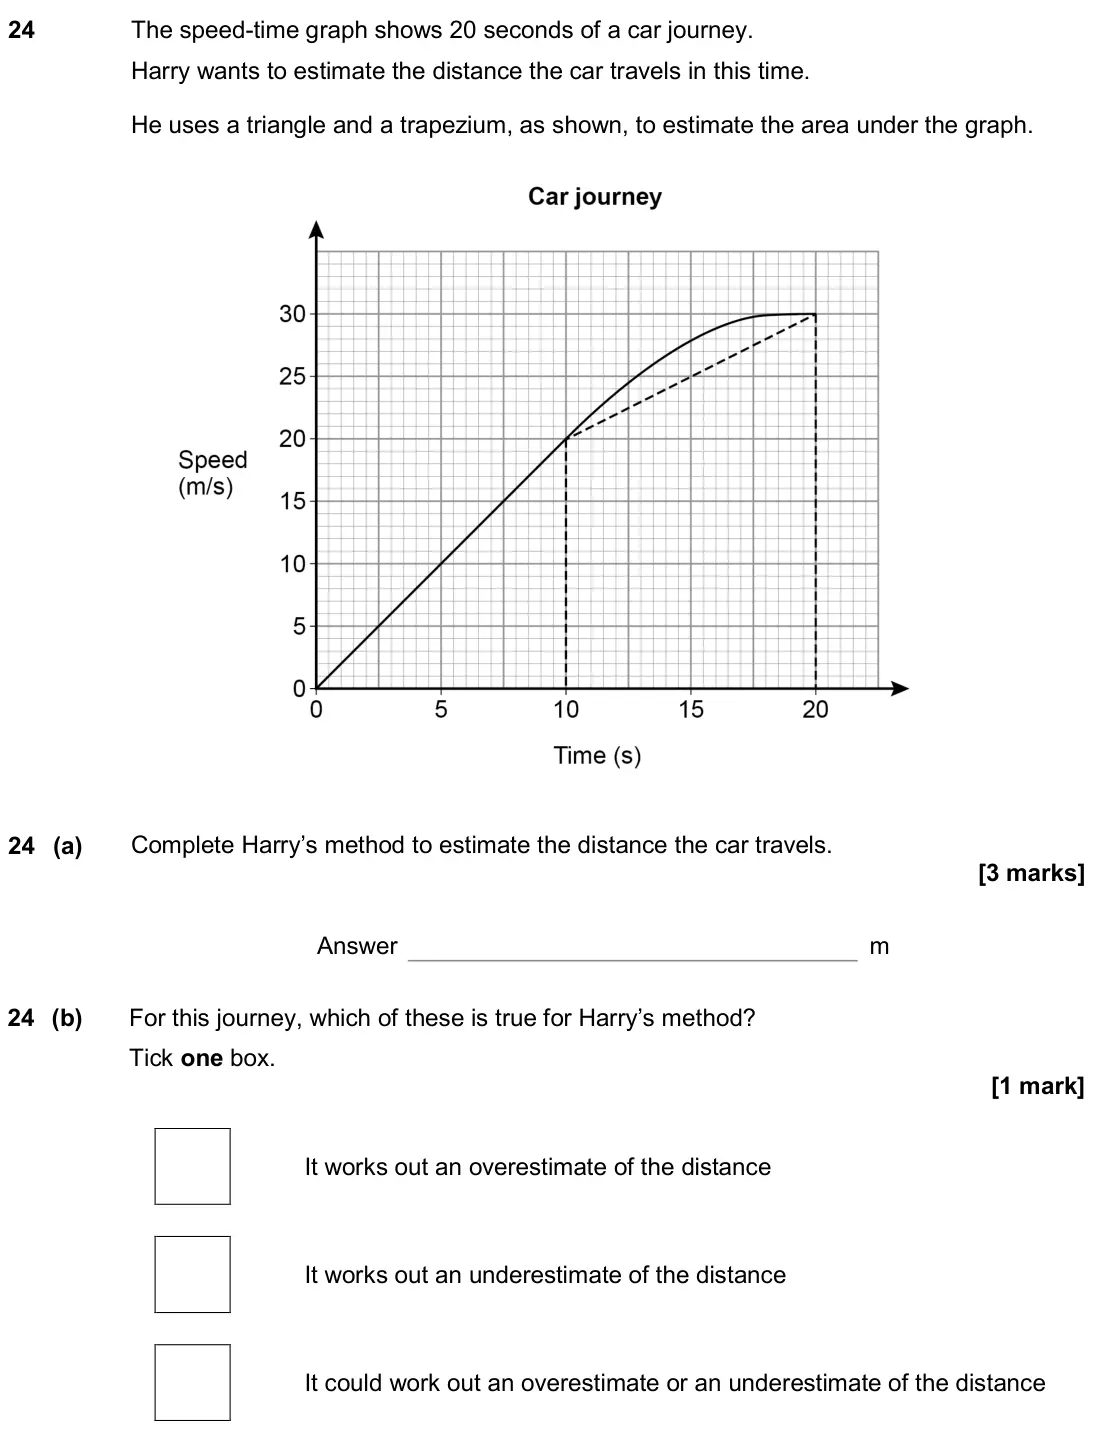
- June 2018, Paper 3H, Q24 (4 marks): The speed-time graph shows 20 seconds of a car journey. Harry wants to estimate the distance the car travels in this time. He uses a triangle and a trapezium, a
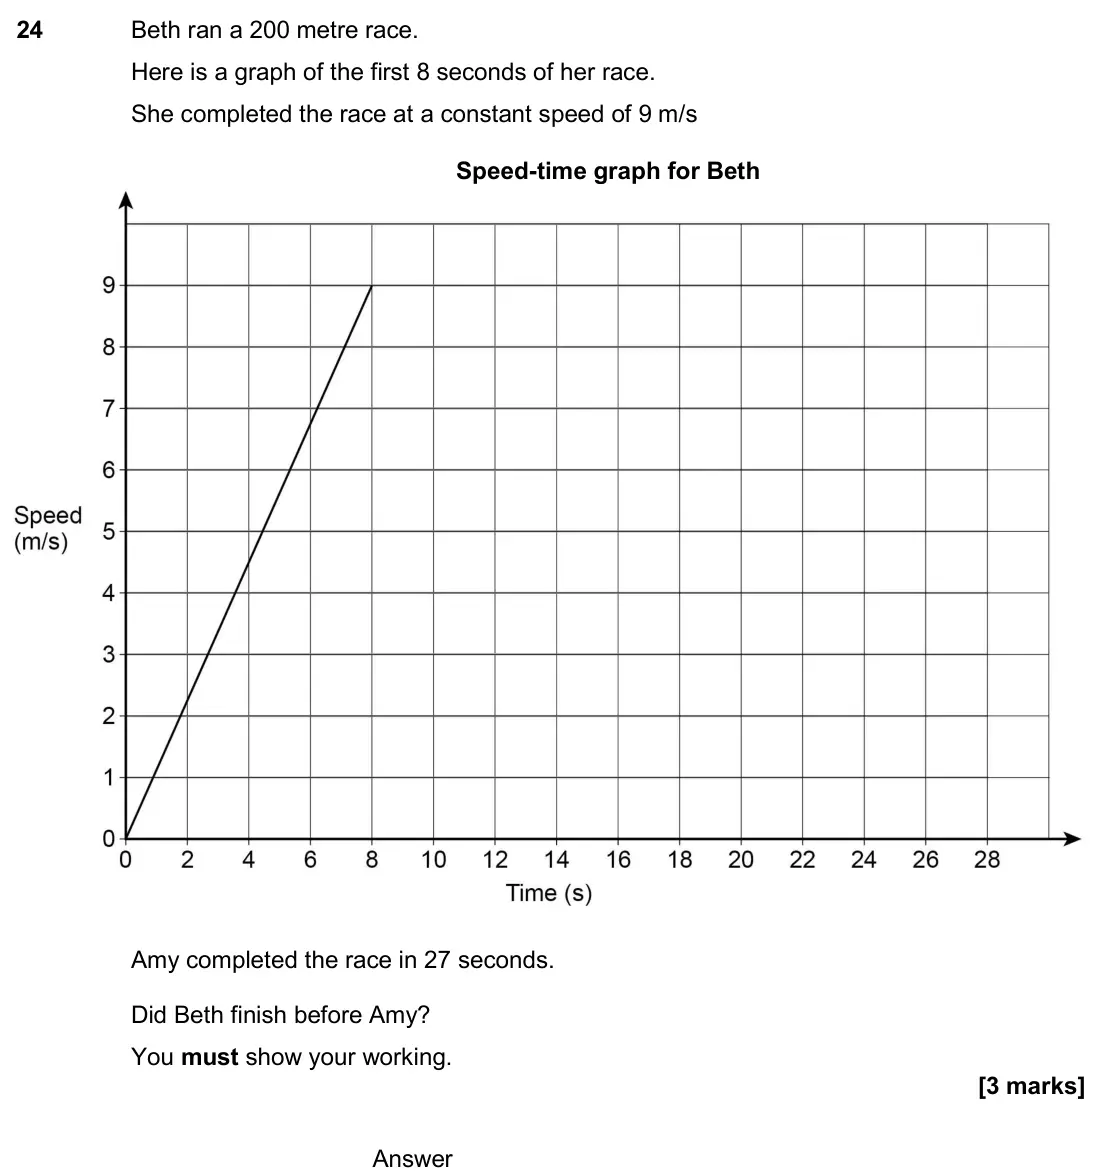
- November 2017, Paper 2H, Q24 (3 marks): Beth ran a 200 metre race. Here is a graph of the first 8 seconds of her race. She completed the race at a constant speed of 9 m/s Speed-time graph for Beth Amy
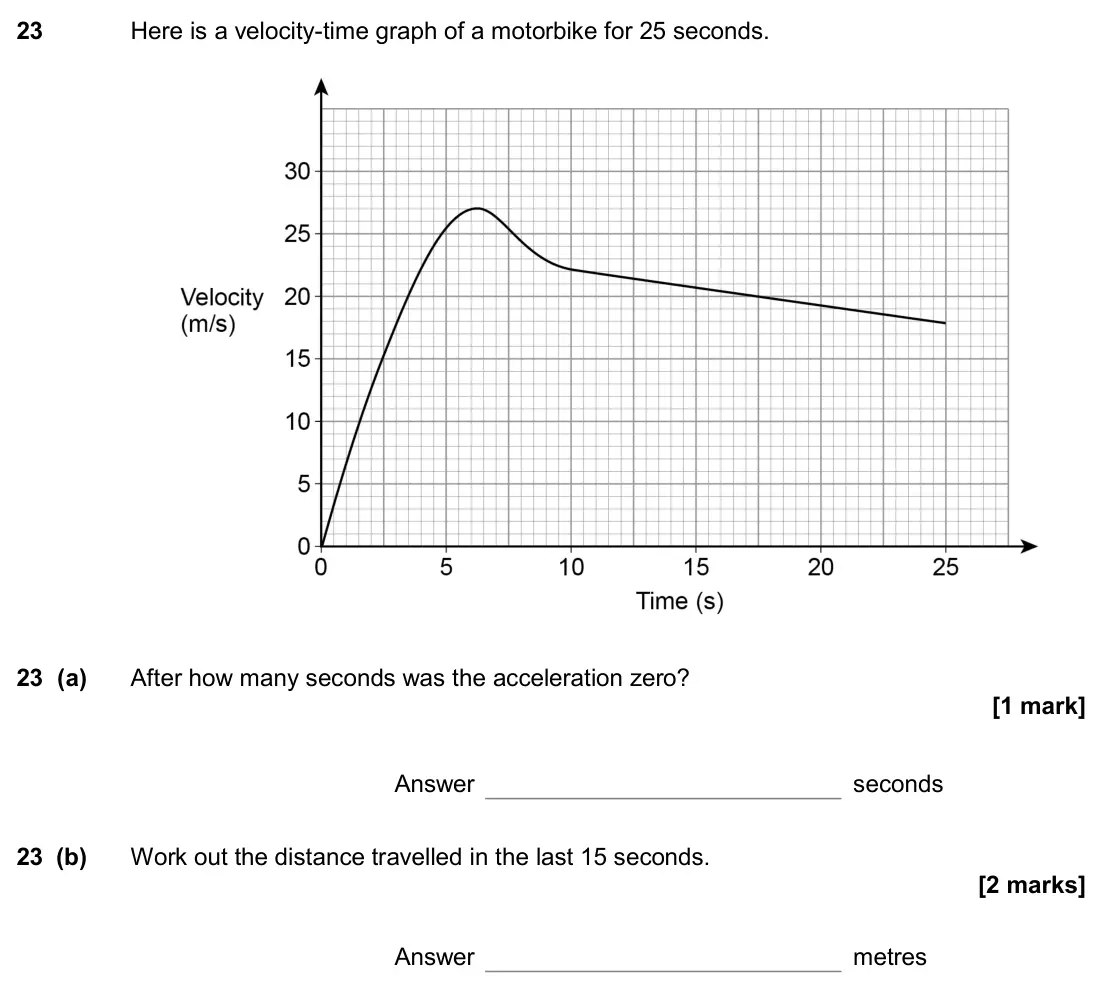
- June 2017, Paper 1H, Q23 (3 marks): Here is a velocity-time graph of a motorbike for 25 seconds. 23 (a) After how many seconds was the acceleration zero? Answer seconds 23 (b) Work out the distanc
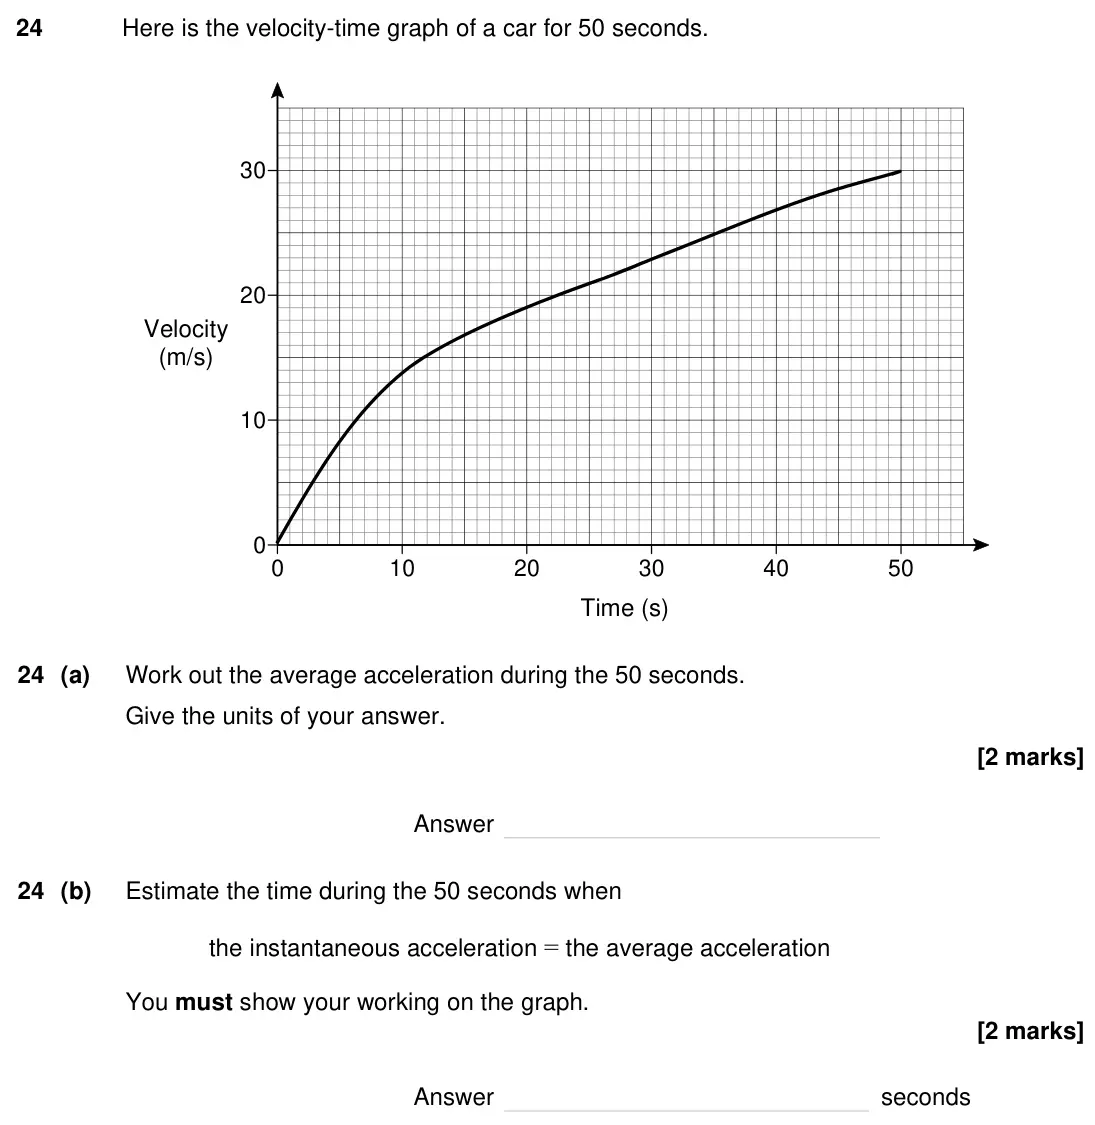
- Specimen, Paper 1H, Q24 (4 marks): Here is the velocity-time graph of a car for 50 seconds. 0 10 20 30 40 50 0 10 20 30 Time (s) Velocity (m/s) 24 (a) Work out the average acceleration during the
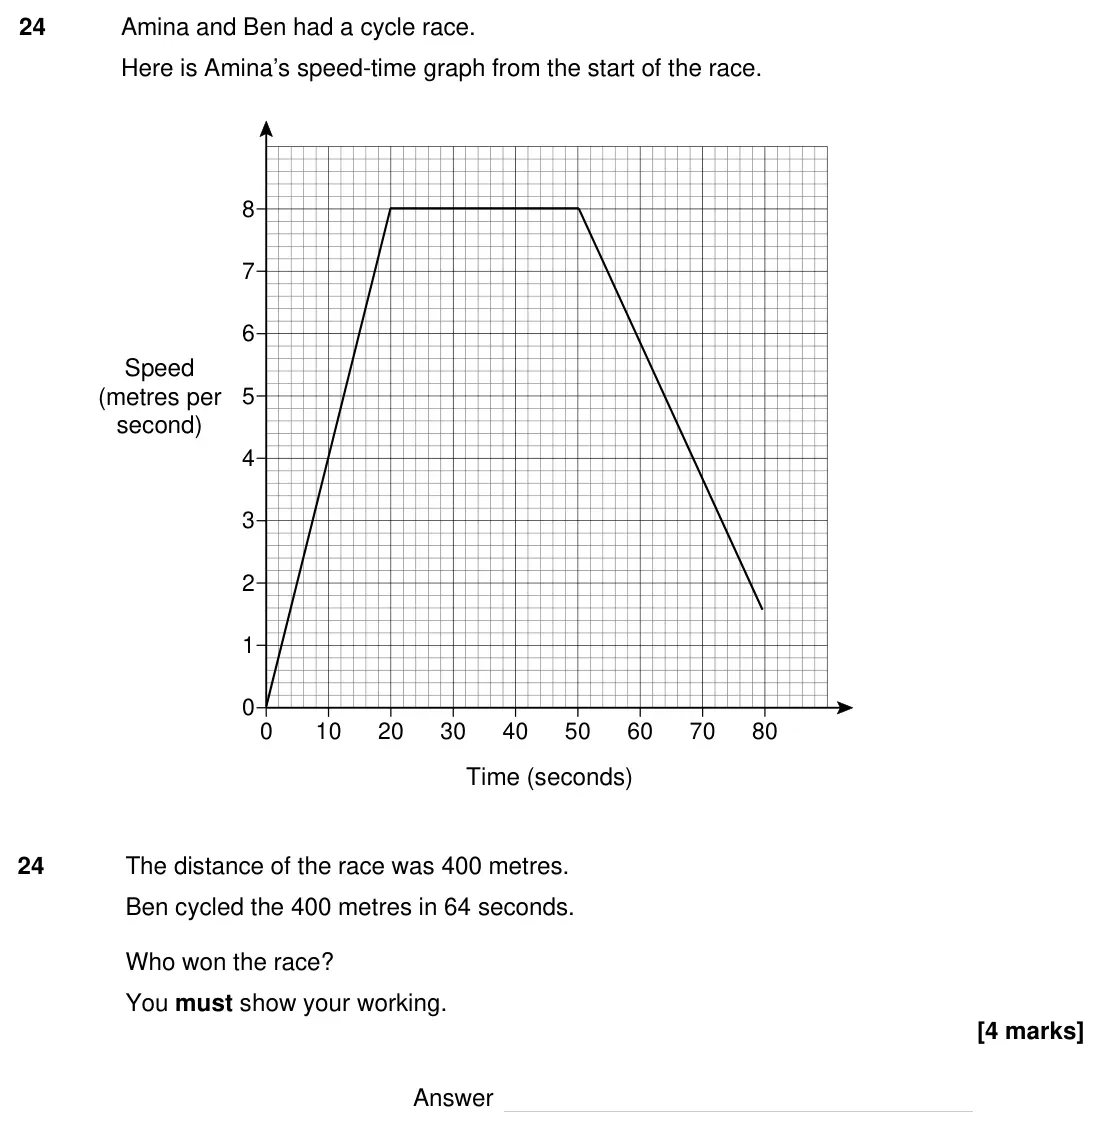
- Specimen, Paper 3H, Q24 (4 marks): Amina and Ben had a cycle race. Here is Amina’s speed-time graph from the start of the race. 0 10 20 30 40 50 60 70 80 0 1 2 3 4 5 6 7 8 Speed (metres per secon
Questions, mark schemes and examiner’s reports are © AQA, from their published past papers. Plumi isn’t affiliated with any exam board. Want whole papers? Every AQA GCSE Maths paper.
Rather write your answers by hand on iPad? Plumi marks them against the same mark schemes.