 plumi
Oscillations and waves: OxfordAQA International A Level Physics questions
OxfordAQA International A Level Physics past-paper questions on 3.5 Oscillations and waves, Official specimen papers for Units 1–5, with mark schemes and examiner’s reports where available.
Past paper difficulty
Paper
All papers
Exam
All years
Calculations
Loading the full question list…
Q01.1
The whole paper ↗Q01.2
The whole paper ↗Q01.3
The whole paper ↗Q09.1
The whole paper ↗Q09.2
The whole paper ↗Q09.3
The whole paper ↗Q09.4
The whole paper ↗Q09.5
The whole paper ↗Q09.6
The whole paper ↗Q11.1
The whole paper ↗Q11.2
The whole paper ↗

All 38 questions on Oscillations and waves, as a list
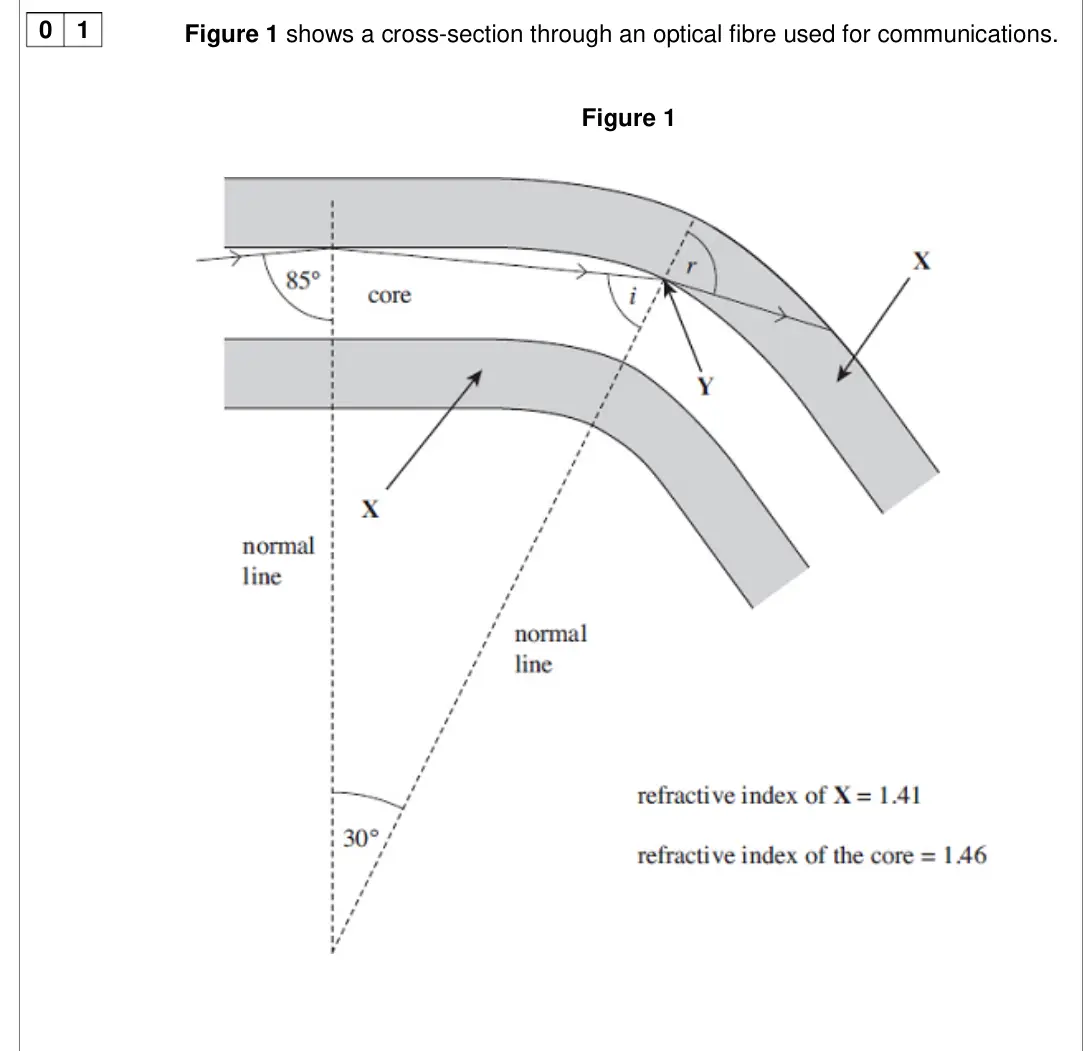
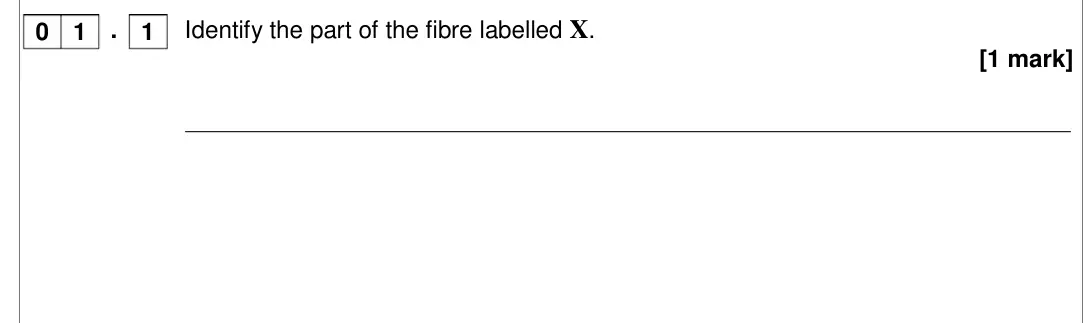
- Specimen, Unit 2, Q01.1 (1 mark): Figure 1 shows a cross-section through an optical fibre used for communications. Figure 1 0 1 Identify the part of the fibre labelled X. [1 mark] 0 1 . 1 3
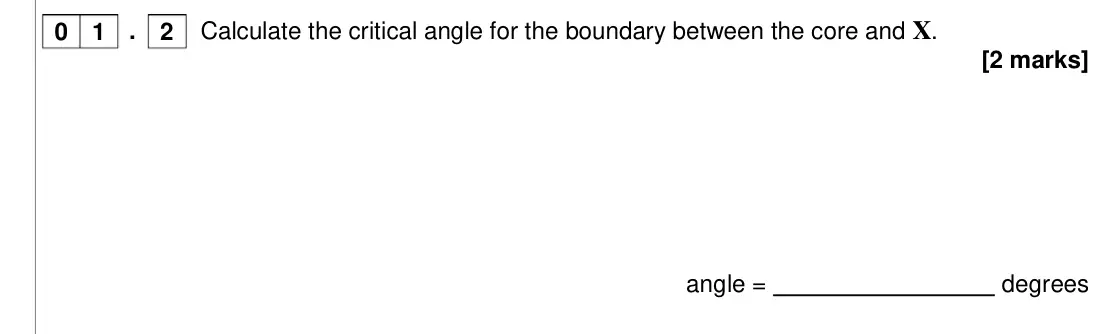
- Specimen, Unit 2, Q01.2 (2 marks): Figure 1 shows a cross-section through an optical fibre used for communications. Figure 1 0 1 Calculate the critical angle for the boundary between the core and X. [2 marks] . angl
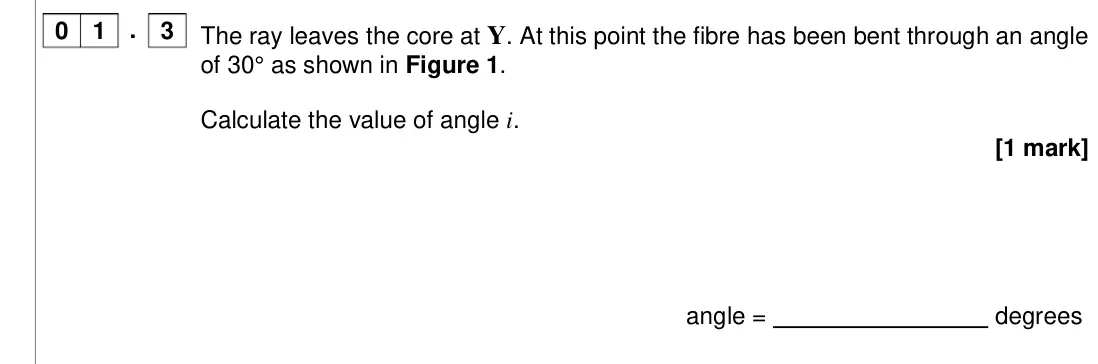
- Specimen, Unit 2, Q01.3 (1 mark): Figure 1 shows a cross-section through an optical fibre used for communications. Figure 1 0 1 The ray leaves the core at Y. At this point the fibre has been bent through an angle o
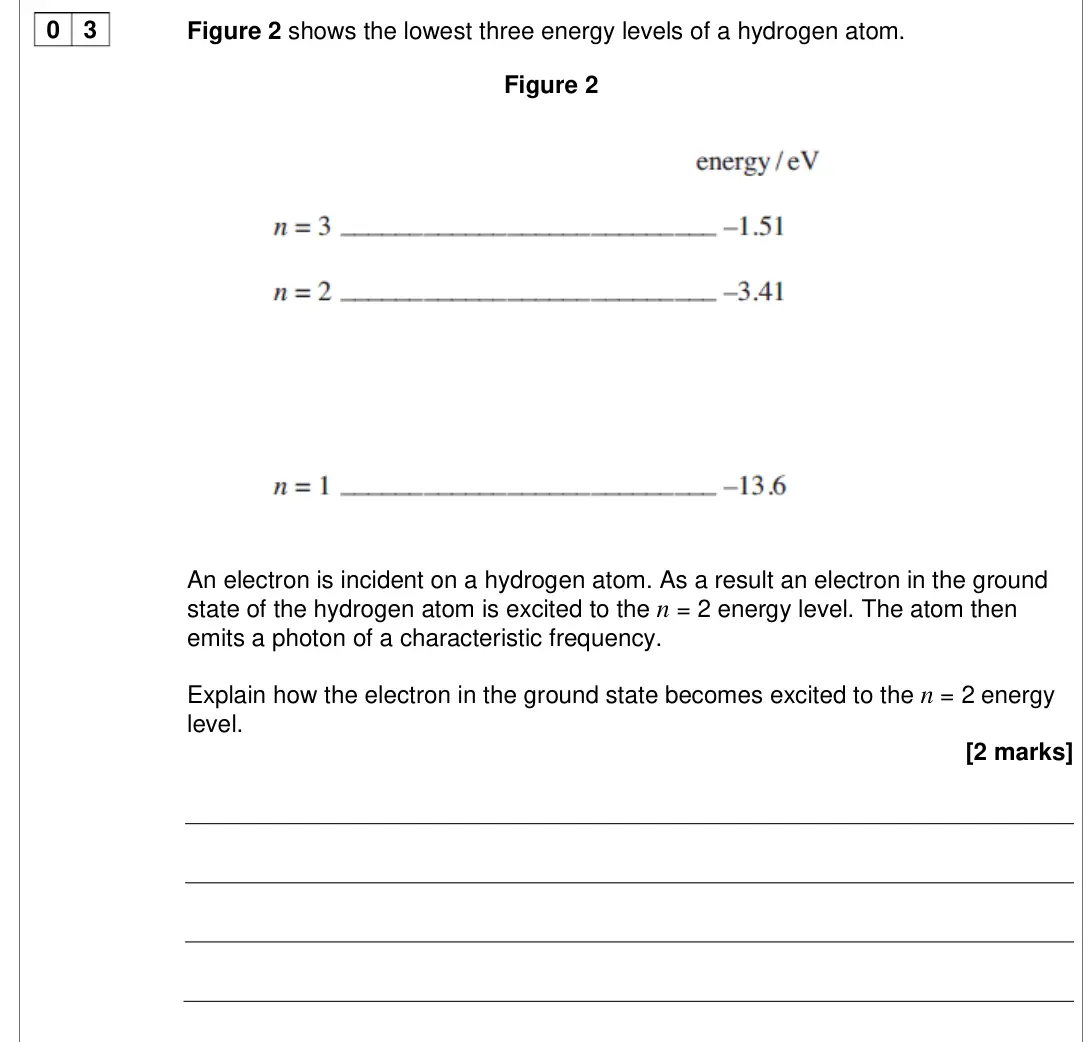
- Specimen, Unit 2, Q03 (2 marks): Figure 2 shows the lowest three energy levels of a hydrogen atom. Figure 2 An electron is incident on a hydrogen atom. As a result an electron in the ground state of the hydrogen a
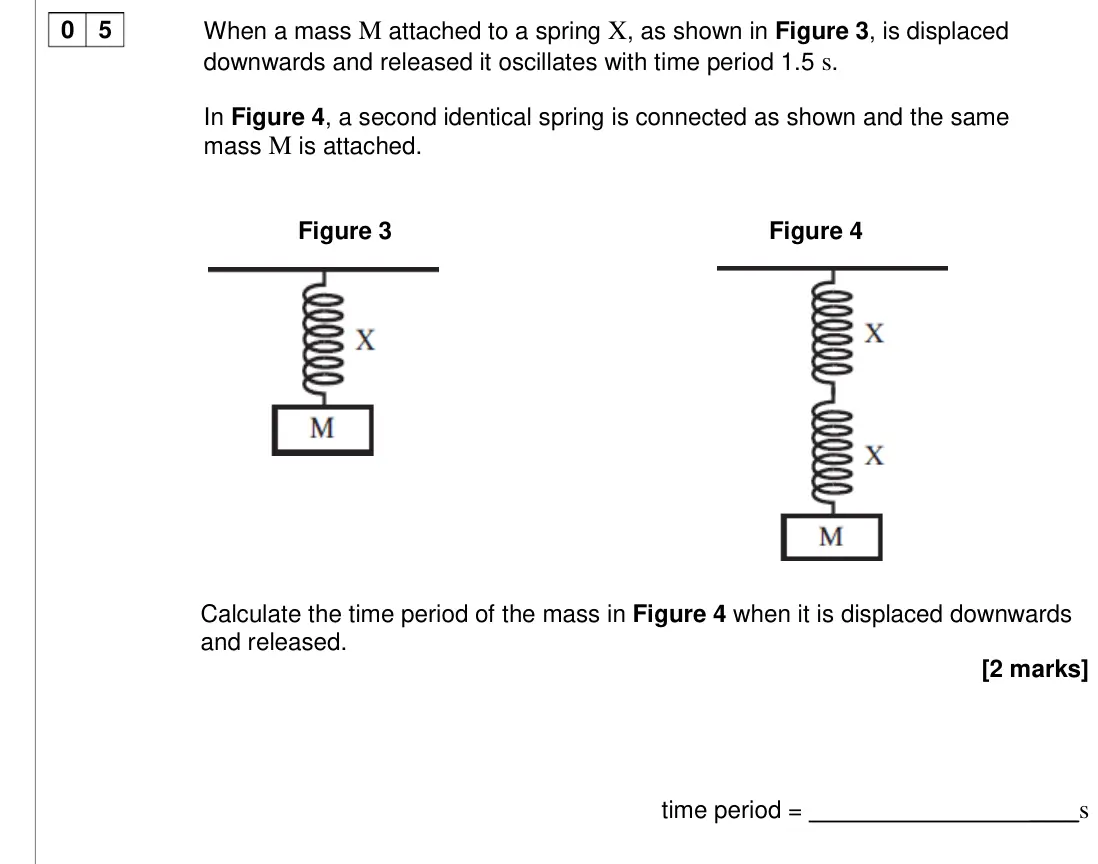
- Specimen, Unit 2, Q05 (2 marks): Calculate the time period of the mass in Figure 4 when it is displaced downwards and released. [2 marks] time period = ____s When a mass M attached to a spring X, as shown in Figur
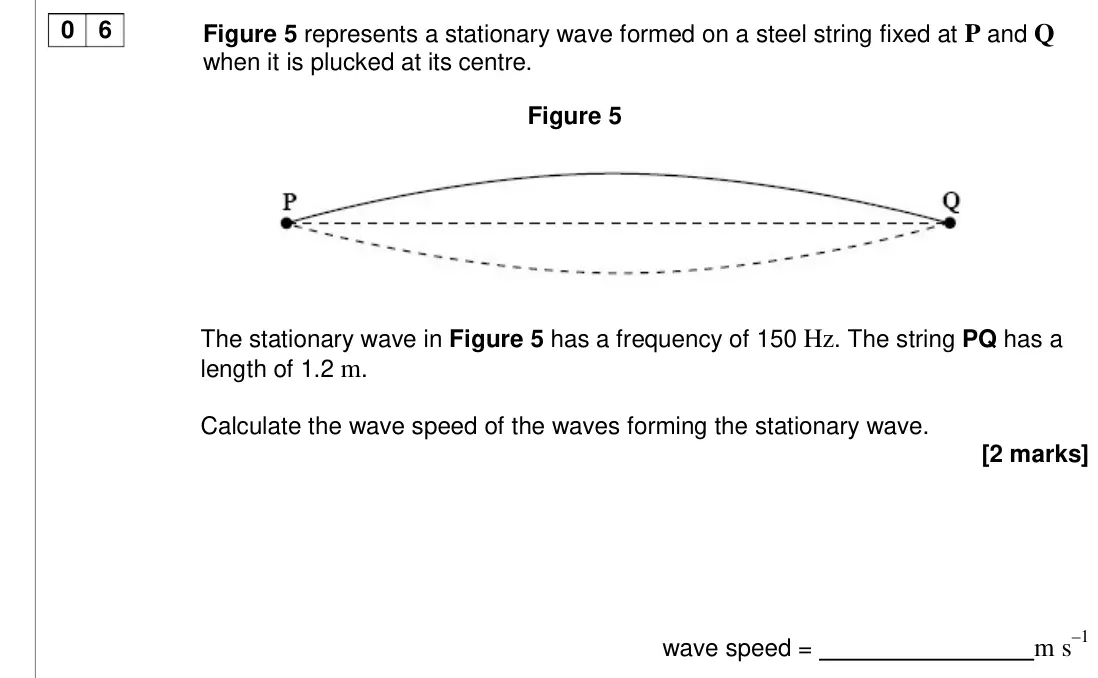
- Specimen, Unit 2, Q06 (2 marks): Figure 5 represents a stationary wave formed on a steel string fixed at P and Q when it is plucked at its centre. Figure 5 The stationary wave in Figure 5 has a frequency of 150 Hz
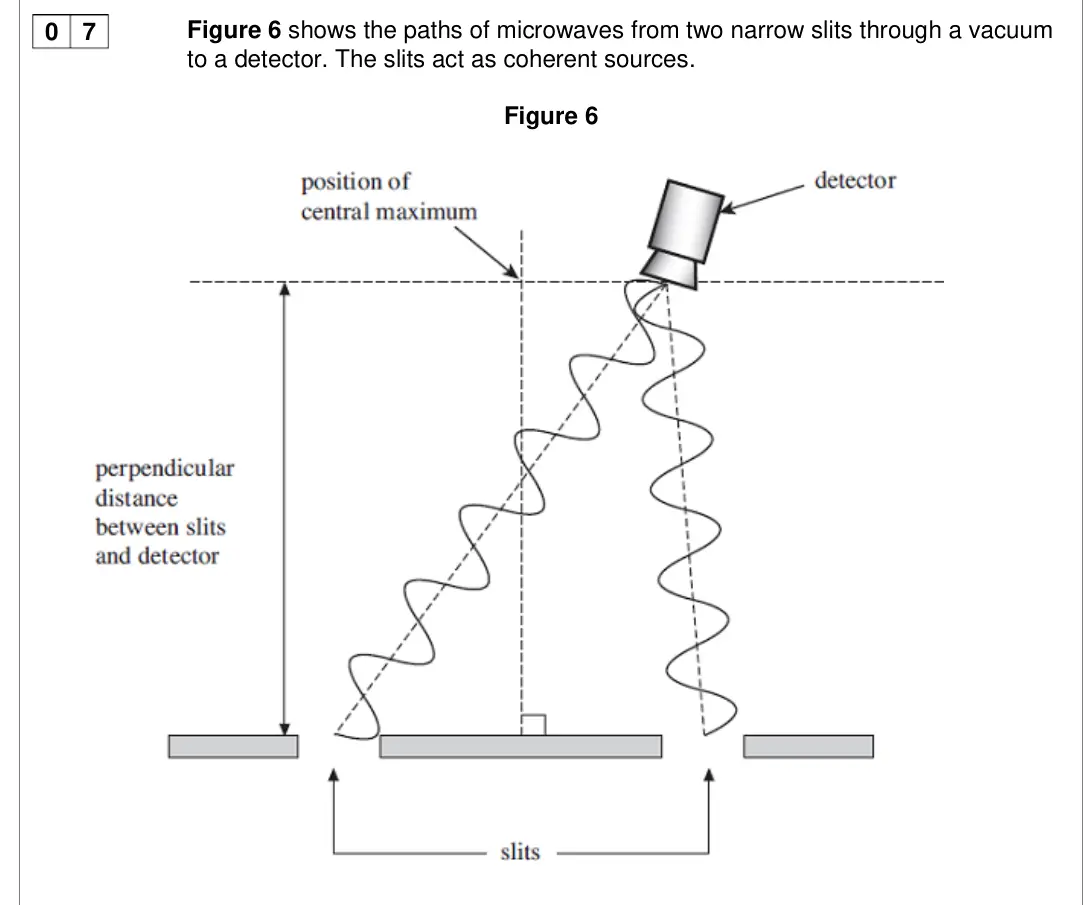
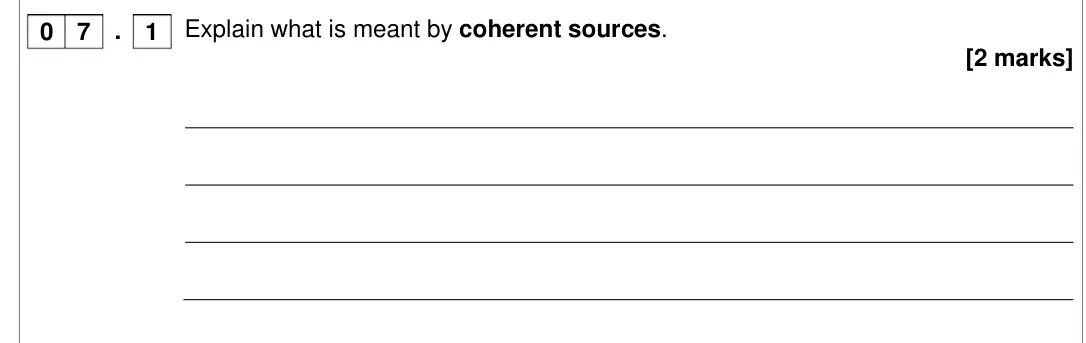
- Specimen, Unit 2, Q07.1 (2 marks): Figure 6 shows the paths of microwaves from two narrow slits through a vacuum to a detector. The slits act as coherent sources. Figure 6 0 7 Explain what is meant by coherent sourc
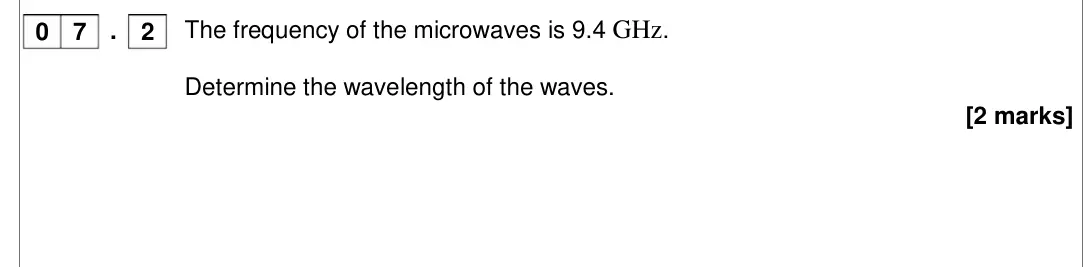
- Specimen, Unit 2, Q07.2 (2 marks): Figure 6 shows the paths of microwaves from two narrow slits through a vacuum to a detector. The slits act as coherent sources. Figure 6 0 7 The frequency of the microwaves is 9.4
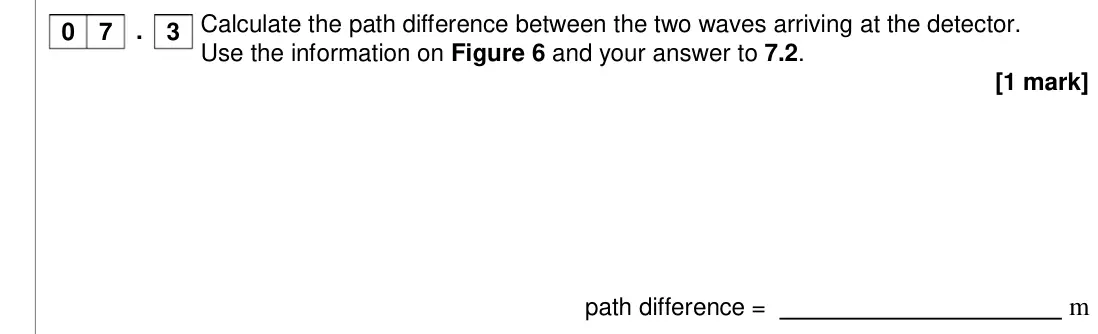
- Specimen, Unit 2, Q07.3 (1 mark): Figure 6 shows the paths of microwaves from two narrow slits through a vacuum to a detector. The slits act as coherent sources. Figure 6 0 7 Calculate the path difference between t
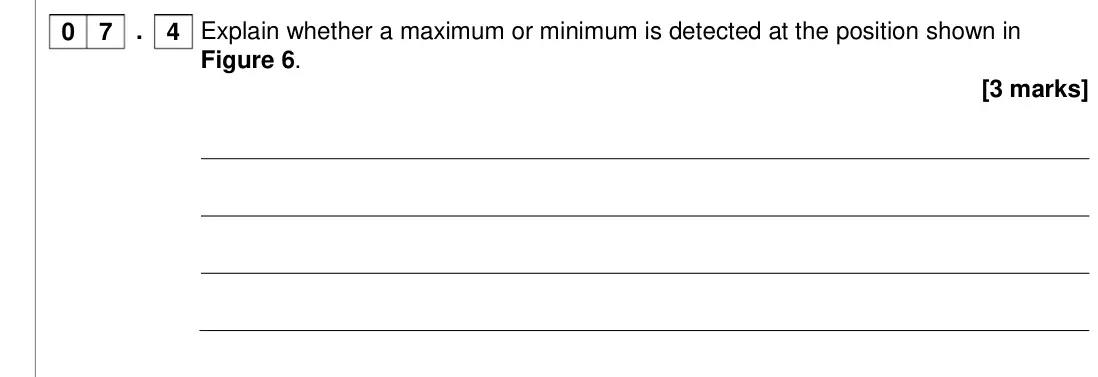
- Specimen, Unit 2, Q07.4 (3 marks): Figure 6 shows the paths of microwaves from two narrow slits through a vacuum to a detector. The slits act as coherent sources. Figure 6 0 7 Explain whether a maximum or minimum is
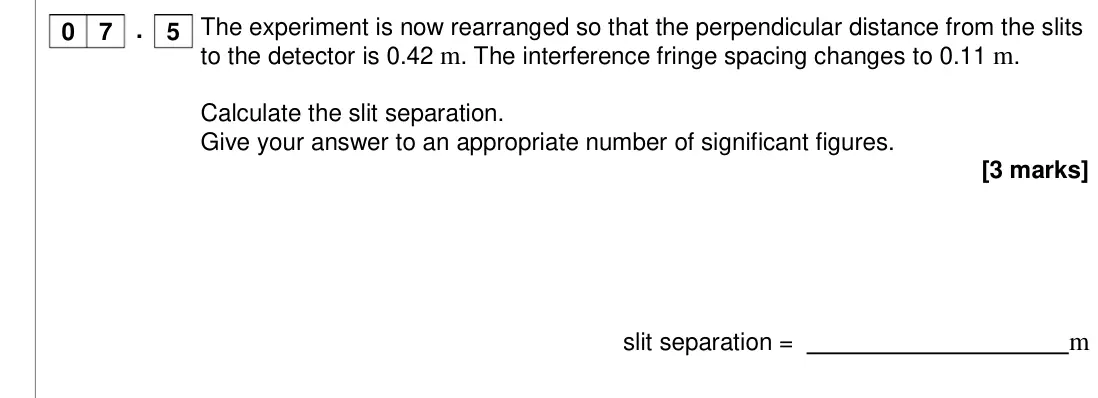
- Specimen, Unit 2, Q07.5 (3 marks): Figure 6 shows the paths of microwaves from two narrow slits through a vacuum to a detector. The slits act as coherent sources. Figure 6 0 7 The experiment is now rearranged so tha
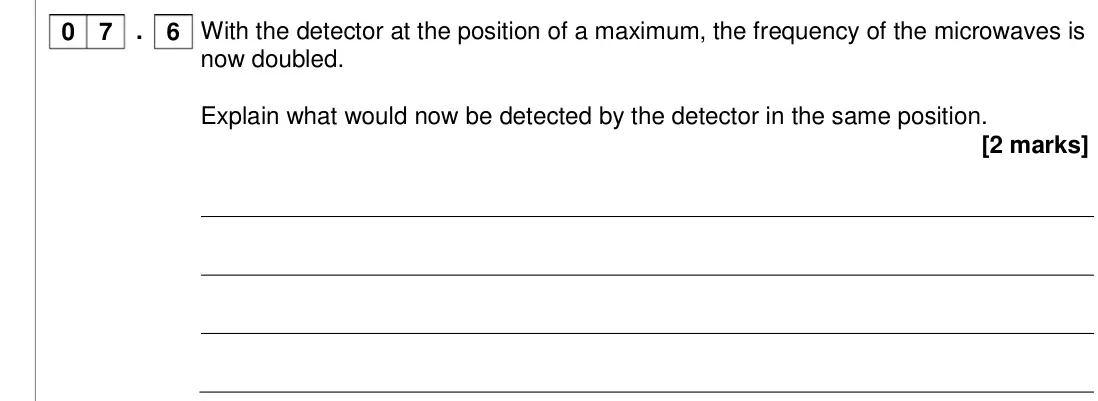
- Specimen, Unit 2, Q07.6 (2 marks): Figure 6 shows the paths of microwaves from two narrow slits through a vacuum to a detector. The slits act as coherent sources. Figure 6 0 7 With the detector at the position of a
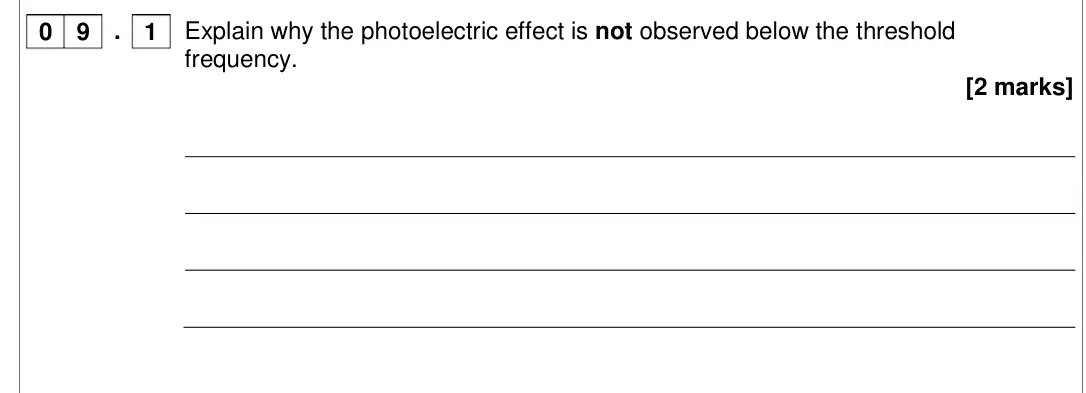
- Specimen, Unit 2, Q09.1 (2 marks): Experiments based on the photoelectric effect support the particle nature of light. In such experiments, light is directed at a metal surface. A threshold frequency for this light
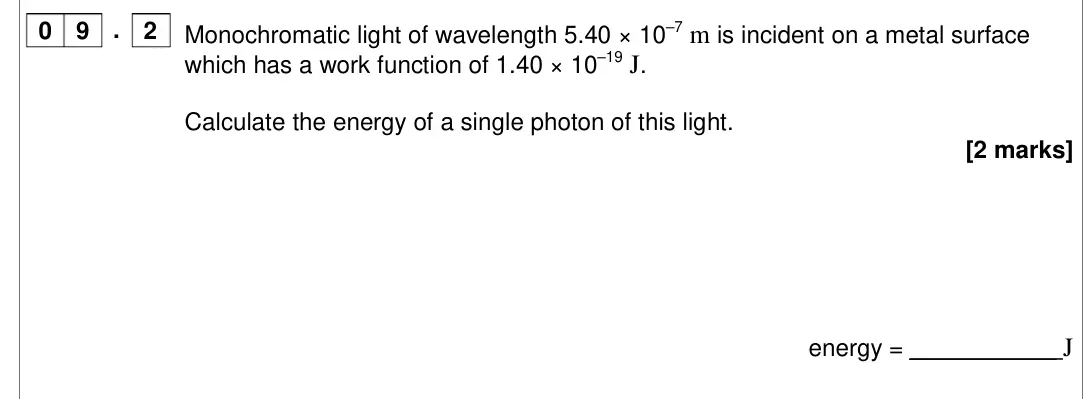
- Specimen, Unit 2, Q09.2 (2 marks): Experiments based on the photoelectric effect support the particle nature of light. In such experiments, light is directed at a metal surface. A threshold frequency for this light
- Specimen, Unit 2, Q09.3 (1 mark): Experiments based on the photoelectric effect support the particle nature of light. In such experiments, light is directed at a metal surface. A threshold frequency for this light
- Specimen, Unit 2, Q09.4 (2 marks): Experiments based on the photoelectric effect support the particle nature of light. In such experiments, light is directed at a metal surface. A threshold frequency for this light
- Specimen, Unit 2, Q09.5 (2 marks): Experiments based on the photoelectric effect support the particle nature of light. In such experiments, light is directed at a metal surface. A threshold frequency for this light
- Specimen, Unit 2, Q09.6 (2 marks): Experiments based on the photoelectric effect support the particle nature of light. In such experiments, light is directed at a metal surface. A threshold frequency for this light
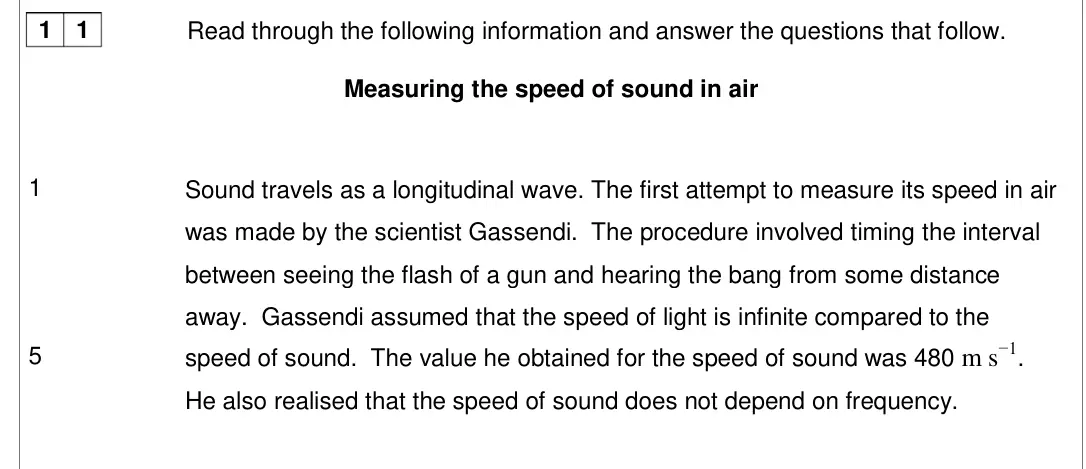
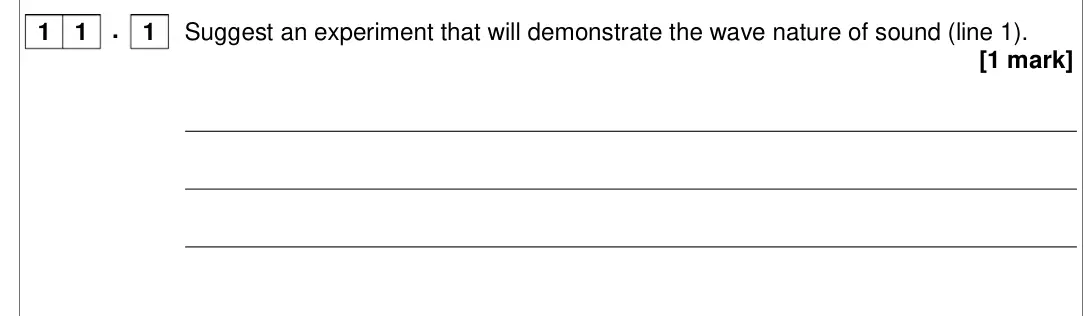
- Specimen, Unit 2, Q11.1 (1 mark): Read through the following information and answer the questions that follow. Measuring the speed of sound in air 1 5 Sound travels as a longitudinal wave. The first attempt to meas
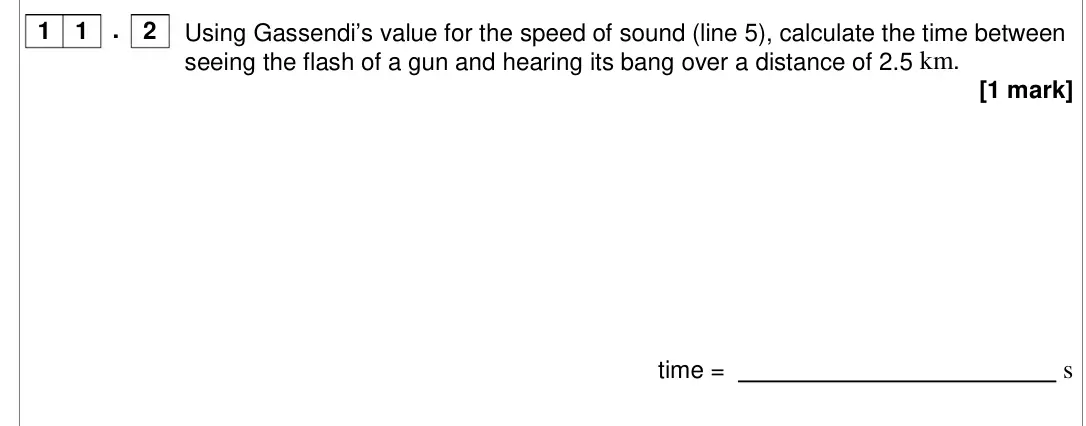
- Specimen, Unit 2, Q11.2 (1 mark): Read through the following information and answer the questions that follow. Measuring the speed of sound in air 1 5 Sound travels as a longitudinal wave. The first attempt to meas
- Specimen, Unit 2, Q11.3 (1 mark): Read through the following information and answer the questions that follow. Measuring the speed of sound in air 1 5 Sound travels as a longitudinal wave. The first attempt to meas
- Specimen, Unit 2, Q11.4 (2 marks): Read through the following information and answer the questions that follow. Measuring the speed of sound in air 1 5 Sound travels as a longitudinal wave. The first attempt to meas
- Specimen, Unit 2, Q11.5 (1 mark): Read through the following information and answer the questions that follow. Measuring the speed of sound in air 1 5 Sound travels as a longitudinal wave. The first attempt to meas
- Specimen, Unit 2, Q11.6 (2 marks): Read through the following information and answer the questions that follow. Measuring the speed of sound in air 1 5 Sound travels as a longitudinal wave. The first attempt to meas
- Specimen, Unit 2, Q11.7 (2 marks): Read through the following information and answer the questions that follow. Measuring the speed of sound in air 1 5 Sound travels as a longitudinal wave. The first attempt to meas
- Specimen, Unit 2, Q12 (1 mark): Only one answer per question is allowed. For each answer completely fill in the circle alongside the appropriate answer. If you want to change your answer you must cross out your o
- Specimen, Unit 2, Q13 (1 mark): Which of the following waves cannot be polarised? [1 mark] A microwave B radio C ultrasonic D ultraviolet 1 3 18
- Specimen, Unit 2, Q14 (1 mark): The diagram shows two pulses on a string travelling towards each other. Which of the following diagrams shows the shape of the string when the pulses have passed through each other
- Specimen, Unit 2, Q15 (1 mark): Monochromatic light of wavelength 590 nm is incident normally on a plane diffraction grating having 4 × 10⁵ lines m–1. An interference pattern is produced. What is the highest orde
- Specimen, Unit 2, Q16 (1 mark): Sound waves cross a boundary between two media X and Y. The frequency of the waves in X is 400 Hz. The speed of the waves in X is 330 m s−1 and the speed of the waves in Y is 1320
- Specimen, Unit 2, Q17 (1 mark): Which of the following is correct for a stationary wave? [1 mark] A Between two nodes the amplitude of the wave is constant. B The two waves producing the stationary wave must alwa
- Specimen, Unit 2, Q18 (1 mark): frequency of vibration = 50 Hz The diagram above shows a stationary wave on a stretched string at a time t = 0. Which one of the diagrams, A to D, correctly shows the position of t
- Specimen, Unit 5, Q03.2 (3 marks): Figure 5 shows how the refractive index n of a type of glass varies with the wavelength of light λ passing through the glass. The data for plotting the graph were determined by exp
- Specimen, Unit 5, Q03.3 (3 marks): Figure 5 shows how the refractive index n of a type of glass varies with the wavelength of light λ passing through the glass. The data for plotting the graph were determined by exp
- Specimen, Unit 5, Q03.4 (3 marks): Figure 5 shows how the refractive index n of a type of glass varies with the wavelength of light λ passing through the glass. The data for plotting the graph were determined by exp
- Specimen, Unit 5, Q03.5 (1 mark): Figure 5 shows how the refractive index n of a type of glass varies with the wavelength of light λ passing through the glass. The data for plotting the graph were determined by exp
- Specimen, Unit 5, Q03.6 (1 mark): Figure 5 shows how the refractive index n of a type of glass varies with the wavelength of light λ passing through the glass. The data for plotting the graph were determined by exp
- Specimen, Unit 5, Q07.1 (1 mark): 22 Figure 7 shows a ride in a theme park. Figure 7 The harness in which three riders are strapped is supported by four steel cables. An advertisement for the ride states that the r
Questions, mark schemes and examiner’s reports are © OxfordAQA, from their published past papers. Plumi isn’t affiliated with any exam board. Want whole papers? OxfordAQA International A Level Physics past papers.
The Plumi iPad app also offers exam-style questions with AI feedback on your handwritten working.