 plumi
Kinematics: OCR A‑Level Physics A questions
Every OCR A-Level Physics A exam question on 3.1.1 Kinematics, 2016–2025, with its mark scheme and examiner’s report.
Find questions1,877
Calculations
Q16(a)(i)
The whole paper ↗
Q16(a)(ii)
The whole paper ↗
Q1(a)
The whole paper ↗
Q1(c)
The whole paper ↗
Q3(b)
The whole paper ↗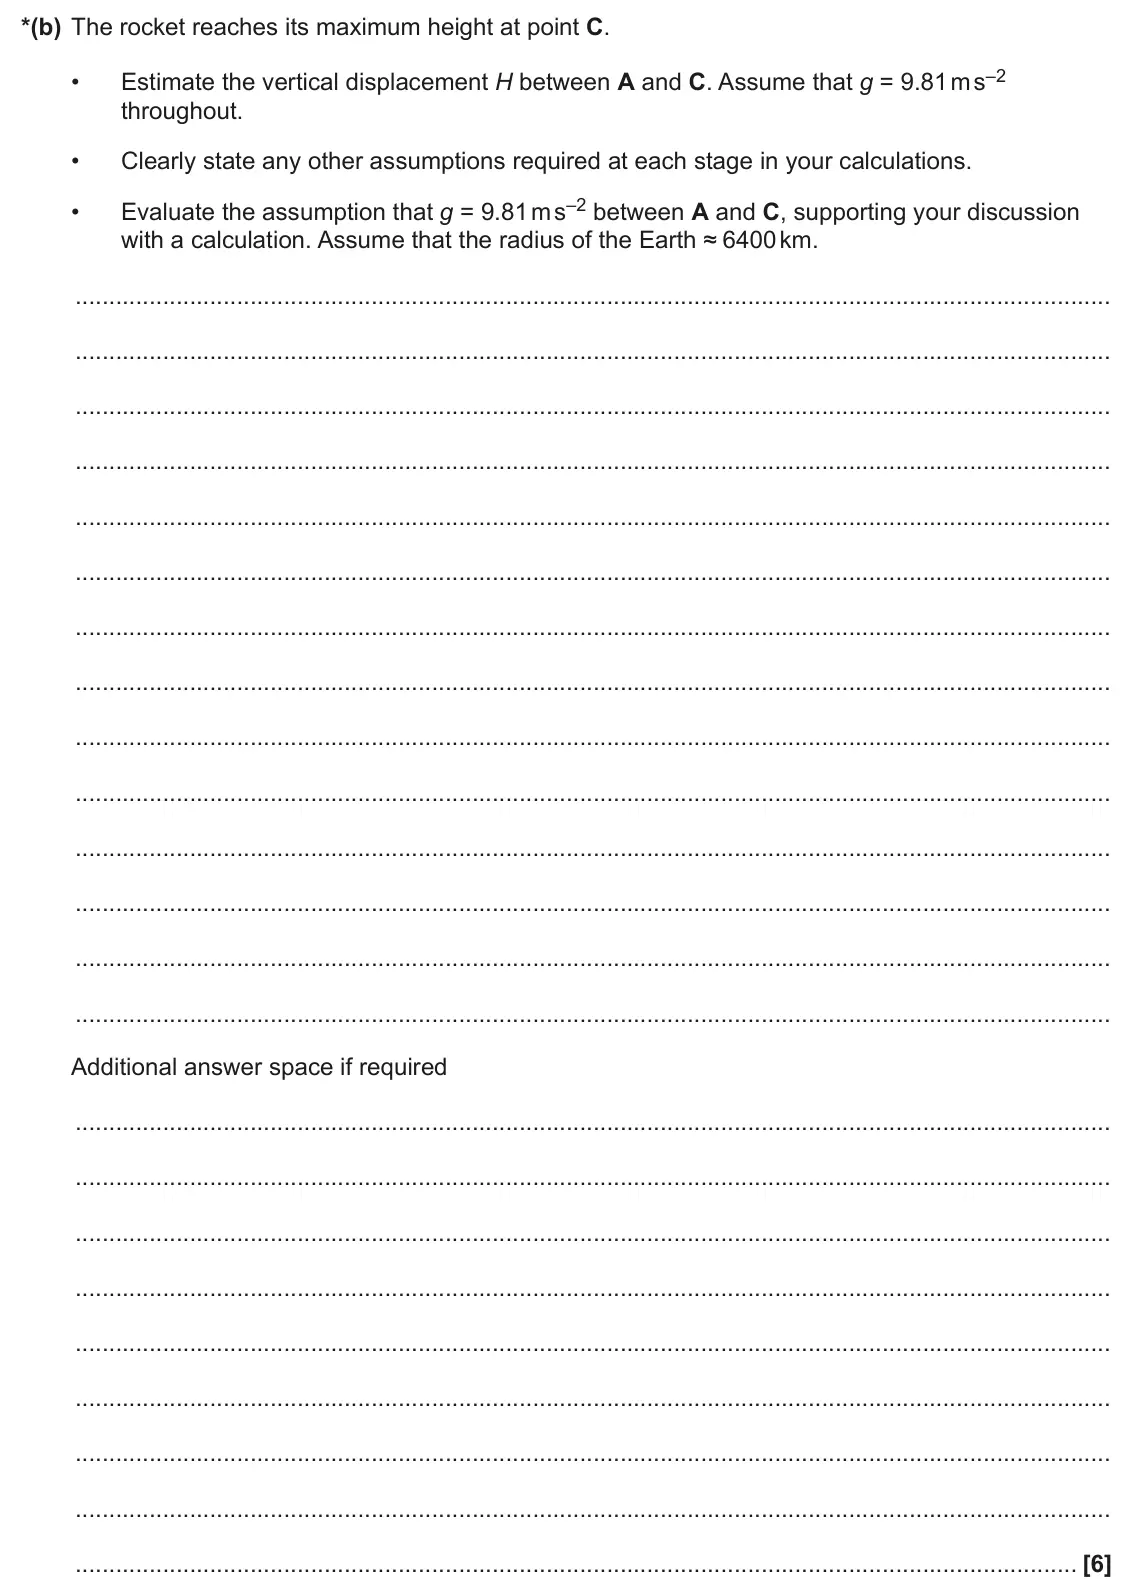
Q24(e)
The whole paper ↗
Q1(a)
The whole paper ↗
Q1(b)
The whole paper ↗
Q1(c)(i)
The whole paper ↗
Q1(c)(ii)
The whole paper ↗
Q16(a)(i)
The whole paper ↗
Q16(a)(ii)
The whole paper ↗
Q1(a)(i)
The whole paper ↗

Q21(a)
The whole paper ↗
Q21(b)(i)
The whole paper ↗
Q1(d)(ii)
The whole paper ↗

Q21(a)
The whole paper ↗
Q21(c)(i)
The whole paper ↗
All 40 questions on Kinematics, as a list
- June 2025, Paper 1, Q16(a)(i) (2 marks): Describe using Fig. 16.1, the method you would use to estimate the distance travelled in 18 s. [2]
- June 2025, Paper 1, Q16(a)(ii) (2 marks): Use the graph in Fig. 16.1 to show that the acceleration of the car at time t = 12 s is about 1.5 m s–2. [2]
- June 2025, AS Paper 2, Q1(a) (1 mark): Use the graph to determine the acceleration a of the train while the driver applies the brakes. – a = m s–2 [1]
- June 2025, AS Paper 2, Q1(c) (2 marks): Suggest why the graph does not show the real motion of the train. [2]
- June 2024, Paper 3, Q3(b) (6 marks): The rocket reaches its maximum height at point C. Estimate the vertical displacement H between A and C. Assume that g = 9.81 m s–2 • throughout. • Clearly state
- June 2024, AS Paper 1, Q24(e) (2 marks): The ball bounces when it hits the floor. On the axes below, sketch a graph of height, h, against time, t, to represent the motion of the ball from the time, t =
- June 2024, AS Paper 2, Q1(a) (2 marks): Calculate the average speed v, in m s–1, of Asteroid A. v = m s–1 [2]
- June 2024, AS Paper 2, Q1(b) (2 marks): Explain one similarity and one difference between the velocity of Asteroid A at P and its velocity six hours later. similarity difference [2]
- June 2024, AS Paper 2, Q1(c)(i) (1 mark): Show that the ratio new time to travel around Asteroid B TN original time to travel around Asteroid B T0 is approximately 0.958. [1]
- June 2024, AS Paper 2, Q1(c)(ii) (3 marks): The relationship between the distance r from the centre of Asteroid B to the centre of Asteroid A and the time T for Asteroid A to travel around Asteroid B is r
- June 2023, Paper 1, Q16(a)(i) (2 marks): Calculate the maximum speed v of vehicles on the road in S.I. units. v = Unit = [2]
- June 2023, Paper 1, Q16(a)(ii) (1 mark): A vehicle passes over one of the markings. Calculate time taken to travel the 40 m distance between the two markings. t = s [1]
- June 2023, AS Paper 2, Q1(a)(i) (1 mark): Calculate the acceleration a of the car while the brakes are applied. a = m s–2 [1]
- June 2022, Paper 1, Q3 (1 mark): A student has plotted a velocity against time graph for a trolley moving down a ramp. Which of the following pair of quantities can be determined from the gradi
- June 2022, AS Paper 1, Q21(a) (3 marks): Calculate the horizontal distance travelled by the buggy from t = 0 to t = 8.0 s. horizontal distance = m [3]
- June 2022, AS Paper 1, Q21(b)(i) (1 mark): Use the graph to show that the acceleration of the person at t = 1.0 s is 2.0 m s–2. [1]
- June 2022, AS Paper 2, Q1(d)(ii) (2 marks): Use the graph to calculate the velocity u of the steel ball at time t = 0.20 s. u = m s–1 [2]
- November 2021, Paper 1, Q1 (1 mark): An object is moving in a straight line. The displacement s against time t graph for this object is shown below. B B 3.0 C C 2.0 A A s / m 1.0 D D 0 0 1.0 2.0 3.
- November 2021, AS Paper 1, Q21(a) (1 mark): Droplets of water drip at a constant rate from a tap. The diagram below shows this dripping tap. tap water droplets Explain how you can deduce that the droplets
- November 2021, AS Paper 1, Q21(c)(i) (3 marks): Use the graph to show that the speed of the car at t = 4.0 s is 10 m s−1. [3]
- November 2020, Paper 1, Q14 (1 mark): The velocity v against time t graphs for four objects A, B, C and D are shown below. v A A B B C C D D 00 T t Which object travels the greatest distance between
- November 2020, AS Paper 2, Q5(a) (1 mark): State the gradient of the graph when t = 0. gradient = m s−1 [1]
- November 2020, AS Paper 2, Q5(b) (2 marks): Explain how you can deduce from the graph that the brakes are applied at time t = 0.75 s. [2]
- November 2020, AS Paper 2, Q5(c) (2 marks): Draw a tangent to the graph at time t = 1.75 s. Use this tangent to show that the speed of the car at t = 1.75 s is about 12 m s−1. [2]
- June 2019, Paper 1, Q5 (1 mark): A car is dripping oil at a steady rate on a straight road. The road is divided into four sections A, B, C, and D. A B C D start of oil drops on road end of jour
- June 2019, Paper 1, Q17(a) (3 marks): Draw a tangent to the curve at t = 0.25 s and determine the acceleration of the ball. acceleration = m s–2 [3]
- June 2019, Paper 1, Q20(c) (2 marks): Complete Fig. 20.2 to show the variation of the speed of the bicycle from t = 0 to t = 2.0 s. U speed 00 2.0 t / s Fig. 20.2 [2]
- June 2019, AS Paper 1, Q22(a) (4 marks): Describe and explain the variation of the velocity of the ball from t = 0.20 s to t = 0.70 s. No calculations are required. [4]
- June 2019, AS Paper 1, Q22(c) (3 marks): Draw a suitable tangent to the curve in Fig. 22 and show that the rebound speed of the ball is about 3.5 m s–1. [3]
- June 2019, AS Paper 2, Q1(a)(i) (1 mark): the acceleration of the falling ball is about 10 m s–2 [1]
- June 2019, AS Paper 2, Q1(b)(ii) (2 marks): Complete Fig. 1 to show the variation of the velocity of the ball after it leaves the surface until it is at rest again. [2]
- June 2019, AS Paper 2, Q1(b)(iii) (2 marks): Determine the maximum height h reached by the ball after it bounces. h = m [2]
- June 2018, Paper 1, Q20(b)(i) (3 marks): On Fig. 20.3, sketch a graph to show the variation of the velocity v of the load with time t. You do not need to insert a scale on the v axis. [3]
- June 2018, Paper 3, Q4(d) (4 marks): It is suspected that the card on the trolley did not pass at right angles through the light beam. Discuss, without doing any calculations, the effect this may h
- June 2018, AS Paper 1, Q1 (1 mark): The graph below shows the variation of displacement s with time t for an object. C s D B A 0 t 0 At which point, A, B, C or D, does the object have maximum velo
- June 2018, AS Paper 2, Q1(a) (2 marks): Explain what feature of the graph shows the deceleration of the car and that the deceleration is constant after 1.5 s. [2]
- June 2018, AS Paper 2, Q1(b) (3 marks): The driver of the car applies the brakes at a distance of 20 m from the ‘stop line’ at the junction. Calculate the distance s of the car relative to the stop li
- June 2017, Paper 1, Q16(b) (2 marks): Calculate the ratio speed of handle moving down . speed of car moving up ratio = [2]
- June 2017, AS Paper 1, Q21(b) (4 marks): Use Fig. 21 to describe and explain the variation of the velocity of the trolley from t = 0 to t = 1.0 s. [4]
- June 2016, AS Paper 1, Q14 (1 mark): A golf ball is dropped from rest onto a hard floor. The graph shows how the velocity of the ball varies with time as it bounces, from the time of release. At wh
Questions, mark schemes and examiner’s reports are © OCR, from their published past papers. Plumi isn’t affiliated with any exam board. Want whole papers? Every OCR A-Level Physics A paper, or our free OCR-style practice pack.
Rather write your answers by hand on iPad? Plumi marks them against the same mark schemes.