 plumi
Estimation, confidence intervals and tests: OCR A‑Level Further Maths questions
Every OCR A-Level Further Maths exam question on FS.7 Estimation, confidence intervals and tests, 2018–2025, with its mark scheme and examiner’s report.
Find questions648



All 10 questions on Estimation, confidence intervals and tests, as a list
- June 2025, Statistics, Q3 (9 marks): The length, in cm, of sand lizards when fully grown is a random variable which is known to have the distribution N(13.2, .3 42). Some scientists discover a colo
- June 2024, Statistics, Q3 (11 marks): Research suggests that the mean reading age of a child about to start secondary school is 10.75. The reading ages, X years, of a random sample of 80 children wh
- June 2023, Statistics, Q5 (10 marks): An historian has reason to believe that the average age at which men got married in the seventeenth century was higher in urban areas compared to rural areas. T
- June 2023, Statistics, Q7 (10 marks): A club secretary collects data about the time, T minutes, needed to process the details of a new 2 member. The mean of T is denoted by n. The variance of T is d
- June 2022, Statistics, Q6 (7 marks): The random variable X was assumed to have a normal distribution with mean n. Using a random sample of size 128, a significance test was carried out using the fo
- November 2021, Statistics, Q4 (9 marks): A random sample of 160 observations of a random variable X is selected. The sample can be summarised as follows. x2 = n = 160 x = 2688 48 398 / / (a) Calculate
- November 2020, Statistics, Q1 (4 marks): The continuous random variable X has the distribution N(n, 30). The mean of a random sample of 8 observations of X is 53.1. Determine a 95% confidence interval
- November 2020, Statistics, Q3 (9 marks): Jo can use either of two different routes, A or B, for her journey to school. She believes that route A has shorter journey times. She measures how long her jou
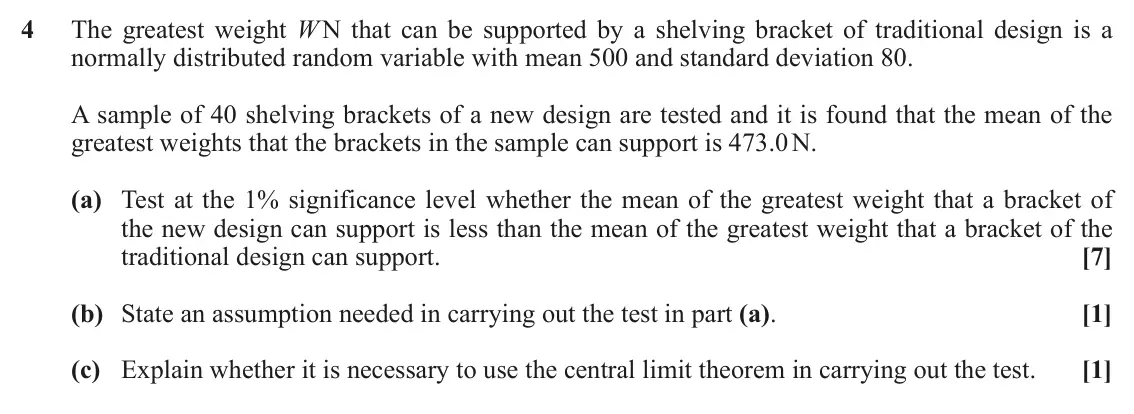
- June 2019, Statistics, Q4 (9 marks): The greatest weight W N that can be supported by a shelving bracket of traditional design is a normally distributed random variable with mean 500 and standard d
- June 2019, Statistics, Q8 (10 marks): A university course was taught by two different professors. Students could choose whether to attend the lectures given by Professor Q or the lectures given by P
Questions, mark schemes and examiner’s reports are © OCR, from their published past papers. Plumi isn’t affiliated with any exam board. Want whole papers? Every OCR A-Level Further Maths paper.
Rather write your answers by hand on iPad? Plumi marks them against the same mark schemes.