 plumi
Reaction rates: OCR A‑Level Chemistry A questions
Every OCR A-Level Chemistry A exam question on 3.2.2 Reaction rates, 2016–2025, with its mark scheme and examiner’s report.
Find questions1,820
Calculations

Q18(a)(i)
The whole paper ↗
Q18(a)(ii)
The whole paper ↗
Q18(a)(iii)
The whole paper ↗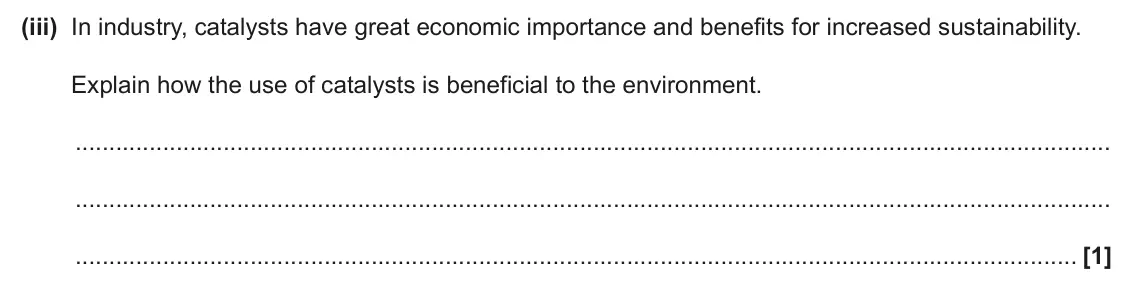


Q21(d)(ii)
The whole paper ↗

Q16(b)(i)
The whole paper ↗
Q16(b)(ii)
The whole paper ↗
Q17(a)
The whole paper ↗

Q4(a)
The whole paper ↗
Q4(b)(i)
The whole paper ↗
Q4(b)(ii)
The whole paper ↗
Q4(c)
The whole paper ↗


Q23(a)(iii)
The whole paper ↗
Q16(a)(i)
The whole paper ↗
All 57 questions on Reaction rates, as a list
- June 2025, Paper 1, Q5 (1 mark): The graph shows the volume of hydrogen released over time in a chemical reaction. 100 90 80 70 60 Volume of hydrogen 50 / cm3 40 30 20 10 0 0 20 40 60 80 100 Ti
- June 2025, Paper 1, Q18(a)(i) (1 mark): Explain why platinum is an example of a heterogeneous catalyst for Reaction 18.1. [1]
- June 2025, Paper 1, Q18(a)(ii) (2 marks): Explain how the platinum catalyst increases the rate of reaction. Include a labelled sketch of the Boltzmann distribution on the grid. Number of molecules 0 0 E
- June 2025, Paper 1, Q18(a)(iii) (1 mark): In industry, catalysts have great economic importance and benefits for increased sustainability. Explain how the use of catalysts is beneficial to the environme
- June 2025, AS Paper 1, Q12 (1 mark): Hydrogen and iodine react in the reaction below. H2(g) + I2(g) 2HI(g) Which row is correct when pressure is increased? Rate of reaction Equilibrium yield of HI
- June 2025, AS Paper 1, Q13 (1 mark): Which statement is not a sustainability benefit of an industrial process using a catalyst? A Lower temperatures can be used. B The position of equilibrium moves
- June 2025, AS Paper 1, Q21(d)(ii) (3 marks): Explain the shape of the graph in Fig. 21.1, in terms of concentration, collisions and time. [3]
- June 2024, Paper 1, Q8 (1 mark): Which row in the table explains how a catalyst affects the activation energy (Ea) and the proportion of molecules with energy > Ea? How the activation Proportio
- June 2024, Paper 1, Q16(b)(i) (3 marks): Complete the enthalpy profile diagram for Reaction 16.1 using formulae for the reactants and products. • Use Ea to label the activation energy without MnO2. • U
- June 2024, Paper 1, Q16(b)(ii) (1 mark): Explain why MnO2 is described as a heterogeneous catalyst for this reaction. [1]
- June 2024, Paper 1, Q17(a) (1 mark): Using collision theory, explain why the gradient decreases over time. [1]
- June 2024, AS Paper 1, Q12 (1 mark): A mixture of gases is heated in a closed container. The reaction rate increases. Which statement explains why the rate increases? A More molecules have an energ
- June 2024, AS Paper 2, Q4(a) (4 marks): Explain, using a Boltzmann distribution model, why the rate of a reaction increases in the presence of a catalyst. You are provided with the axes below, which y
- June 2024, AS Paper 2, Q4(b)(i) (2 marks): On graph 4.1, draw a best-fit smooth curve of the results and circle the anomalous result. [2]
- June 2024, AS Paper 2, Q4(b)(ii) (2 marks): Use your graph to determine the rate of reaction, in cm3 s–1, at 50 s. Show your working below and on the graph. rate = cm3 s–1 [2]
- June 2024, AS Paper 2, Q4(c) (2 marks): A student plans to compare the rate of decomposition of H2O2 using different metal oxides as the catalyst. Suggest two variables which should be kept constant.
- June 2023, AS Paper 1, Q13 (1 mark): The Boltzmann distribution showing the activation energy, Ea, for an uncatalysed reaction is shown below. number of molecules Ea energy What is the difference f
- June 2023, AS Paper 1, Q14 (1 mark): A student measures how the OH– concentration changes over time for a reaction. The student plots the graph below. 0.20 0.15 [OH–(aq)] 0.10 / mol dm–3 0.05 0.00
- June 2023, AS Paper 1, Q23(a)(iii) (2 marks): CO and NO are removed by use of a catalyst. Explain the role of the catalyst. Refer to your enthalpy profile diagram in Fig. 23.1 in your answer. [2]
- June 2022, Paper 1, Q16(a)(i) (3 marks): Explain how increasing the temperature increases the rate of Reaction 16.1. Include a labelled sketch, using Boltzmann distributions, on the grid below. Label t
- June 2022, Paper 3, Q4(a) (4 marks): The students are supplied with the equilibrium mixture in Equilibrium 4.1 at room temperature. One student heats 20 cm3 of the mixture to 50 °C. • The other stu
- June 2022, AS Paper 1, Q25(b) (3 marks): The Boltzmann distribution model can be used by chemists to explain how the rate of a reaction is affected by temperature. Fig. 25.1 shows the Boltzmann distrib
- June 2022, AS Paper 2, Q3(a)(i) (3 marks): The graph shows that the reaction gets slower over time, and eventually stops. Explain why, in terms of collision theory. [3]
- June 2022, AS Paper 2, Q3(a)(ii) (2 marks): Using the graph in Fig. 3.1, find the rate of reaction, in g s–1, at 50 seconds. Show your working on the graph and in the space below. rate of reaction = g s–1
- June 2022, AS Paper 2, Q3(a)(iii) (2 marks): The student repeats the experiment but heats 50 cm3 of dilute hydrochloric acid up to 40 °C before adding the ZnCO3(s). On Fig. 3.1, sketch the curve the studen
- June 2022, AS Paper 2, Q3(b)(i) (2 marks): Describe two differences the student would observe between the test tubes. 1 2 [2]
- June 2022, AS Paper 2, Q3(b)(ii) (3 marks): Using the axes below, sketch an enthalpy profile diagram for the reaction with and without the catalyst. On your diagram, include the following labels: • ΔH, th
- November 2021, AS Paper 1, Q11 (1 mark): The Boltzmann distributions below show a gas at two different temperatures. Which Boltzmann distribution shows the dotted curve at a higher temperature? number
- November 2021, AS Paper 1, Q22(a) (3 marks): The rate of this reaction increases when a catalyst is present. Complete the enthalpy profile diagram below. On your diagram: • label the activation energies, E
- November 2021, AS Paper 2, Q5(c) (2 marks): The industrial manufacture of methanol has used a copper-based catalyst. Chemists have recently developed a new method for making methanol that uses a nickel- g
- November 2021, AS Paper 2, Q6(a) (3 marks): Draw a best fit curve on Fig. 6.1. Use the graph to determine the rate of reaction, in cm3 s–1, at 50 s. Show your working below and on the graph. rate at 50 s
- November 2021, AS Paper 2, Q6(b) (2 marks): A second student suggests that the experiment could be improved by measuring the loss in mass in the conical flask over time. The student places a conical flask
- November 2020, Paper 1, Q7 (1 mark): The diagram represents a Boltzmann distribution curve of molecules at a given temperature. number of molecules energy Which statement for this Boltzmann distrib
- November 2020, Paper 1, Q17(b) (2 marks): A catalyst is used in the production of methanol in equilibrium 1. State two ways that the use of catalysts helps chemical companies to make their processes mor
- November 2020, AS Paper 1, Q24(b) (5 marks): The industrial manufacture of NH3 from N2 and H2 is carried out at an increased temperature and in the presence of a catalyst. Explain, using Boltzmann distribu
- June 2019, Paper 1, Q19(c)(i) (4 marks): Explain how the presence of V2O5(s) increases the rate of reaction. Include a labelled sketch of the Boltzmann distribution, on the grid below. Label the axes.
- June 2019, Paper 1, Q19(c)(ii) (1 mark): Explain whether vanadium(V) oxide is acting as a homogeneous or heterogeneous catalyst. [1]
- June 2019, AS Paper 1, Q12 (1 mark): What is the main reason for the increase in reaction rate with increasing temperature? A The activation energy decreases. B The activation energy increases. C M
- June 2019, AS Paper 2, Q4(b)(i) (1 mark): On the graph paper in Fig. 4.1, label the x axis and plot the results in Table 4.1. [1]
- June 2019, AS Paper 2, Q4(b)(ii) (1 mark): Circle any anomalous results present in the graph you have drawn in Fig. 4.1. [1]
- June 2019, AS Paper 2, Q4(b)(iii) (1 mark): Draw a best-fit smooth curve on the graph you have drawn in Fig. 4.1. [1] 11 80 70 60 50 volume 40 / cm3 30 20 10 0 Fig. 4.1
- June 2019, AS Paper 2, Q4(c) (2 marks): The student repeats the experiment using: • zinc with the same mass (0.200 g) and same surface area • the same temperature and pressure 40.0 cm3 of 0.125 mol dm
- June 2019, AS Paper 2, Q4(d) (2 marks): The graph shows that rate of reaction decreases over time. Explain why, in terms of collision theory. [2]
- June 2019, AS Paper 2, Q4(e)(i) (2 marks): The rate of the reaction between zinc and hydrochloric acid can be increased using a solution of copper(II) sulfate as a catalyst. Explain how a catalyst increa
- June 2019, AS Paper 2, Q4(e)(ii) (1 mark): Why is it difficult to classify the solution of copper(II) sulfate as a homogeneous or heterogeneous catalyst in this reaction? [1]
- June 2018, Paper 1, Q14 (1 mark): Which statement(s) explain(s) why reaction rates increase as temperature increases? 1 The activation energy is less. 2 Collisions between molecules are more fre
- June 2018, Paper 1, Q20(b) (3 marks): Hydrogen iodide, HI, is decomposed by heat into its elements: 2HI(g) H2(g) + I2(g) ∆H = +9.5 kJ mol–1 The decomposition is much faster in the presence of a plat
- June 2018, Paper 3, Q2(a)(i) (5 marks): Process the results as outlined below. • On page 5, plot a graph of volume of O2 against time. • Use your graph to find the rate of the reaction, in cm3 s–1, at
- June 2018, AS Paper 1, Q23(b) (4 marks): Using the Boltzmann distribution model, explain how the rate of a reaction is affected by temperature. You are provided with the axes below, which should be lab
- June 2018, AS Paper 2, Q5(b) (2 marks): A student investigates the rate of reaction of 1-bromobutane with aqueous hydroxide ions. The graph shows how the hydroxide ion concentration, [OH–(aq)], change
- June 2017, AS Paper 1, Q23(a) (4 marks): Using the Boltzmann distribution model, explain why the rate of a reaction increases in the presence of a catalyst. You are provided with the axes below, which
- June 2017, AS Paper 1, Q23(b) (2 marks): The reaction for the production of methanol in the presence of the copper catalyst is carried out at 200–300 °C. Explain why use of the catalyst reduces energy
- June 2017, AS Paper 2, Q2 (6 marks): 2* A student was asked to carry out an experiment to determine the initial rate of reaction of zinc and hydrochloric acid. The student plans to collect a total
- June 2016, AS Paper 2, Q5(a)(i) (1 mark): Explain why there is a loss in mass during the reaction. [1]
- June 2016, AS Paper 2, Q5(b)(i) (2 marks): Describe and explain the change in the rate of the reaction during the first 200 seconds of the experiment. [2]
- June 2016, AS Paper 2, Q5(b)(ii) (2 marks): Using the graph, calculate the rate of reaction, in g s–1, at 200 seconds. Show your working on the graph. rate of reaction = g s–1 [2]
- June 2016, AS Paper 2, Q5(c) (3 marks): Outline a method that could be used to obtain the results that are plotted on the graph. Your answer should include the apparatus required and the procedure for
Questions, mark schemes and examiner’s reports are © OCR, from their published past papers. Plumi isn’t affiliated with any exam board. Want whole papers? Every OCR A-Level Chemistry A paper, or our free OCR-style practice pack.
Rather write your answers by hand on iPad? Plumi marks them against the same mark schemes.