 plumi
Collision theory and rate from graphs: OCR A‑Level Chemistry A questions
OCR A-Level Chemistry A past-paper questions on 3.2.2.1 Collision theory and rate from graphs, 2016–2025, with mark schemes and examiner’s reports where available.
Paper
All papers
Exam
All years
Calculations
- Your answer
- Your answer
Q21(d)(ii)
The whole paper ↗
Q17(a)
The whole paper ↗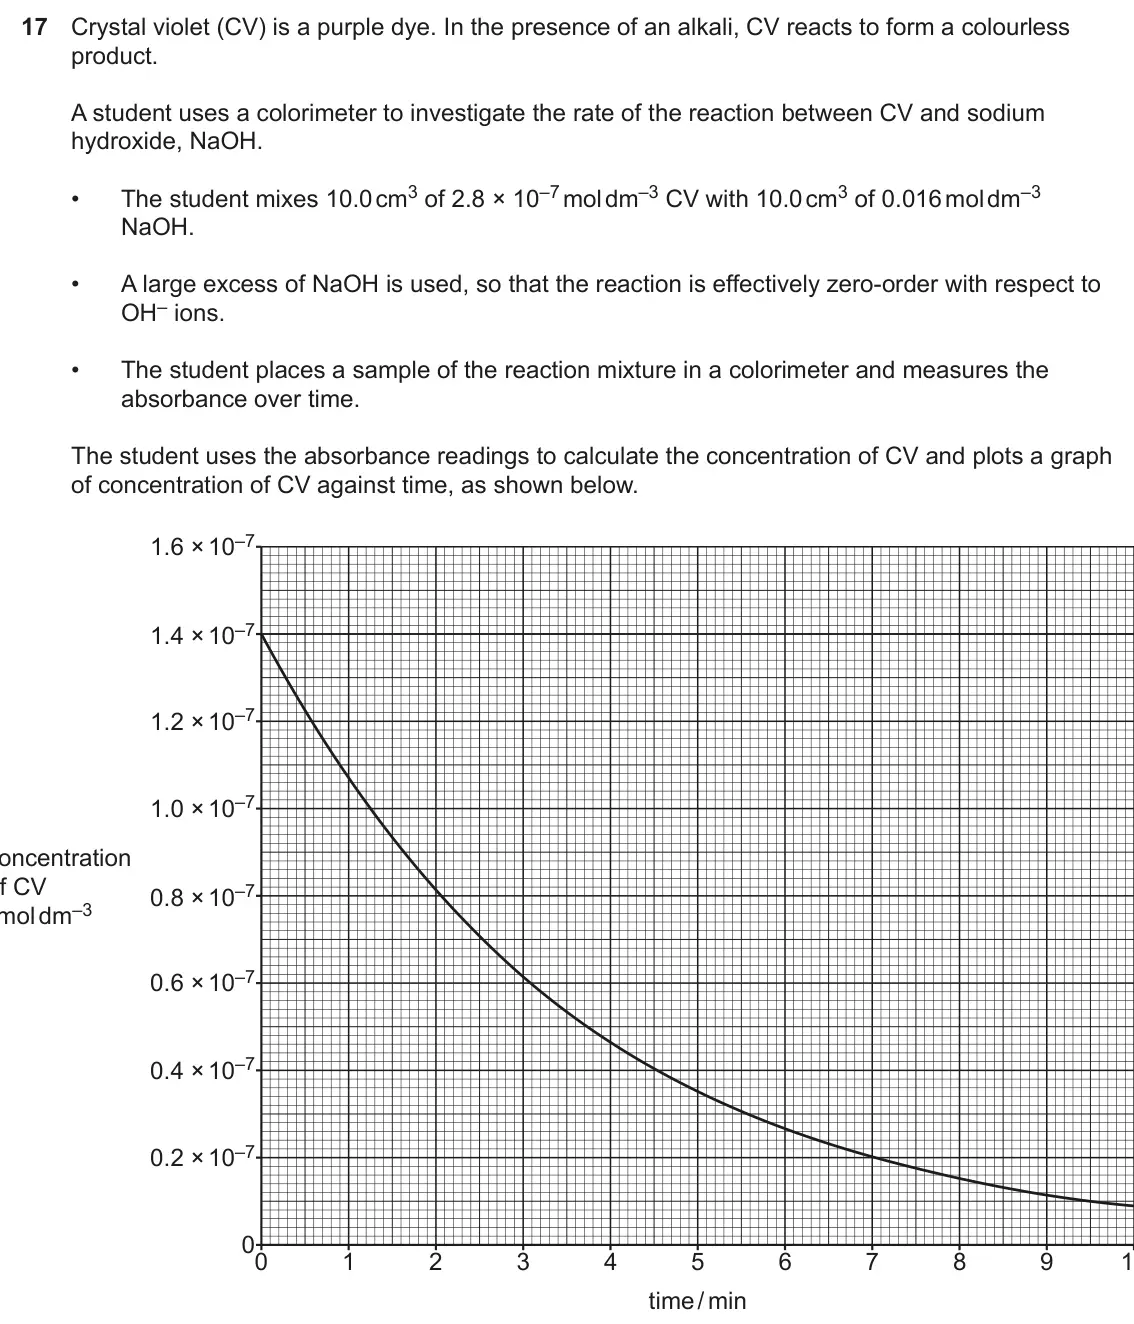
Q4(b)(i)
The whole paper ↗
Q4(b)(ii)
The whole paper ↗- Your answer
Q3(a)(i)
The whole paper ↗
Q3(a)(ii)
The whole paper ↗Q3(a)(iii)
The whole paper ↗Q6(a)
The whole paper ↗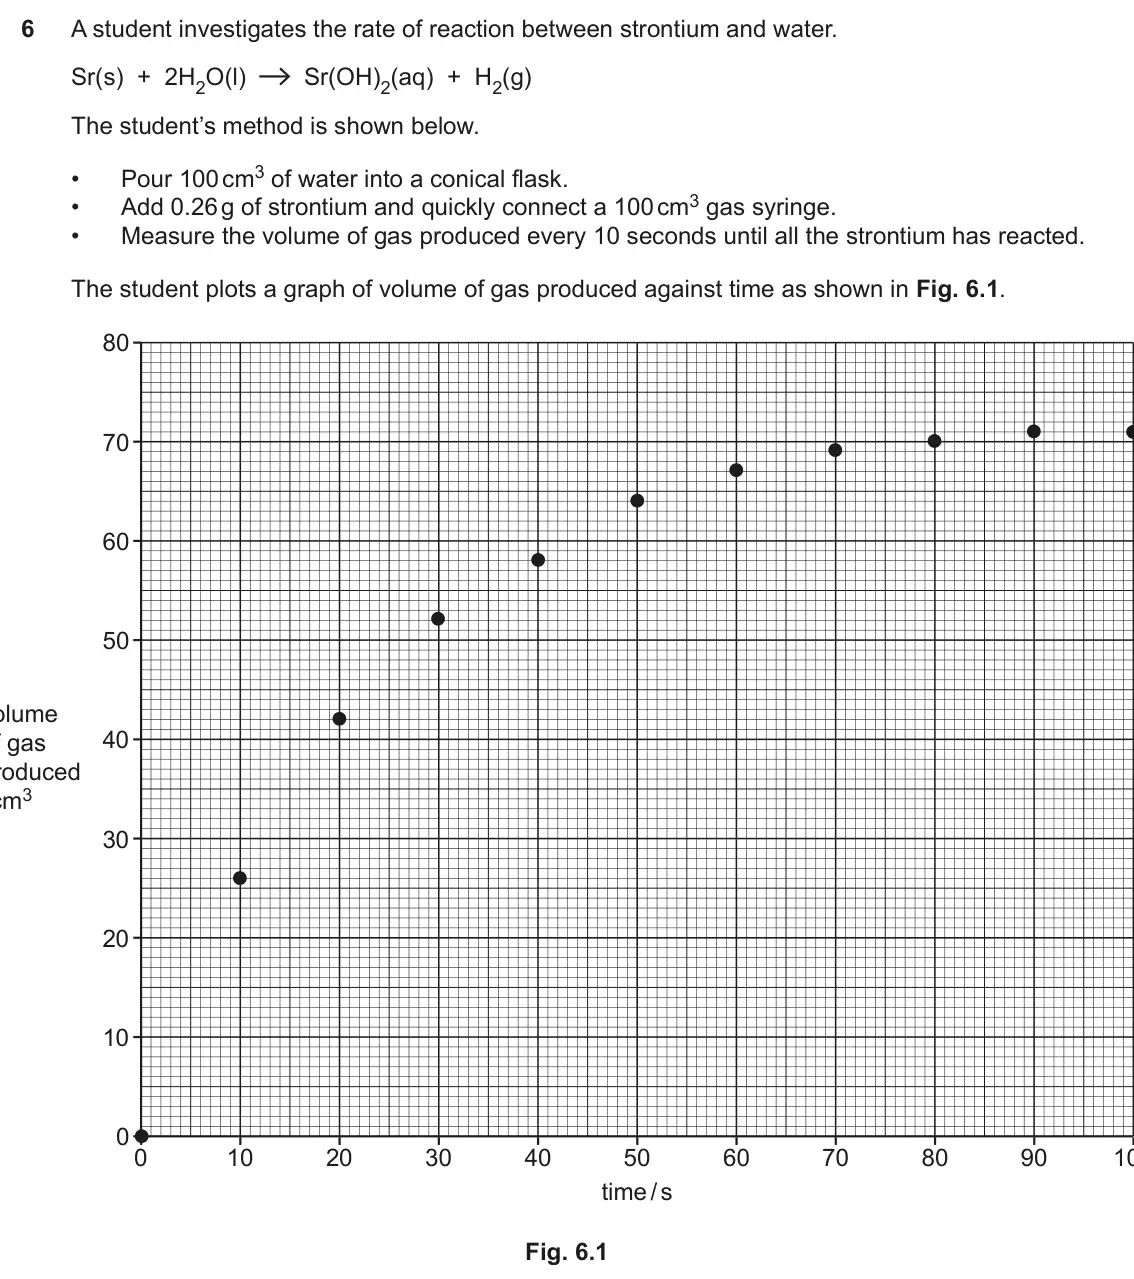
Q4(c)
The whole paper ↗
Q4(d)
The whole paper ↗- Your answer
Q2(a)(i)
The whole paper ↗
Q5(b)
The whole paper ↗Q5(b)(i)
The whole paper ↗
Q5(b)(ii)
The whole paper ↗
All 18 questions on Collision theory and rate from graphs, as a list
- June 2025, Paper 1, Q5 (1 mark): The graph shows the volume of hydrogen released over time in a chemical reaction. 100 90 80 70 60 Volume of hydrogen 50 / cm3 40 30 20 10 0 0 20 40 60 80 100 Ti
- June 2025, AS Paper 1, Q12 (1 mark): Hydrogen and iodine react in the reaction below. H2(g) + I2(g) 2HI(g) Which row is correct when pressure is increased? Rate of reaction Equilibrium yield of HI
- June 2025, AS Paper 1, Q21(d)(ii) (3 marks): Explain the shape of the graph in Fig. 21.1, in terms of concentration, collisions and time. [3]
- June 2024, Paper 1, Q17(a) (1 mark): Using collision theory, explain why the gradient decreases over time. [1]
- June 2024, AS Paper 2, Q4(b)(i) (2 marks): On graph 4.1, draw a best-fit smooth curve of the results and circle the anomalous result. [2]
- June 2024, AS Paper 2, Q4(b)(ii) (2 marks): Use your graph to determine the rate of reaction, in cm3 s–1, at 50 s. Show your working below and on the graph. rate = cm3 s–1 [2]
- June 2023, AS Paper 1, Q14 (1 mark): A student measures how the OH– concentration changes over time for a reaction. The student plots the graph below. 0.20 0.15 [OH–(aq)] 0.10 / mol dm–3 0.05 0.00
- June 2022, AS Paper 2, Q3(a)(i) (3 marks): The graph shows that the reaction gets slower over time, and eventually stops. Explain why, in terms of collision theory. [3]
- June 2022, AS Paper 2, Q3(a)(ii) (2 marks): Using the graph in Fig. 3.1, find the rate of reaction, in g s–1, at 50 seconds. Show your working on the graph and in the space below. rate of reaction = g s–1
- June 2022, AS Paper 2, Q3(a)(iii) (2 marks): The student repeats the experiment but heats 50 cm3 of dilute hydrochloric acid up to 40 °C before adding the ZnCO3(s). On Fig. 3.1, sketch the curve the studen
- November 2021, AS Paper 2, Q6(a) (3 marks): Draw a best fit curve on Fig. 6.1. Use the graph to determine the rate of reaction, in cm3 s–1, at 50 s. Show your working below and on the graph. rate at 50 s
- June 2019, AS Paper 2, Q4(c) (2 marks): The student repeats the experiment using: • zinc with the same mass (0.200 g) and same surface area • the same temperature and pressure 40.0 cm3 of 0.125 mol dm
- June 2019, AS Paper 2, Q4(d) (2 marks): The graph shows that rate of reaction decreases over time. Explain why, in terms of collision theory. [2]
- June 2018, Paper 1, Q14 (1 mark): Which statement(s) explain(s) why reaction rates increase as temperature increases? 1 The activation energy is less. 2 Collisions between molecules are more fre
- June 2018, Paper 3, Q2(a)(i) (5 marks): Process the results as outlined below. • On page 5, plot a graph of volume of O2 against time. • Use your graph to find the rate of the reaction, in cm3 s–1, at
- June 2018, AS Paper 2, Q5(b) (2 marks): A student investigates the rate of reaction of 1-bromobutane with aqueous hydroxide ions. The graph shows how the hydroxide ion concentration, [OH–(aq)], change
- June 2016, AS Paper 2, Q5(b)(i) (2 marks): Describe and explain the change in the rate of the reaction during the first 200 seconds of the experiment. [2]
- June 2016, AS Paper 2, Q5(b)(ii) (2 marks): Using the graph, calculate the rate of reaction, in g s–1, at 200 seconds. Show your working on the graph. rate of reaction = g s–1 [2]
Questions, mark schemes and examiner’s reports are © OCR, from their published past papers. Plumi isn’t affiliated with any exam board. Want whole papers? OCR A-Level Chemistry A past papers, or our free OCR-style practice pack.
The Plumi iPad app also offers exam-style questions with AI feedback on your handwritten working.