 plumi
Factors affecting enzyme activity: OCR A‑Level Biology A questions
OCR A-Level Biology A past-paper questions on 2.1.4.3 Factors affecting enzyme activity, 2016–2025, with mark schemes and examiner’s reports where available.
Paper
All papers
Exam
All years
Calculations
Q3(b)(i)
The whole paper ↗Q3(b)(ii)
The whole paper ↗Q3(c)
The whole paper ↗Q3(d)
The whole paper ↗Q21(b)(ii)
The whole paper ↗Q25(a)
The whole paper ↗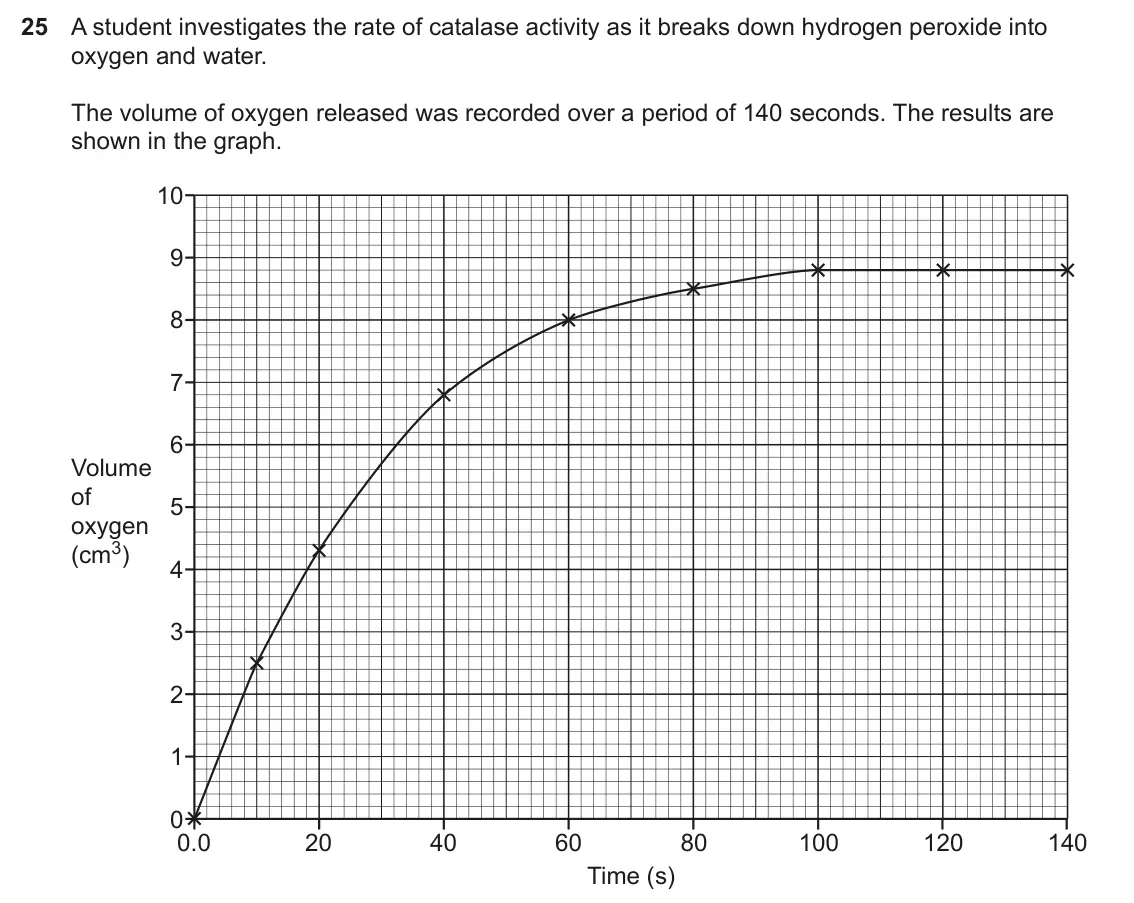
- Your answer
Q17(a)(i)
The whole paper ↗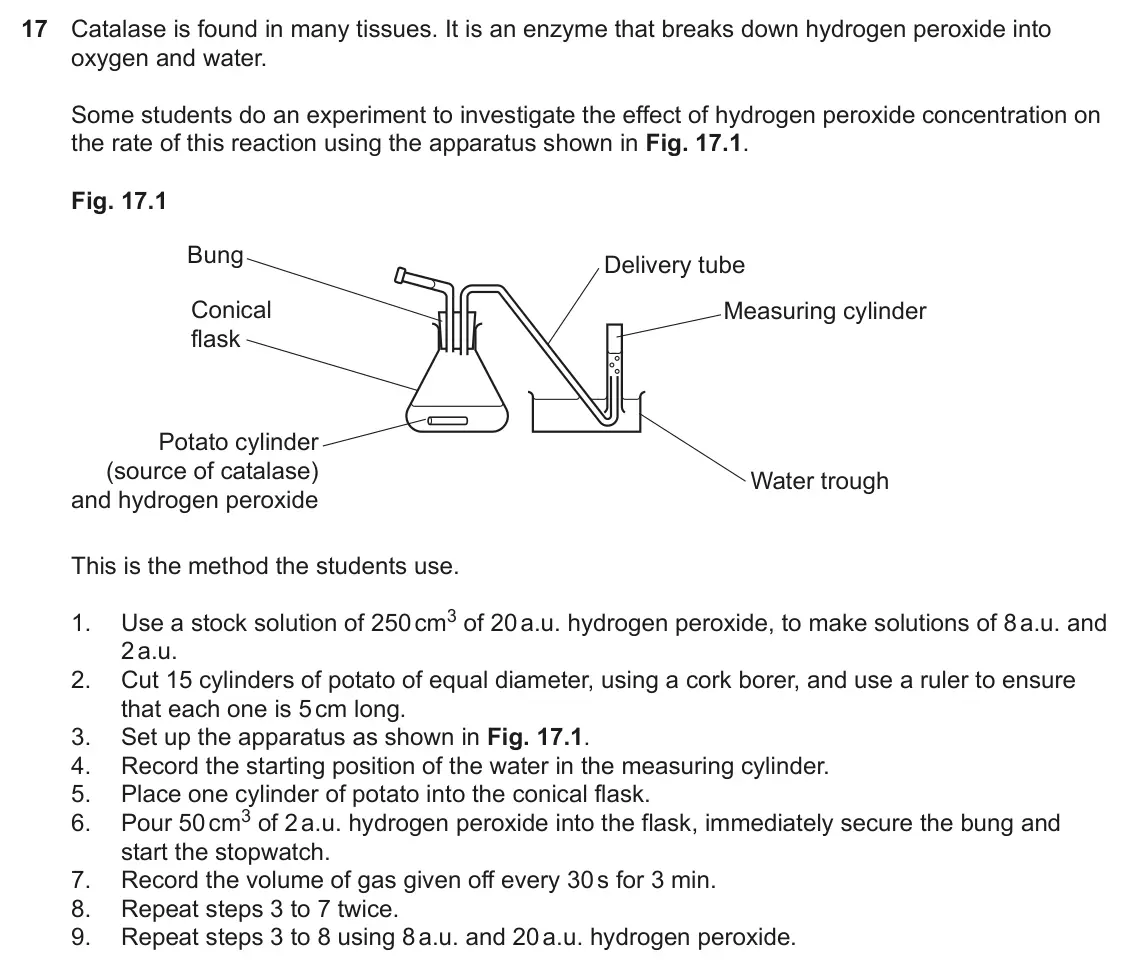
Q17(a)(ii)
The whole paper ↗Q17(a)(iii)
The whole paper ↗Q17(a)(iv)
The whole paper ↗Q17(b)(i)
The whole paper ↗Q17(b)(ii)
The whole paper ↗Q17(b)(iii)
The whole paper ↗Q17(b)(iv)
The whole paper ↗Q17(c)
The whole paper ↗- Your answer
Q22(b)(i)
The whole paper ↗
Q22(b)(ii)
The whole paper ↗
All 57 questions on Factors affecting enzyme activity, as a list
- June 2025, AS Paper 2, Q3(b)(i) (3 marks): Use the graph to calculate the initial rate of the reaction. Give your answer to 2 significant figures. Initial rate of the reaction = cm3 s–1 [3]
- June 2025, AS Paper 2, Q3(b)(ii) (1 mark): The student repeats this experiment at 30 °C and finds the initial rate of reaction to be 4.34 cm3 s–1. Calculate the Q10 for catalase. Give your answer to 2 si
- June 2025, AS Paper 2, Q3(c) (2 marks): The student completes a different experiment to investigate the effect of pH on enzyme action. Suggest how they would vary and detect the pH in their experiment
- June 2025, AS Paper 2, Q3(d) (4 marks): Explain how increasing the substrate concentration affects the enzyme activity. [4]
- June 2024, Paper 1, Q21(b)(ii) (3 marks): Fig. 21.1 is a graph of decomposition of hydrogen peroxide against time for catalase. Fig. 21.1 250 200 Hydrogen peroxide 150 decomposed (μg) 100 50 0 0 10 20 3
- June 2024, AS Paper 1, Q25(a) (2 marks): Use the graph to calculate the rate of reaction at 50 seconds. Give your answer to 2 significant figures. Rate = cm3 s–1 [2]
- June 2023, Paper 1, Q5 (1 mark): Increasing the pH of an enzyme solution from 7.4 to 8.0 causes the rate of the reaction to fall by 90%. When the pH of the solution returns to 7.4 the rate of r
- June 2023, Paper 2, Q17(a)(i) (1 mark): State the independent variable in this investigation. [1]
- June 2023, Paper 2, Q17(a)(ii) (2 marks): Describe how a student could produce an 8 a.u. solution from a 20 a.u. stock solution. [2]
- June 2023, Paper 2, Q17(a)(iii) (2 marks): Liver tissue contains a higher concentration of catalase than potato. Suggest two reasons why the students chose potato rather than liver as a source of catalas
- June 2023, Paper 2, Q17(a)(iv) (1 mark): The potato cylinders were cut to equal lengths. Suggest a further precaution the students should have taken when preparing them, to ensure the investigation was
- June 2023, Paper 2, Q17(b)(i) (2 marks): Some of the students’ results are shown in the tables below. Results for 2 a.u. hydrogen peroxide Volume of oxygen produced (cm3) Time Standard (s) 1 2 3 Mean d
- June 2023, Paper 2, Q17(b)(ii) (2 marks): Use the standard deviations to discuss the repeatability of the students’ results. [2]
- June 2023, Paper 2, Q17(b)(iii) (2 marks): The students calculated the initial rate of reaction over the first 30 s. Calculate the rate of reaction over the first 30 s for the result at 2 a.u. hydrogen p
- June 2023, Paper 2, Q17(b)(iv) (2 marks): When analysing the results, the students assumed that the volume of oxygen collected was the same as the volume of oxygen produced from breakdown of hydrogen pe
- June 2023, Paper 2, Q17(c) (3 marks): Fig. 17.2 shows a graph of the students’ results. Fig. 17.2 100 Key: 2 a.u. 8 a.u. 80 20 a.u. 60 Volume of oxygen produced 40 (cm3) 20 0 0 30 60 90 120 150 180
- June 2023, AS Paper 1, Q17 (1 mark): Which row in the table shows the different types of variables in the student’s investigation? Control variable Dependent variable Independent variable Volume of
- June 2023, AS Paper 1, Q18 (1 mark): The student determines catalase activity by calculating the rate of oxygen production. Which units of measurement are appropriate to show the rate of oxygen pro
- June 2023, AS Paper 1, Q22(b)(i) (2 marks): The student uses a volumetric flask to measure 250 cm3 of the solution. The volumetric flask has an absolute uncertainty of ±0.12 cm3. Calculate the percentage
- June 2023, AS Paper 1, Q22(b)(ii) (2 marks): Using a pipette, the student transfers several 5 cm3 samples of the plant extract solution during their investigation. The diagram shows three different pipette
- June 2022, Paper 1, Q4 (1 mark): The graph below shows the effect of changing substrate concentration on the rate of an enzyme- controlled reaction. Rate of reaction Substrate concentration Whi
- June 2022, Paper 1, Q5 (1 mark): Which statement about the effect of temperature on enzyme-controlled reactions is not correct? A At temperatures above 40 °C the rate of all enzyme-controlled r
- June 2022, AS Paper 1, Q7 (1 mark): A student carried out an investigation to see the effect of changing the concentration of the enzyme maltase. They used two different maltase concentrations (co
- June 2022, AS Paper 1, Q11 (1 mark): The temperature coefficient (Q10) for catalase is recorded in a data book as 1.15. A student carries out an experiment to test if this Q10 value is correct and
- November 2021, Paper 1, Q4 (1 mark): Which of the statements about enzyme catalysed reactions is true? A Binding of a substrate to the active site can weaken bonds in the substrate. B Enzymes allow
- November 2021, AS Paper 2, Q3(a)(i) (2 marks): Describe how they would create four different enzyme concentrations using tenfold serial dilutions. They started by using a syringe to transfer 1 cm3 of the 1%
- November 2021, AS Paper 2, Q3(a)(ii) (1 mark): State the concentration of trypsin in tube 4 once the tenfold serial dilutions had been completed. Concentration = % [1]
- November 2021, AS Paper 2, Q3(c) (2 marks): Fig. 3.1 shows how the rate of reaction of trypsin changes with pH. Rate of enzyme reaction 1 2 3 4 5 6 7 8 9 10 11 12 13 14 pH Fig. 3.1 With reference to Fig.
- November 2021, AS Paper 2, Q3(d)(i) (2 marks): Other factors may affect the rate of the reaction. Name one other factor they would need to control and describe how they would control this. Factor How they wo
- November 2021, AS Paper 2, Q3(d)(ii) (2 marks): Describe how you would use the apparatus shown in Fig. 3.2 to obtain the results shown in Table 3. [2]
- November 2021, AS Paper 2, Q3(d)(iii) (3 marks): Plot a graph of the results shown in Table 3 on the grid below. [3]
- November 2021, AS Paper 2, Q3(d)(iv) (3 marks): Use your graph to calculate the initial rate of reaction. Give your answer to 2 significant figures. Rate of reaction = cm3 s–1 [3]
- November 2021, AS Paper 2, Q3(d)(v) (1 mark): The students investigating 30 °C calculated the initial rate of reaction to be 0.48 cm3 s–1. Calculate the temperature coefficient (Q10) for this reaction. Give
- November 2021, AS Paper 2, Q3(e) (6 marks): Students carried out a practical investigation into the effect of enzyme concentration on the rate of reaction. They were provided with: • a 1% solution of the
- November 2020, Paper 2, Q17(b)(i) (2 marks): Calculate how many times more active immobilised tannase is compared to free tannase at pH8.0. Give your answer to an appropriate number of significant figures.
- November 2020, Paper 2, Q17(b)(ii) (1 mark): Draw a line of best fit for the free tannase on the graph. .... Answer on the graph • [1]
- November 2020, Paper 2, Q17(b)(iii) (3 marks): A student concluded that the optimum pH for this tannase enzyme is pH5.8. Explain why the data in the graph might not support the student's conclusion. [3]
- November 2020, AS Paper 1, Q14 (1 mark): The graph below shows how the rate of reaction of the enzyme pepsin changes with temperature. 0.04 0.03 rate of reaction (s–1) 0.02 0.01 0 0 10 20 30 40 50 temp
- June 2019, Paper 3, Q3(c)(i) (4 marks): Suggest and explain two improvements that would increase the validity of the students’ investigation. Improvement Explanation Improvement Explanation [4]
- June 2019, Paper 3, Q3(c)(ii) (1 mark): Suggest appropriate units to use to represent the rate of enzyme activity in this investigation. [1]
- June 2019, Paper 3, Q3(c)(iii) (2 marks): The students recorded the temperature that produced the fastest reaction rate in each of the five replicates. These results are shown in Table 3. Temperature th
- June 2019, Paper 3, Q3(c)(iv) (2 marks): The students wanted to know whether there was a difference between the reaction rates of the two forms of trypsin at 30 °C. They performed a statistical test on
- June 2019, AS Paper 1, Q25(c)(i) (2 marks): Explain why there is a difference in the shapes of the curves at 37 °C and 60 °C. [2]
- June 2019, AS Paper 1, Q25(c)(ii) (2 marks): Explain why there is a difference in the shapes of the curves at 25 °C and 37 °C. [2]
- June 2018, Paper 2, Q3 (1 mark): Celery contains the enzyme catalase, which breaks down hydrogen peroxide into oxygen and water. A student added liquidised celery to a solution of hydrogen pero
- June 2018, AS Paper 1, Q10 (1 mark): A scientist was investigating the effect of two different temperatures on the rate of enzyme controlled decomposition of ammonia, in soil bacteria. They repeate
- June 2017, AS Paper 1, Q26(a) (3 marks): State three variables that the student would need to control in order to make the results of this investigation valid. 1 2 3 [3]
- June 2017, AS Paper 1, Q26(b)(i) (1 mark): Describe how the rate of reaction was calculated. [1]
- June 2017, AS Paper 1, Q26(b)(ii) (2 marks): Explain what the standard deviation shows in Table 26. [2]
- June 2017, AS Paper 1, Q26(c) (3 marks): Fig. 26 shows the results plotted on a graph with the standard deviations as error bars. The effect of bromelain concentration on the rate of protein digestion
- June 2016, AS Paper 2, Q4(b)(i) (1 mark): Why is pH not a controlled variable in this investigation? [1]
- June 2016, AS Paper 2, Q4(b)(ii) (1 mark): Identify one variable that has been controlled in this procedure. [1]
- June 2016, AS Paper 2, Q4(b)(iii) (1 mark): Identify one variable, other than pH, that has not been controlled in this procedure. [1]
- June 2016, AS Paper 2, Q4(b)(iv) (1 mark): The procedure required the solution to be stirred and then drops of solution to be placed on a white spotting tile. Suggest why this procedure was followed rath
- June 2016, AS Paper 2, Q4(b)(v) (1 mark): What can be concluded from the results in Table 4.1 about the optimum temperature for lipase activity? [1]
- June 2016, AS Paper 2, Q4(b)(vi) (4 marks): Describe two different ways in which the procedure could be modified to obtain a more accurate value for the optimum temperature for lipase activity. 1 2 [4]
- June 2016, AS Paper 2, Q4(c) (6 marks): (c)* There are two models for the mechanism of enzyme action. Outline how changes in temperature can affect these mechanisms of lipase action. [6]
Questions, mark schemes and examiner’s reports are © OCR, from their published past papers. Plumi isn’t affiliated with any exam board. Want whole papers? OCR A-Level Biology A past papers, or our free OCR-style practice pack.
The Plumi iPad app also offers exam-style questions with AI feedback on your handwritten working.