 plumi
Bacterial growth curves: Edexcel International A Level Biology questions
Edexcel International A Level Biology past-paper questions on 6.1.3 Bacterial growth curves, 2019–2025, with mark schemes and examiner’s reports where available.
Paper
All papers
Exam
All years
Calculations
Q7(d)
The whole paper ↗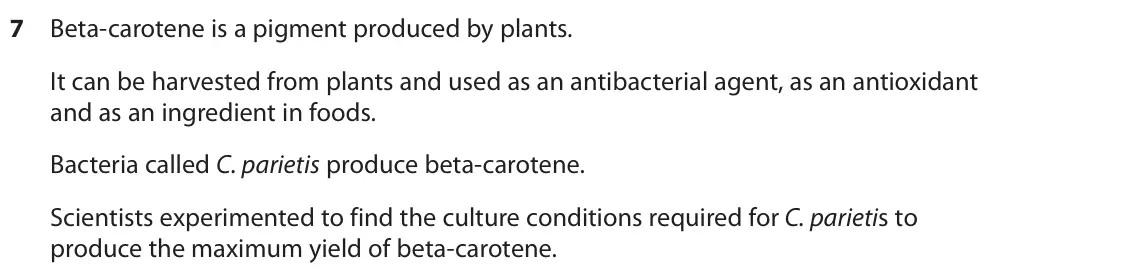
Q7(e)(i)
The whole paper ↗
Q7(e)(ii)
The whole paper ↗Q2(b)
The whole paper ↗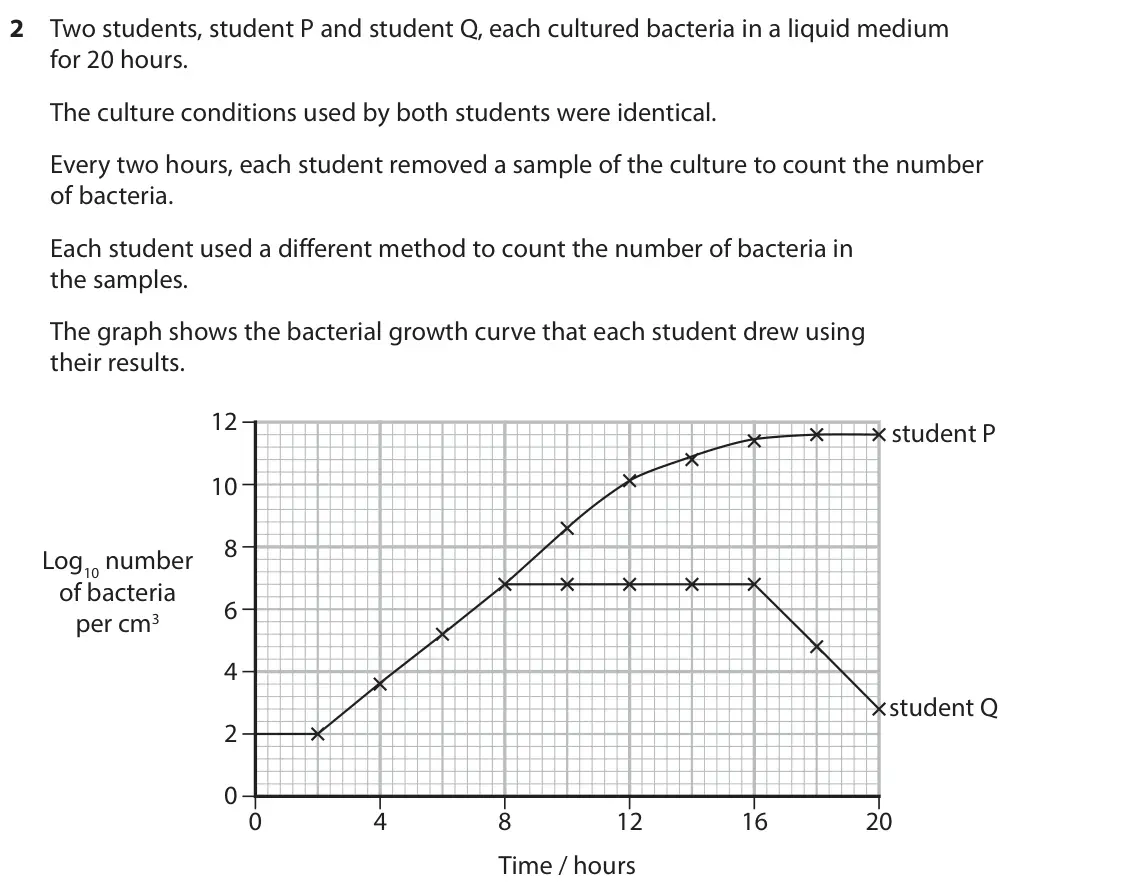
Q7(b)(ii)
The whole paper ↗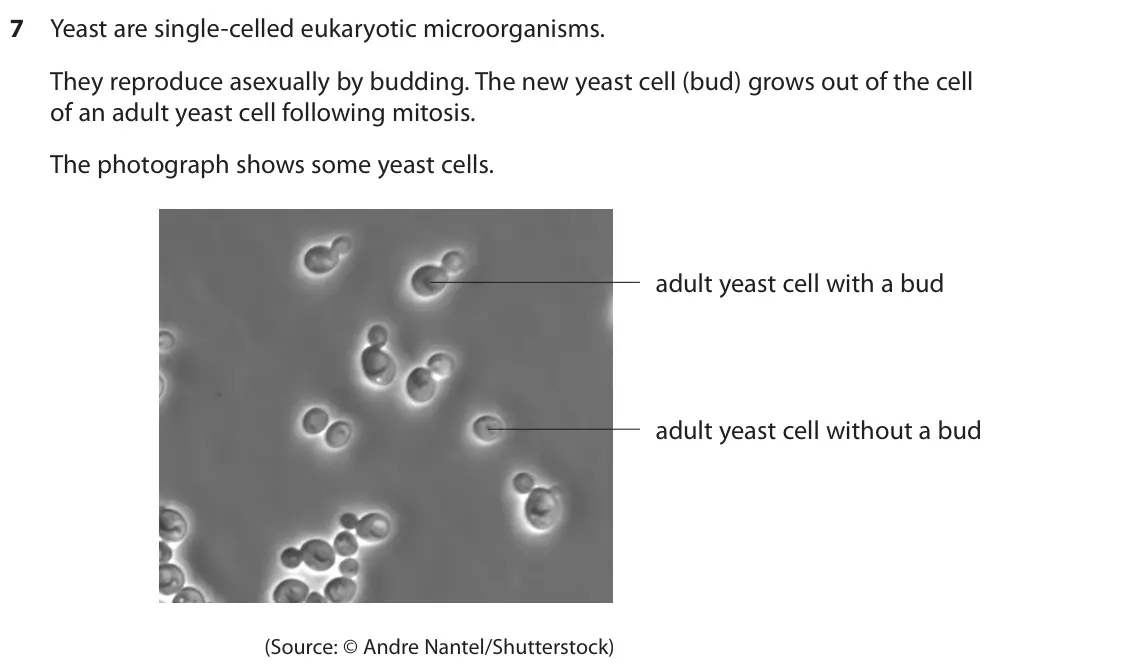
Q7(b)(iii)
The whole paper ↗Q3(b)
The whole paper ↗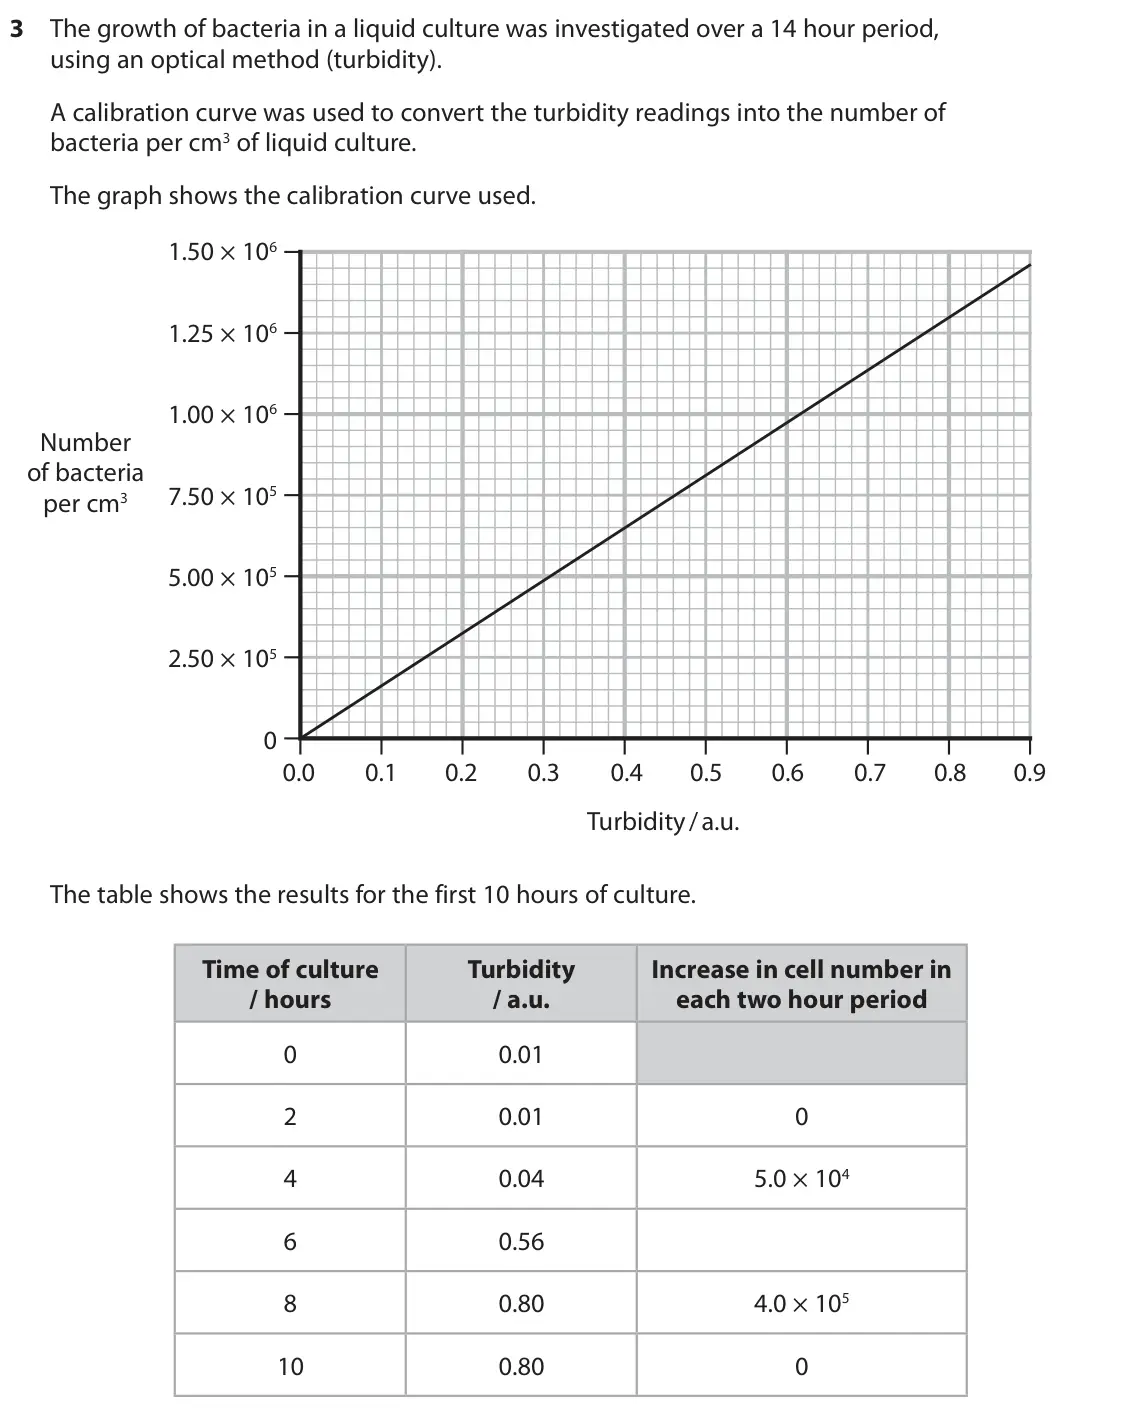
Q2(b)
The whole paper ↗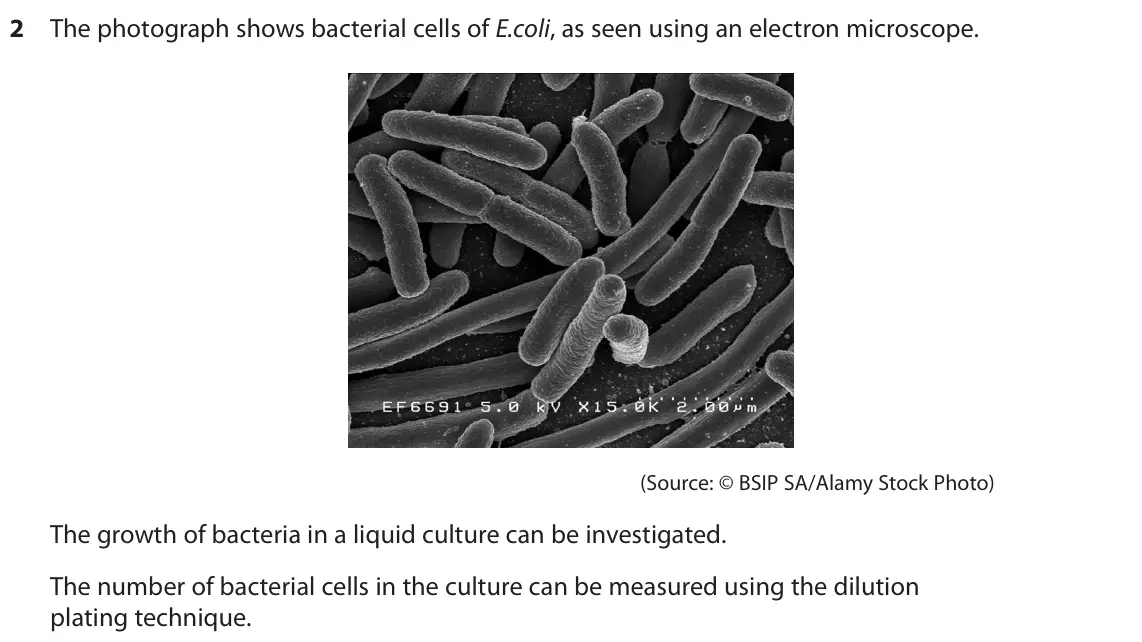
Q1(a)
The whole paper ↗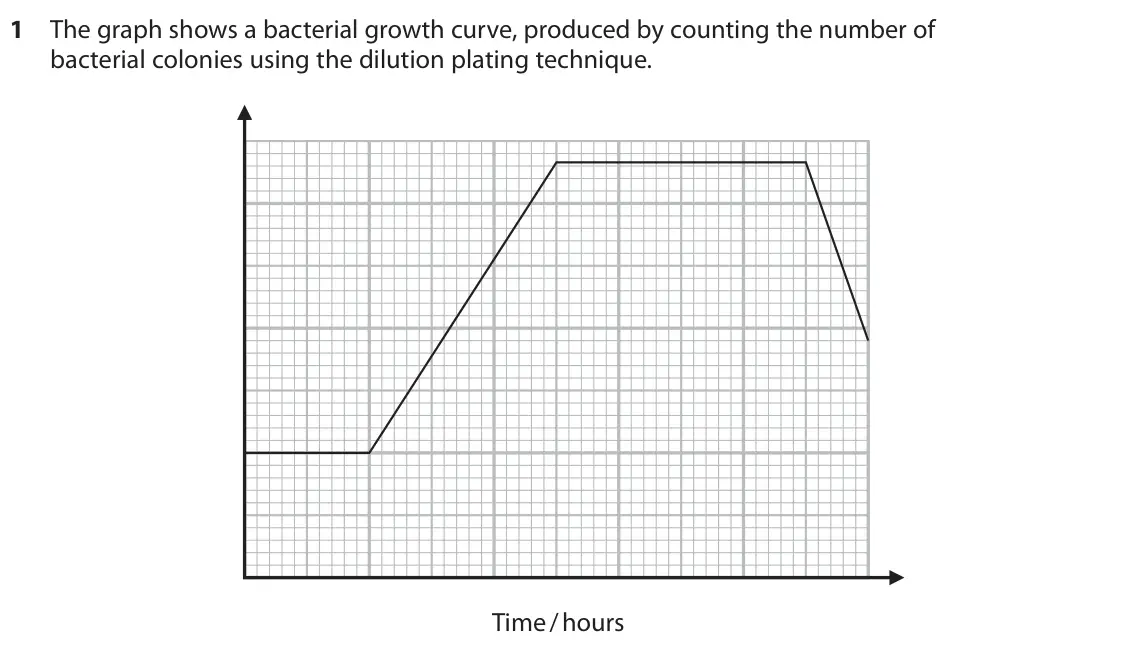 Your answer
Q2(c)(i)
The whole paper ↗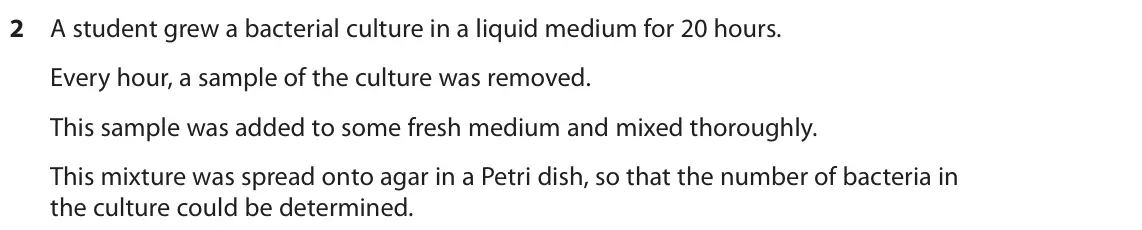 Your answer
Q2(c)(iii)
The whole paper ↗Q9(d)
The whole paper ↗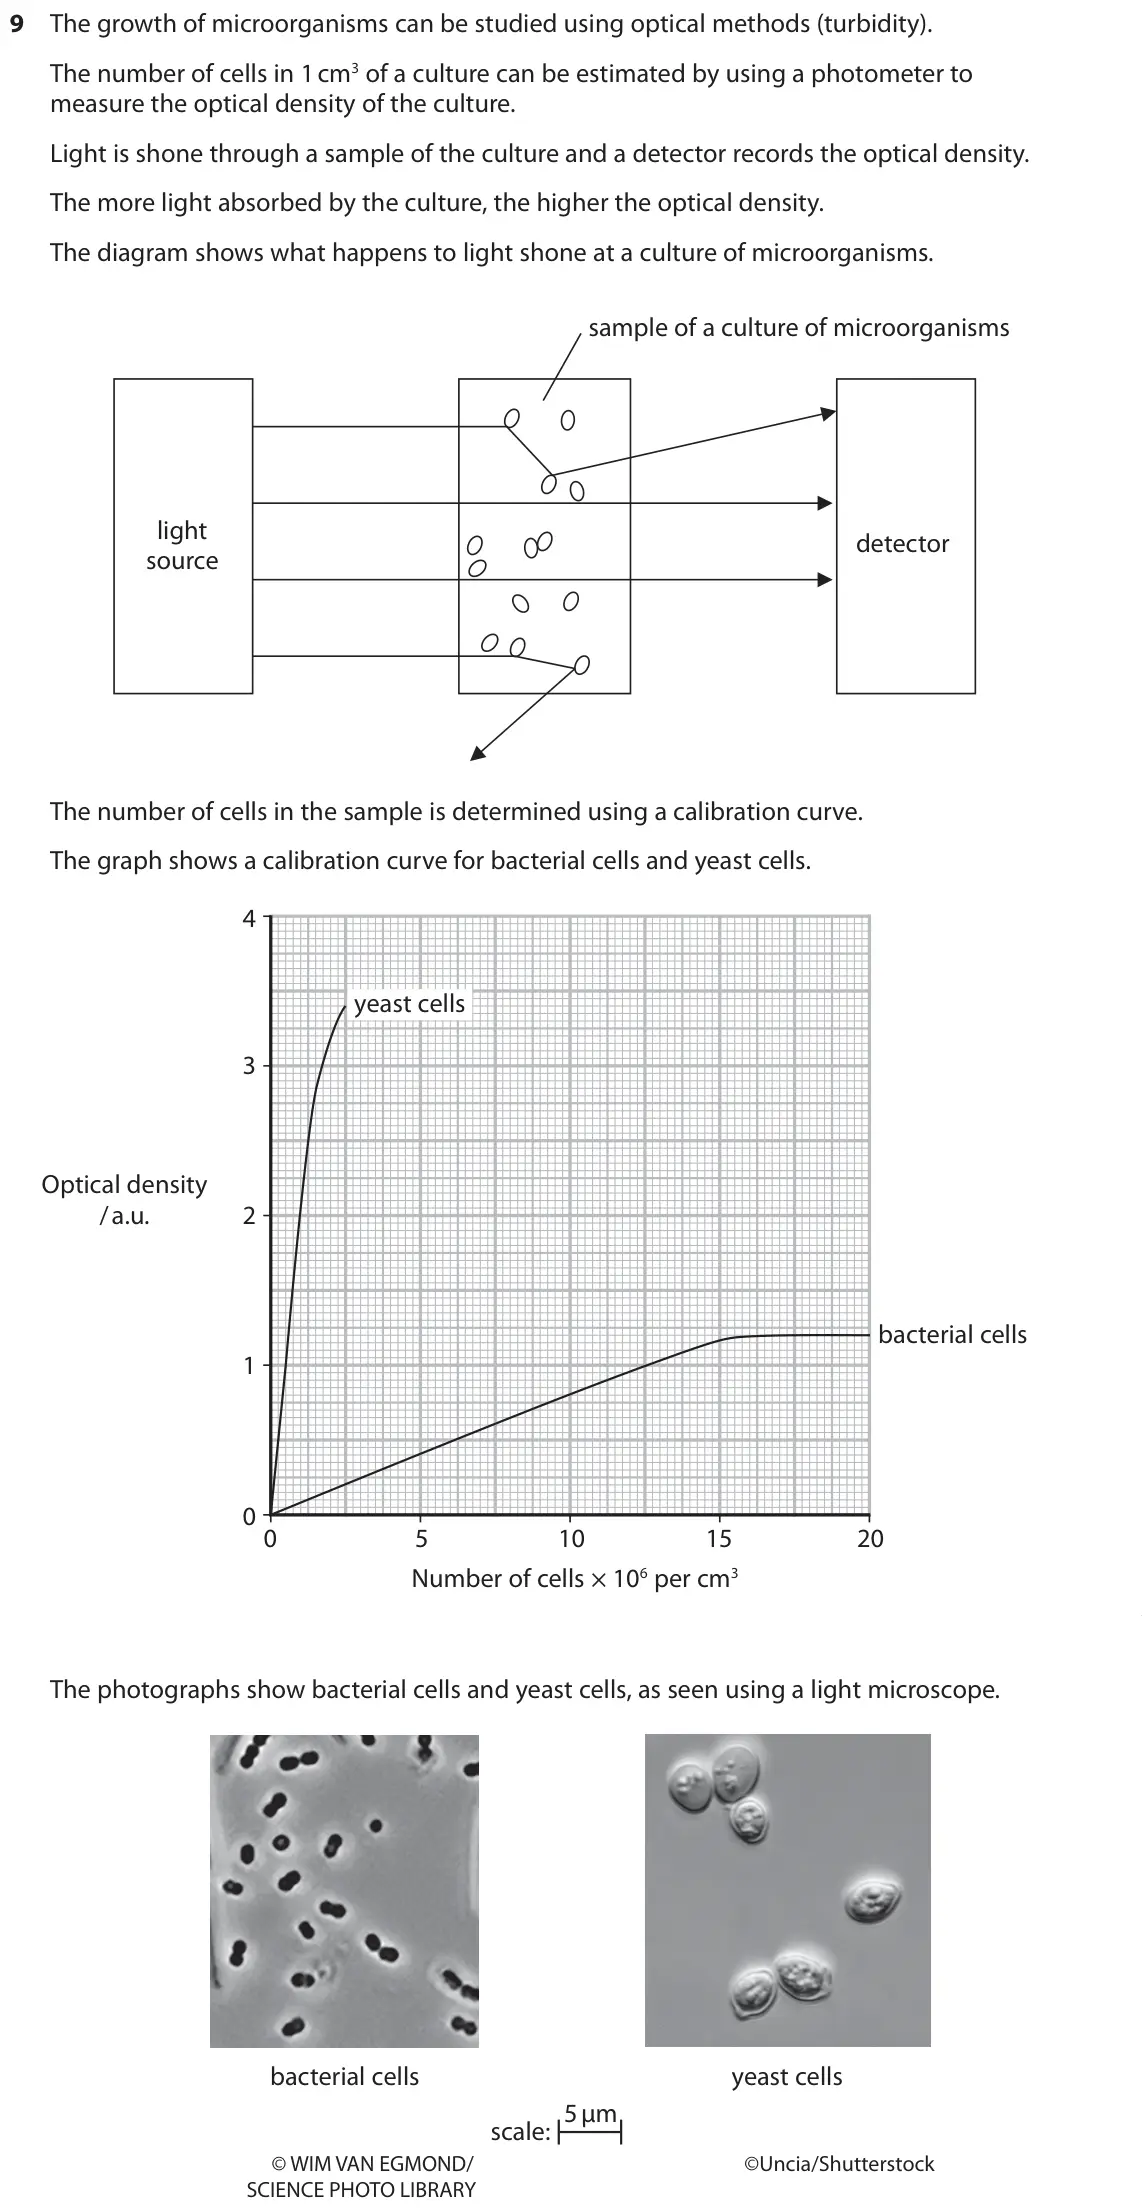
All 12 questions on Bacterial growth curves, as a list
- June 2025, Unit 4, Q7(d) (4 marks): The graph shows the mass of beta-carotene produced and the number of bacteria in the culture as determined by dilution plating. log10 number of bacteria mass of
- January 2025, Unit 4, Q7(e)(i) (2 marks): The graph shows the growth curve for two types of methanotrophs grown in a methane concentration of 500 a.u. The increase in turbidity of the culture was used t
- January 2025, Unit 4, Q7(e)(ii) (1 mark): Suggest why low methane concentrations are not able to support the growth of some methanotrophs, such as methanotroph A. (1)
- June 2024, Unit 4, Q2(b) (2 marks): Calculate the growth rate constant (k) of these bacteria between 2 hours and 6 hours of culture. (2) Use the equation: k = log N log N 10 t 10 0 t 0.301 where:
- January 2024, Unit 4, Q7(b)(ii) (4 marks): The growth curve for yeast grown in culture has four phases, similar to bacteria grown in culture. Sketch a growth curve on the axes drawn below. Label the axes
- January 2024, Unit 4, Q7(b)(iii) (4 marks): Describe how the student could use a growth curve to determine the exponential growth rate constant for the yeast. (4)
- October 2023, Unit 4, Q3(b) (2 marks): Explain the changes during the first six hours of this culture. (2)
- January 2023, Unit 6, Q2(b) (3 marks): The growth rate constant (k) for a bacterial population can be found using the equation: log N log N k 10 t 10 0 0 301 . t × Nt is final number of bacteria N0 i
- October 2022, Unit 4, Q1(a) (1 mark): Which label should be used for the y-axis of this graph? (1) A log10 number of living bacterial cells B log10 total number of bacterial cells C number of living
- June 2022, Unit 4, Q2(c)(i) (1 mark): Which shows the order of the phases of a bacterial growth curve? (1) A exponential → lag → death → stationary B lag → stationary → death → exponential C lag → e
- June 2022, Unit 4, Q2(c)(iii) (2 marks): Calculate the growth rate constant (k) of these bacteria between 4 hours and 10 hours. (2) log N − log N Use the equation: k = 10 t 10 0 × 0 301 . t Give your a
- January 2020, Unit 4, Q9(d) (3 marks): A liquid medium was inoculated with 6 × 10³ bacterial cells and the culture was incubated for a period of time. At the end of this incubation period, there were
Questions, mark schemes and examiner’s reports are © Pearson Edexcel, from their published past papers. Plumi isn’t affiliated with any exam board. Want whole papers? Edexcel International A Level Biology past papers.
The Plumi iPad app also offers exam-style questions with AI feedback on your handwritten working.