 plumi
Instantaneous and average rates of change: Edexcel GCSE Maths questions
Every Edexcel GCSE Maths exam question on R15 Instantaneous and average rates of change, 2017–2025, with its mark scheme and examiner’s report.
Find questions997
Exam
All years
Calculator
All 11 questions on Instantaneous and average rates of change, as a list
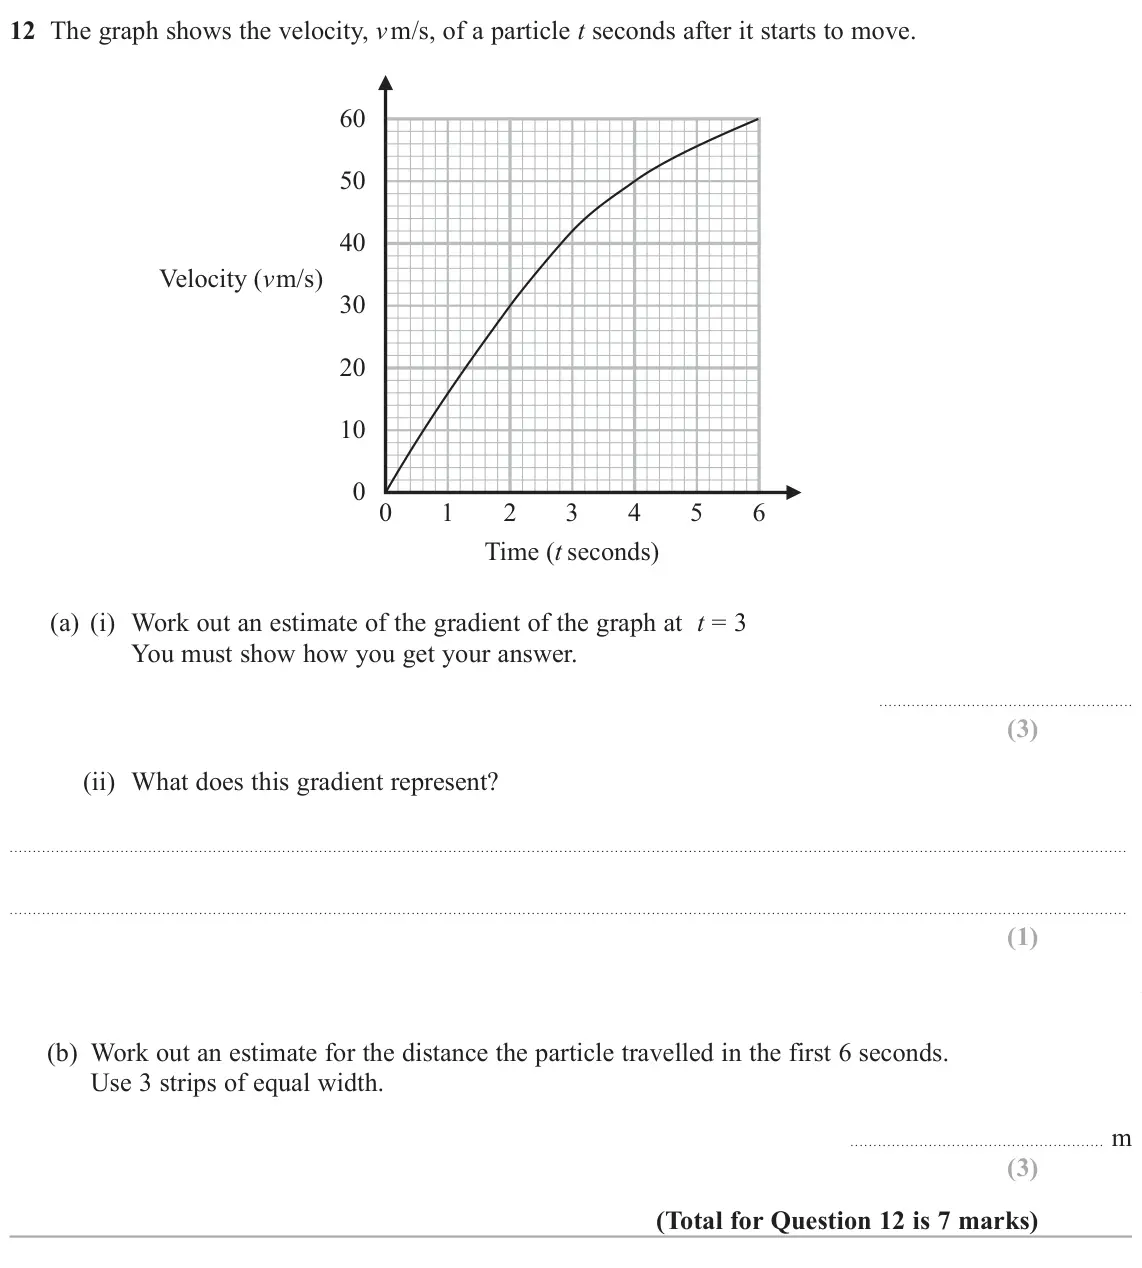
- June 2025, Paper 1H, Q12 (7 marks): The graph shows the velocity, v m/s, of a particle t seconds after it starts to move. 60 50 40 Velocity (v m/s) 30 20 10 0 0 1 2 3 4 5 6 Time (t seconds) (a) (i
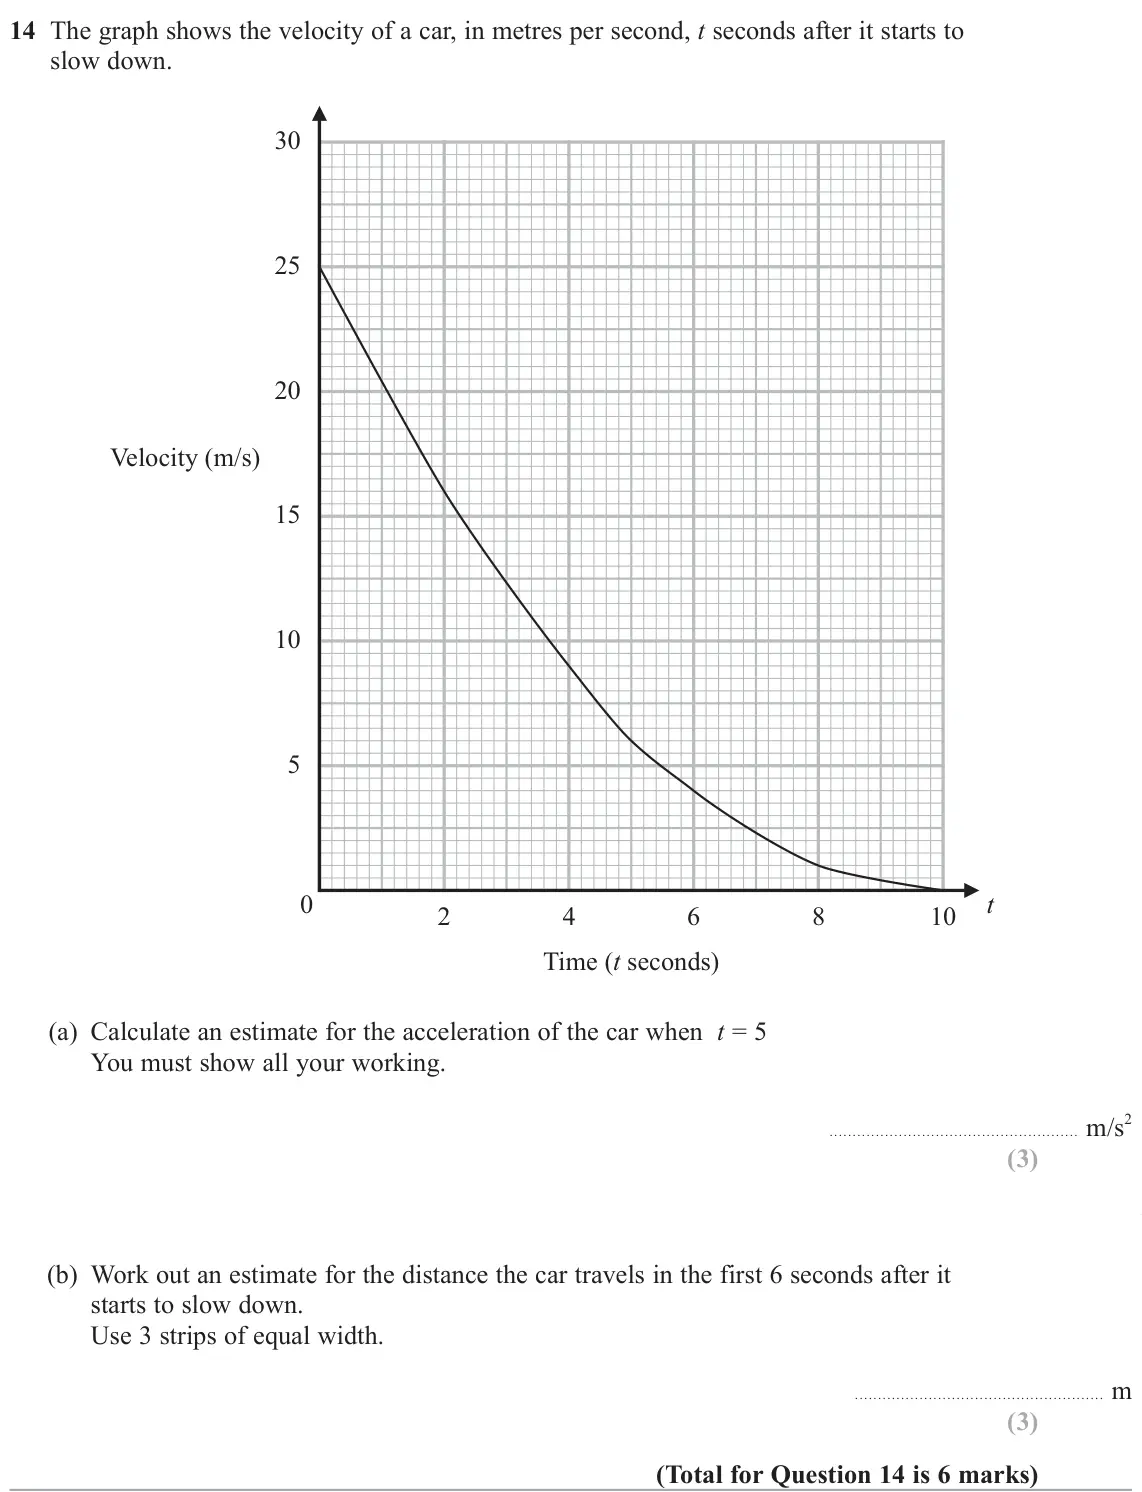
- June 2024, Paper 2H, Q14 (6 marks): The graph shows the velocity of a car, in metres per second, t seconds after it starts to slow down. 30 25 20 Velocity (m/s) 15 10 5 t 0 2 4 6 8 10 Time (t seco
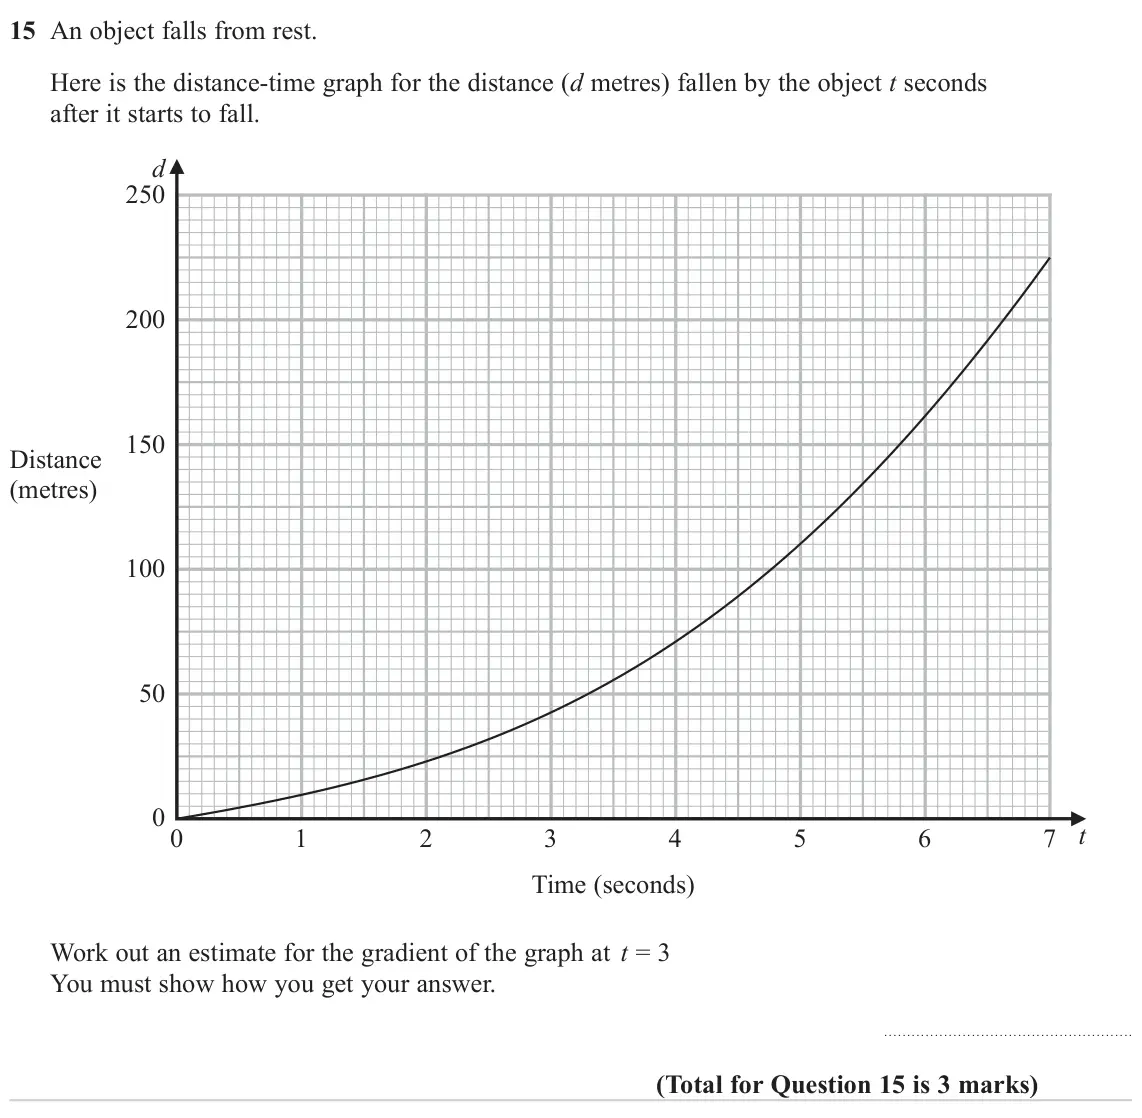
- November 2023, Paper 1H, Q15 (3 marks): An object falls from rest. Here is the distance‑time graph for the distance (d metres) fallen by the object t seconds after it starts to fall. d 250 200 150 Dis
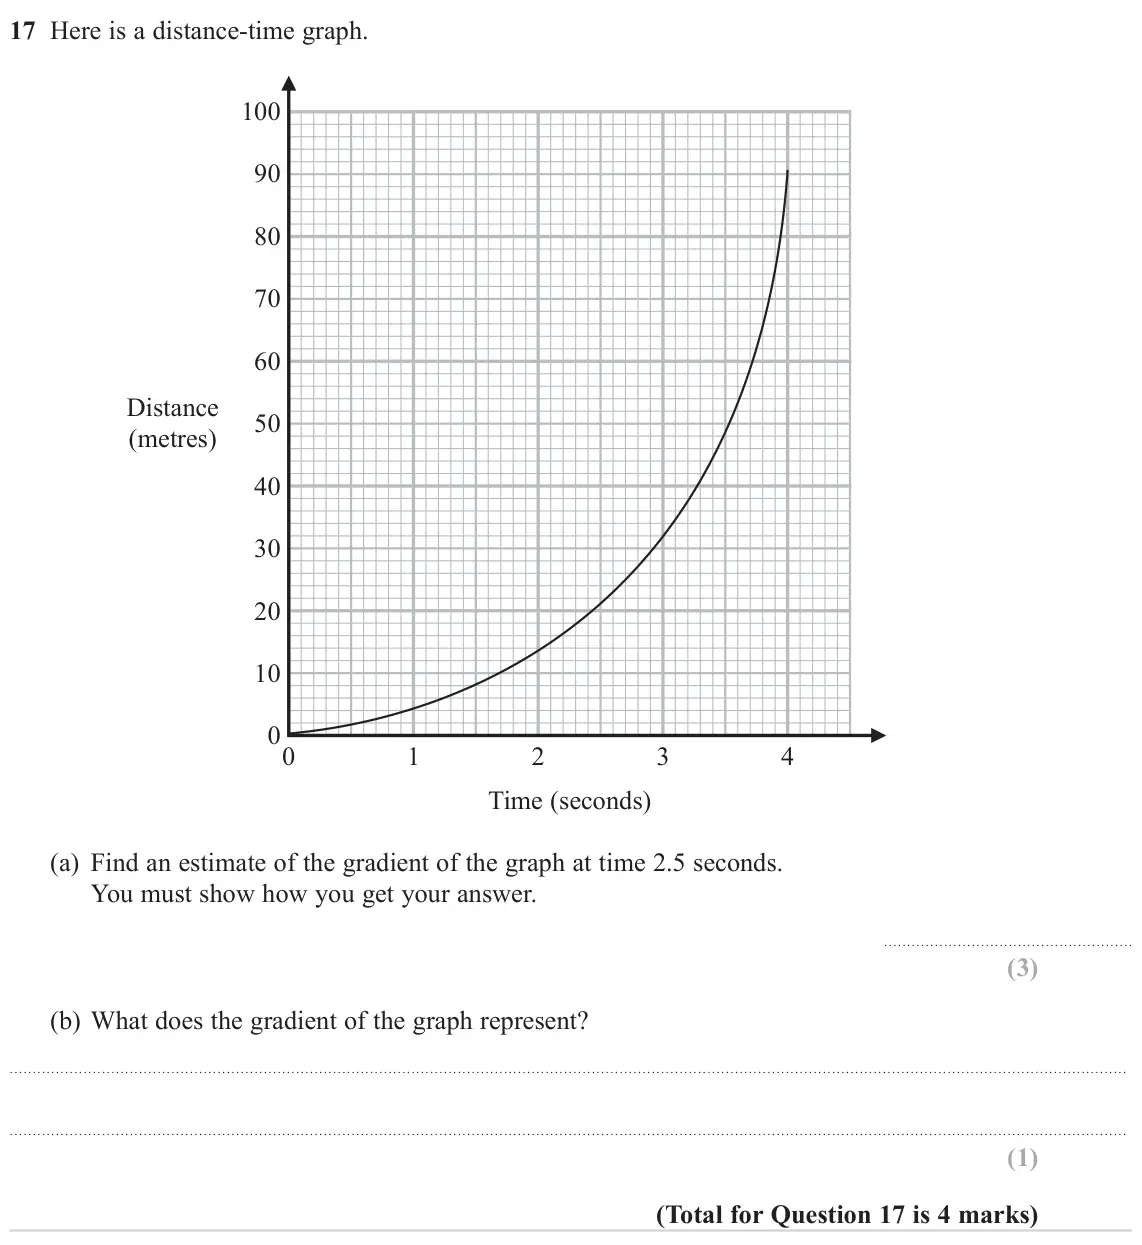
- June 2023, Paper 3H, Q17 (4 marks): Here is a distance-time graph. 100 90 80 70 60 Distance 50 (metres) 40 30 20 10 0 0 1 2 3 4 Time (seconds) (a) Find an estimate of the gradient of the graph at
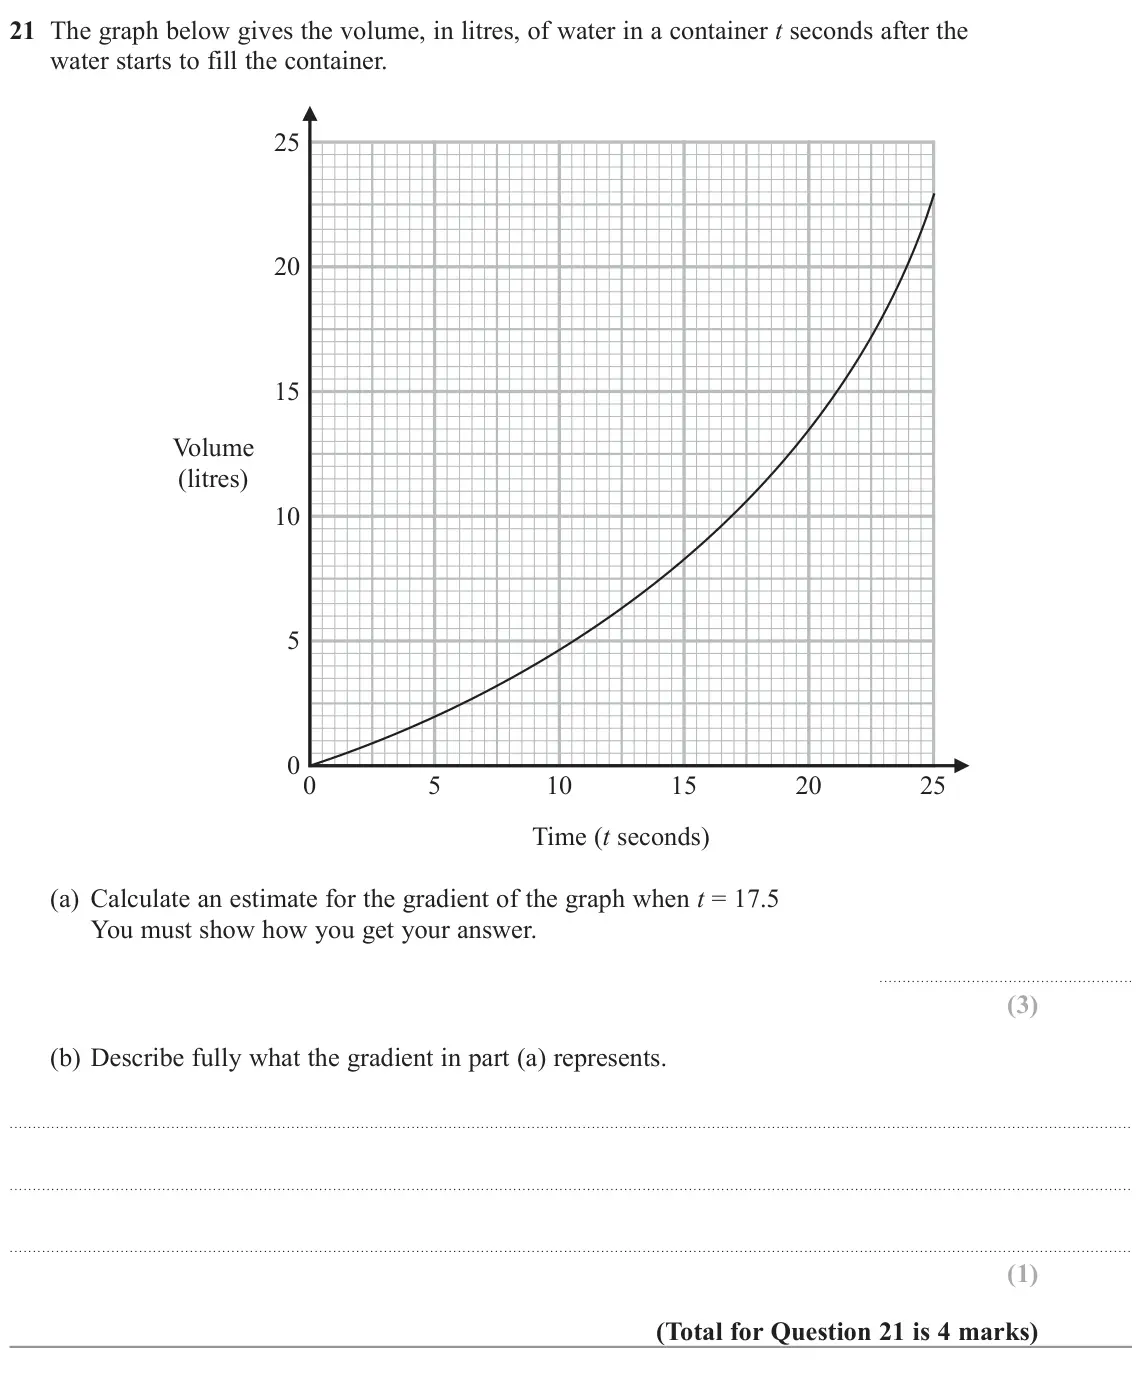
- November 2022, Paper 2H, Q21 (4 marks): The graph below gives the volume, in litres, of water in a container t seconds after the water starts to fill the container. 25 20 15 Volume (litres) 10 5 00 5
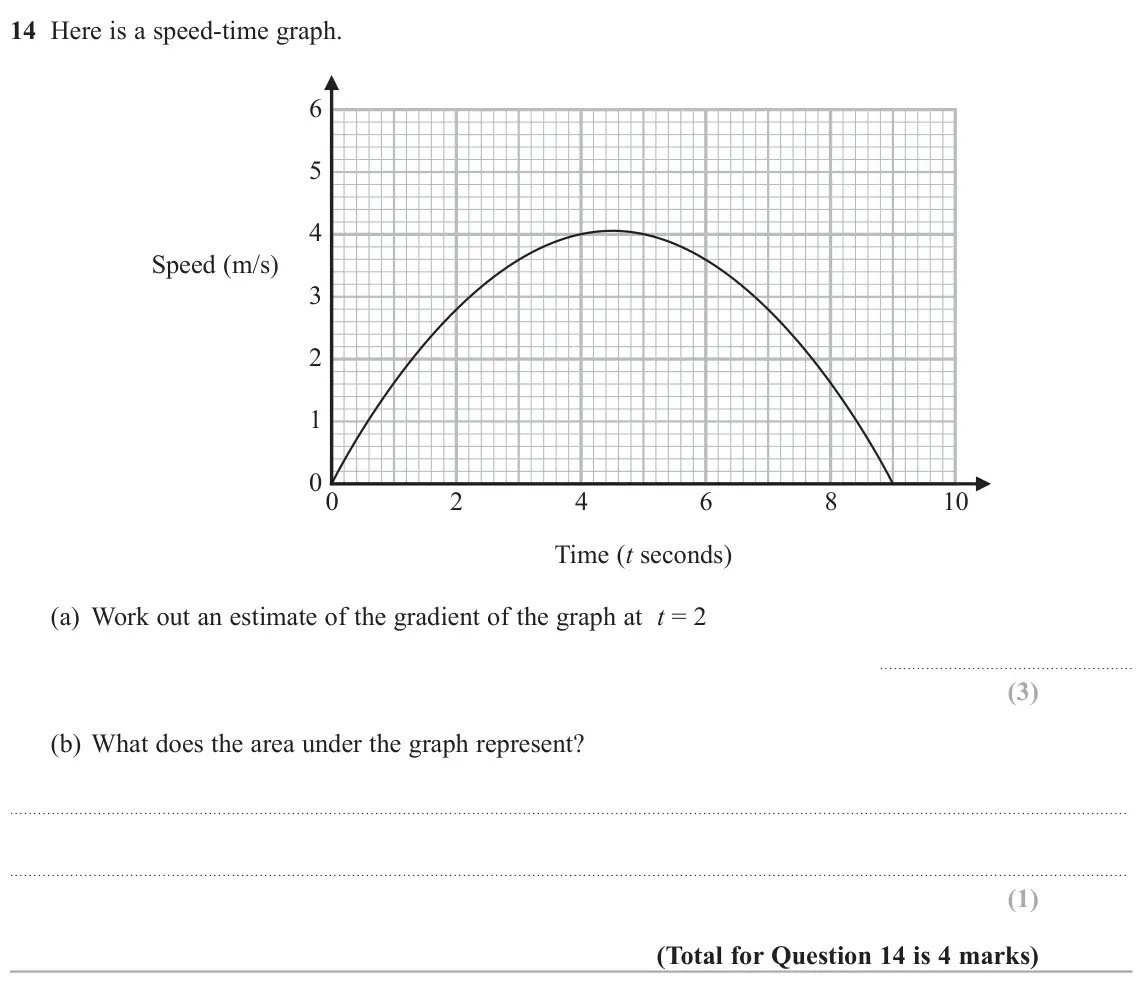
- June 2022, Paper 1H, Q14 (4 marks): Here is a speed-time graph. 6 5 4 Speed (m/s) 3 2 1 0 0 2 4 6 8 10 Time (t seconds) (a) Work out an estimate of the gradient of the graph at t = 2 (b) What does
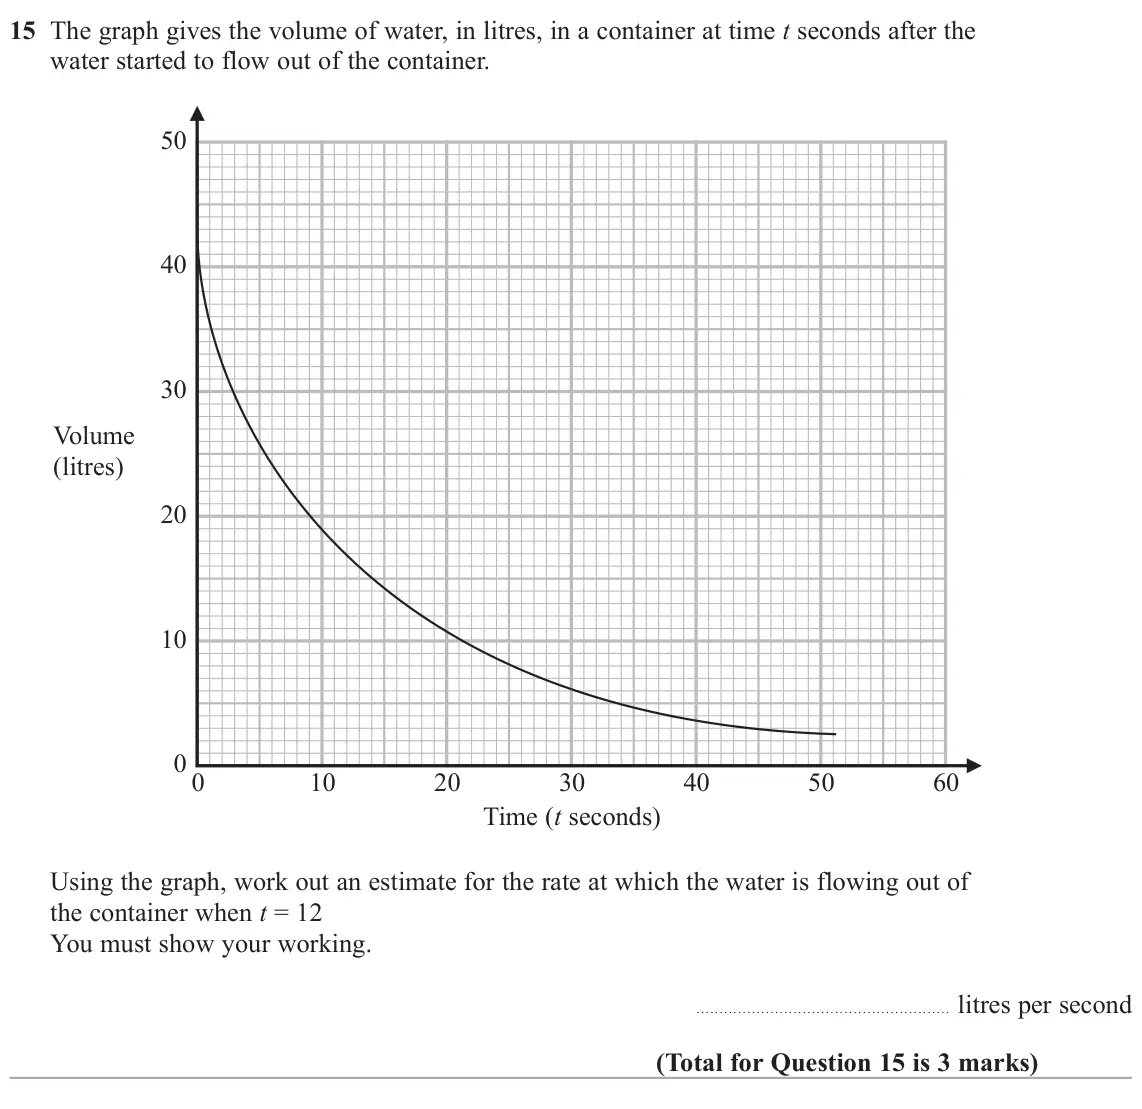
- November 2021, Paper 3H, Q15 (3 marks): The graph gives the volume of water, in litres, in a container at time t seconds after the water started to flow out of the container. 50 40 30 Volume (litres)
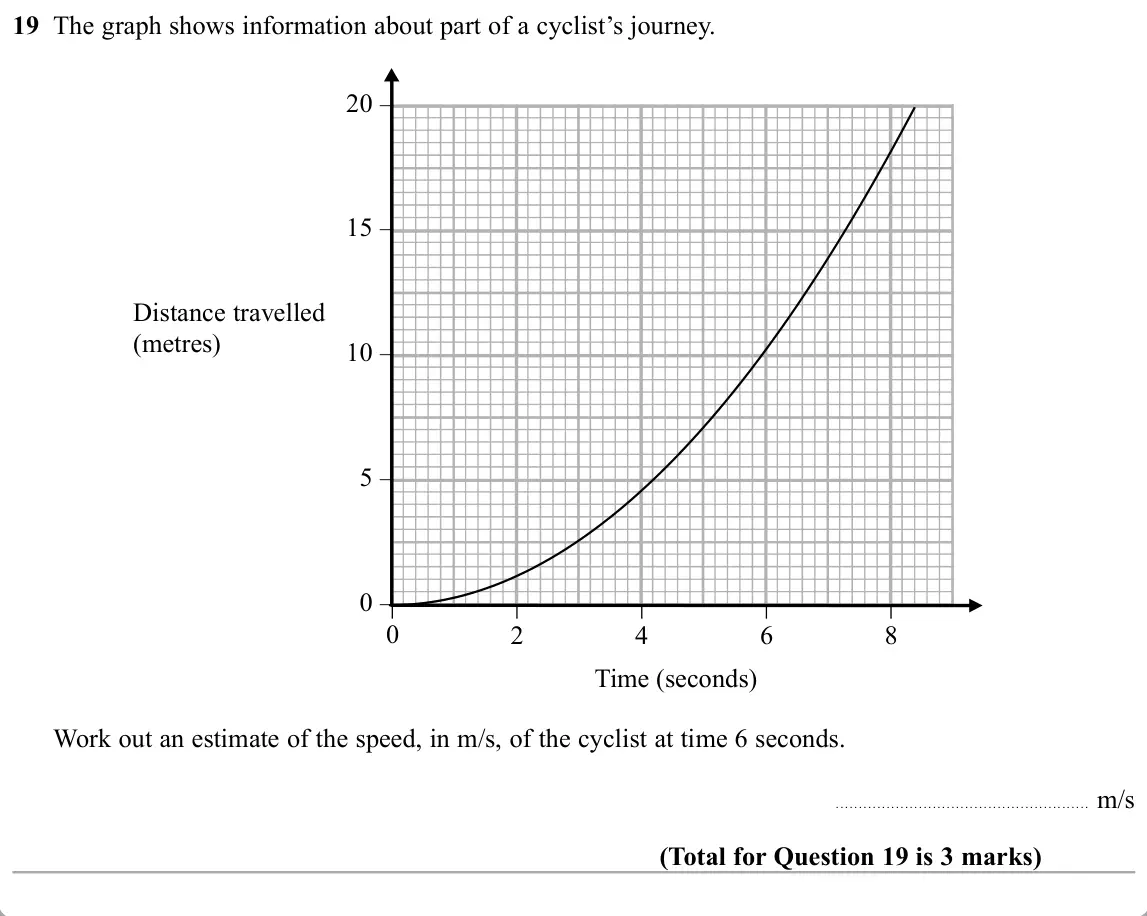
- November 2019, Paper 3H, Q19 (3 marks): The graph shows information about part of a cyclist’s journey. 20 – 15 – Distance travelled (metres) 10 – 5 – 0 – 0 2 4 6 8 Time (seconds) Work out an estimate
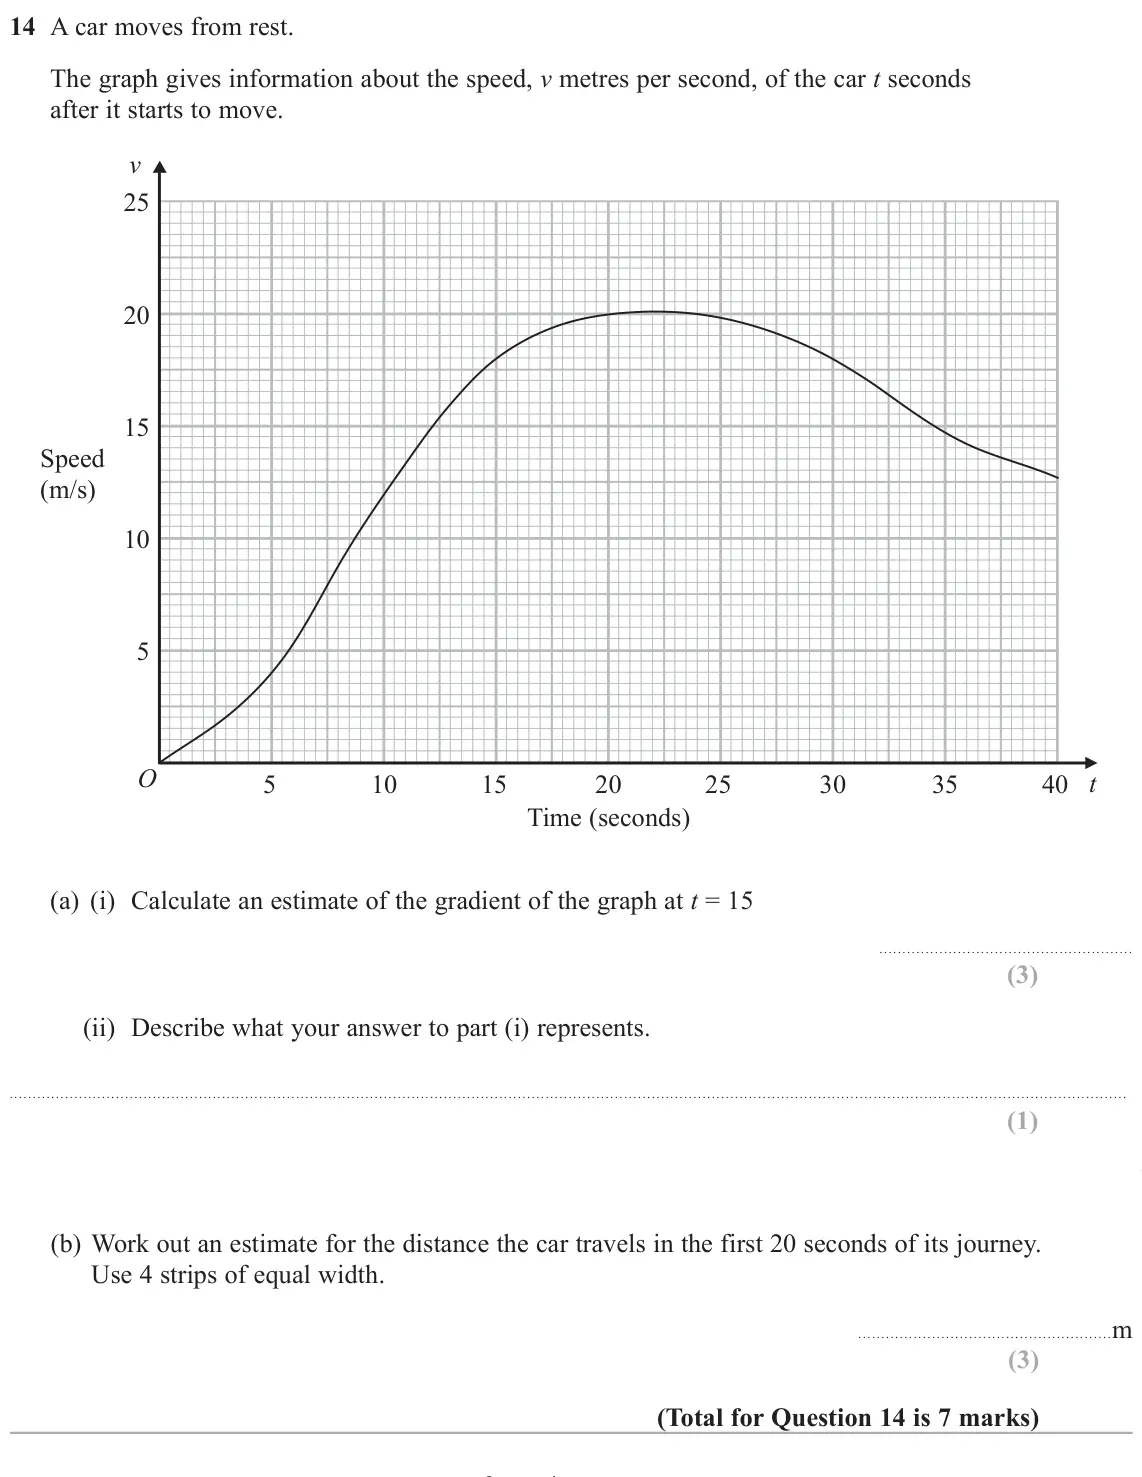
- June 2019, Paper 2H, Q14 (7 marks): A car moves from rest. The graph gives information about the speed, v metres per second, of the car t seconds after it starts to move. v 25 20 15 Speed (m/s) 10
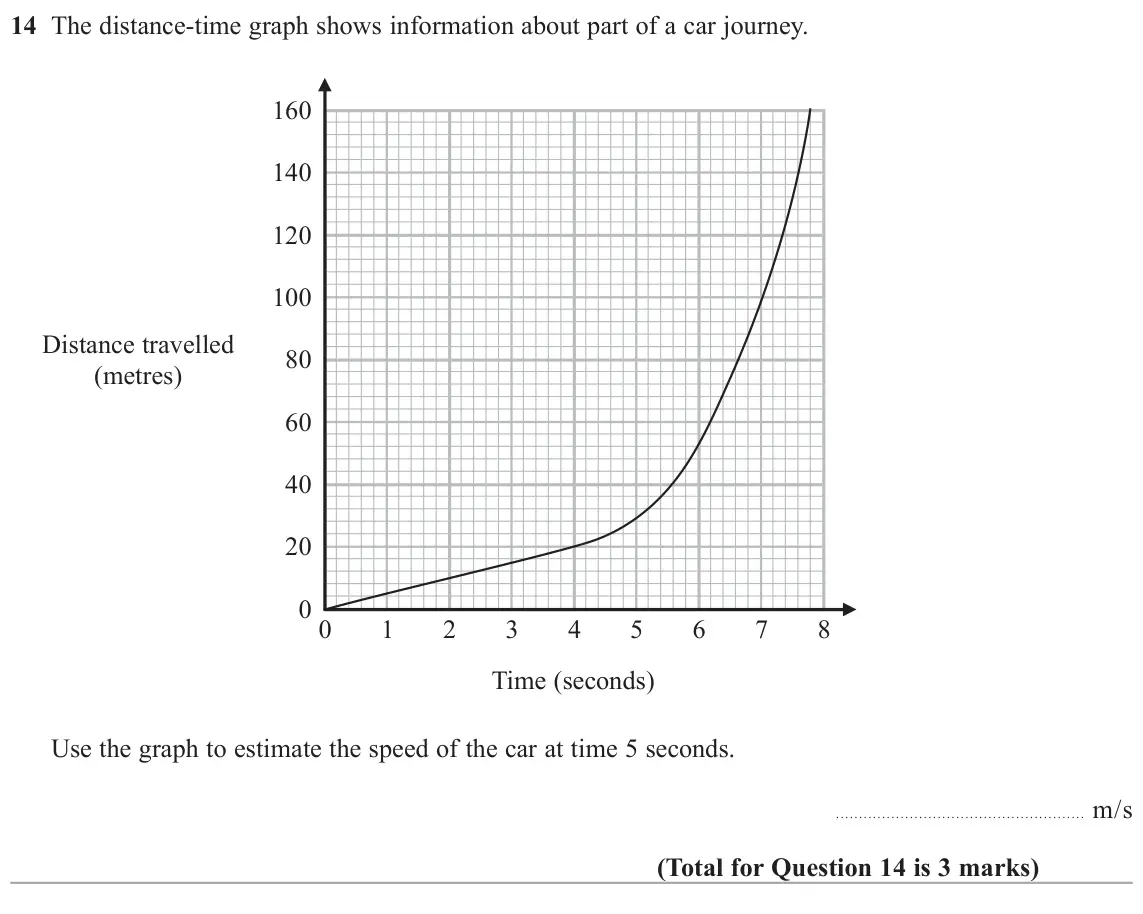
- June 2018, Paper 2H, Q14 (3 marks): The distance-time graph shows information about part of a car journey. 160 140 120 100 Distance travelled 80 (metres) 60 40 20 0 0 1 2 3 4 5 6 7 8 Time (seconds
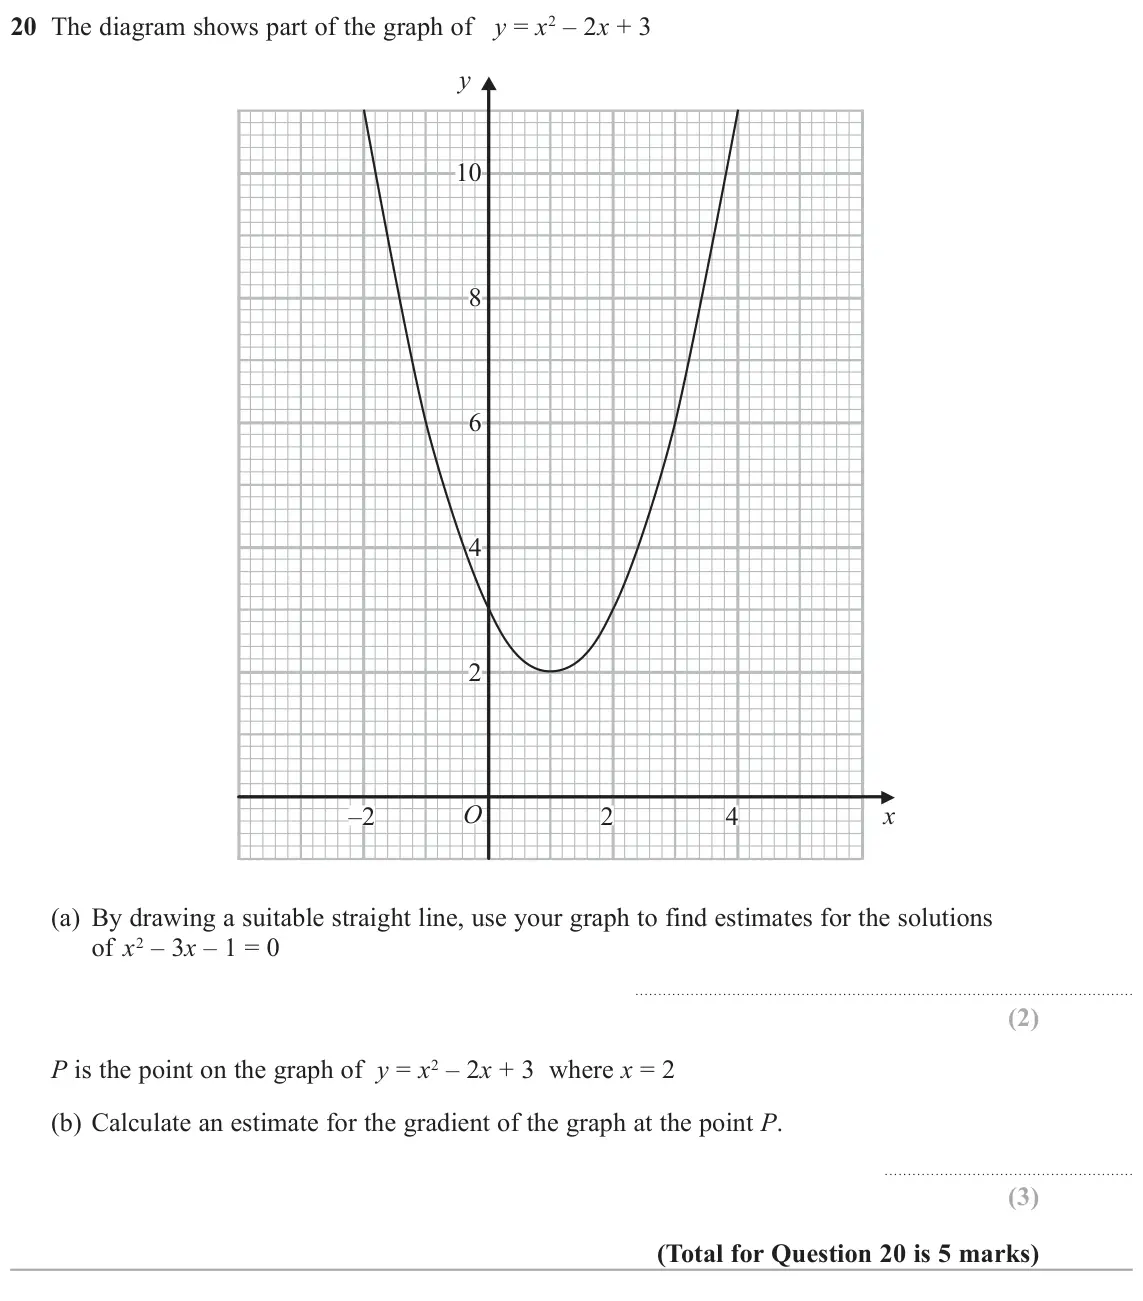
- June 2017, Paper 2H, Q20 (5 marks): The diagram shows part of the graph of y = x2 – 2x + 3 y 10 8 6 4 2 –2 O 2 4 x (a) By drawing a suitable straight line, use your graph to find estimates for the
Questions, mark schemes and examiner’s reports are © Pearson Edexcel, from their published past papers. Plumi isn’t affiliated with any exam board. Want whole papers? Every Edexcel GCSE Maths paper.
Rather write your answers by hand on iPad? Plumi marks them against the same mark schemes.