 plumi
Gradient as a rate of change: Edexcel GCSE Maths questions
Every Edexcel GCSE Maths exam question on R14 Gradient as a rate of change, 2017–2025, with its mark scheme and examiner’s report.
Find questions997
Exam
All years
Calculator
All 10 questions on Gradient as a rate of change, as a list
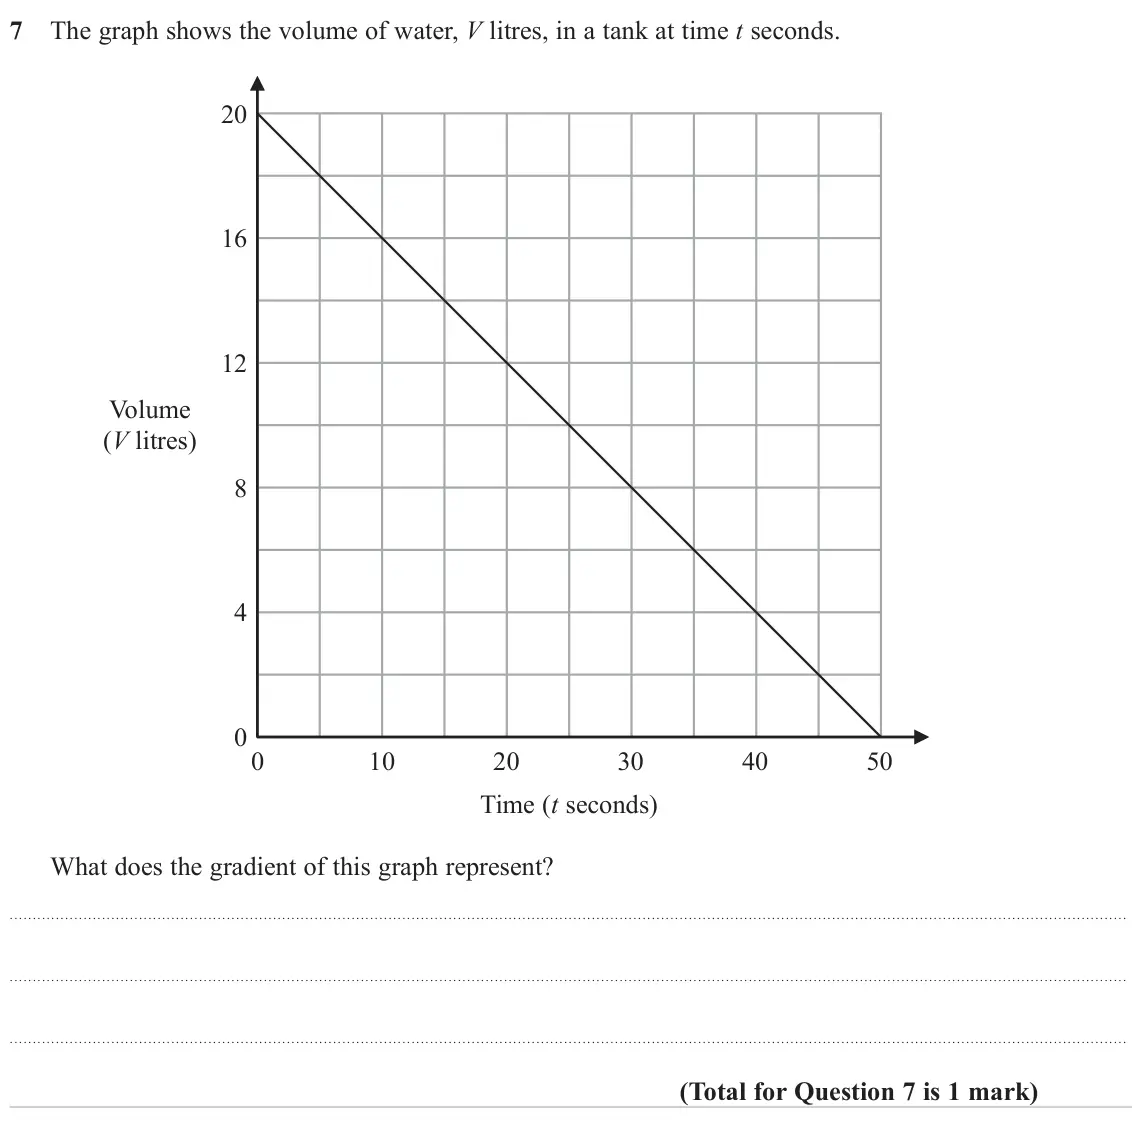
- November 2024, Paper 1H, Q7 (1 mark): The graph shows the volume of water, V litres, in a tank at time t seconds. 20 16 12 Volume (V litres) 8 4 0 0 10 20 30 40 50 Time (t seconds) What does the gra
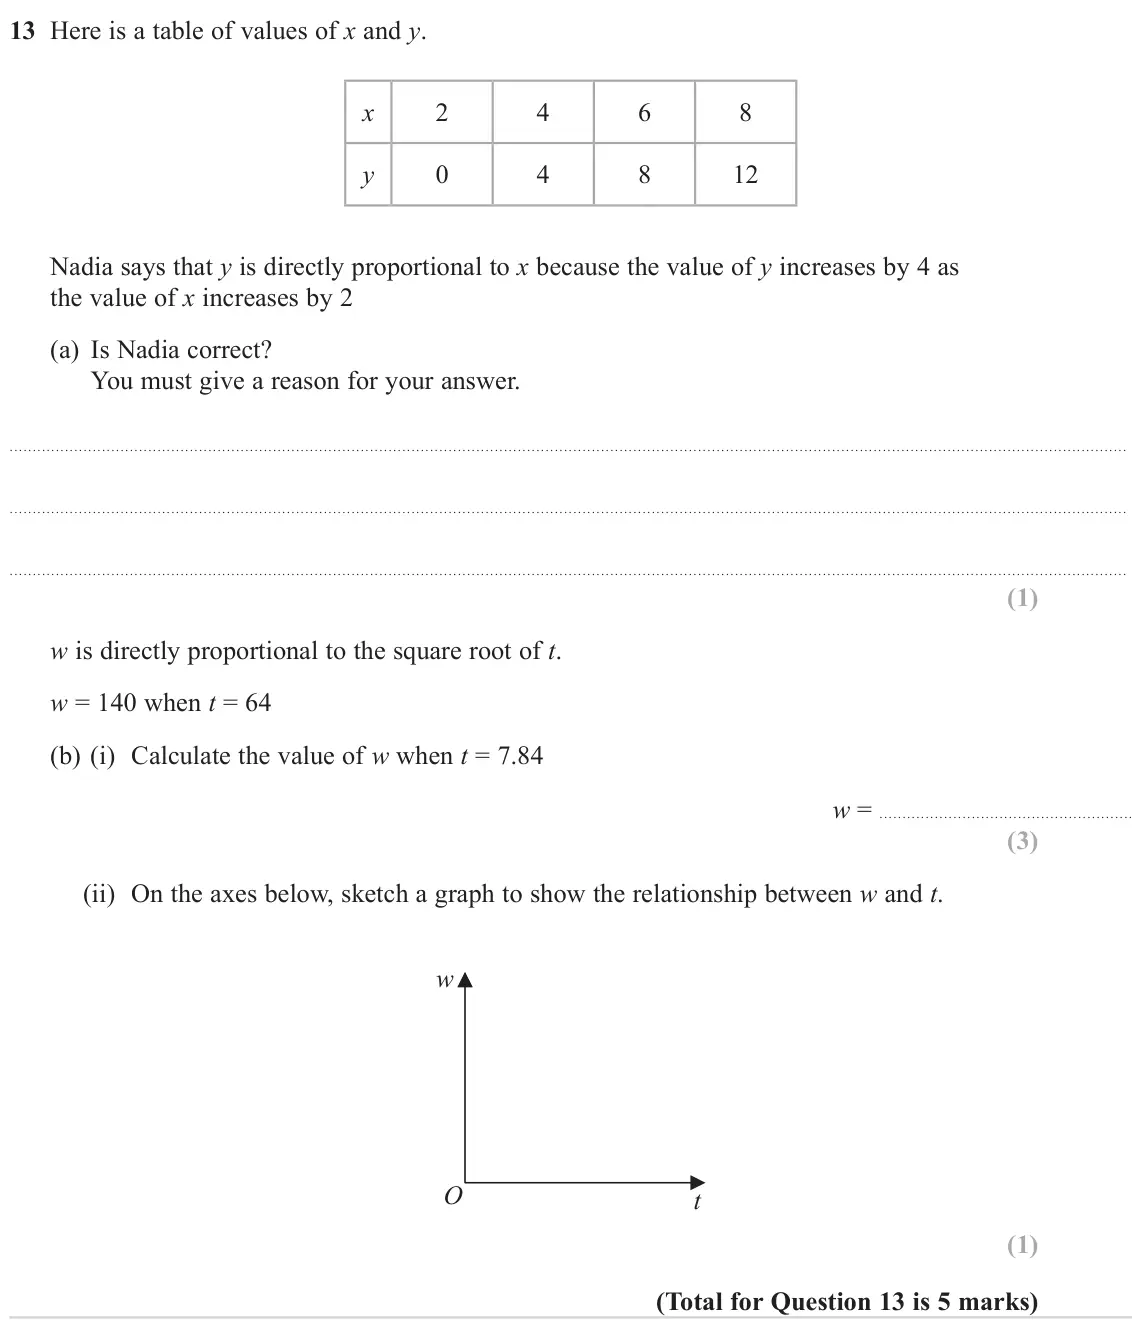
- November 2024, Paper 2H, Q13 (5 marks): Here is a table of values of x and y. x 2 4 6 8 y 0 4 8 12 Nadia says that y is directly proportional to x because the value of y increases by 4 as the value of
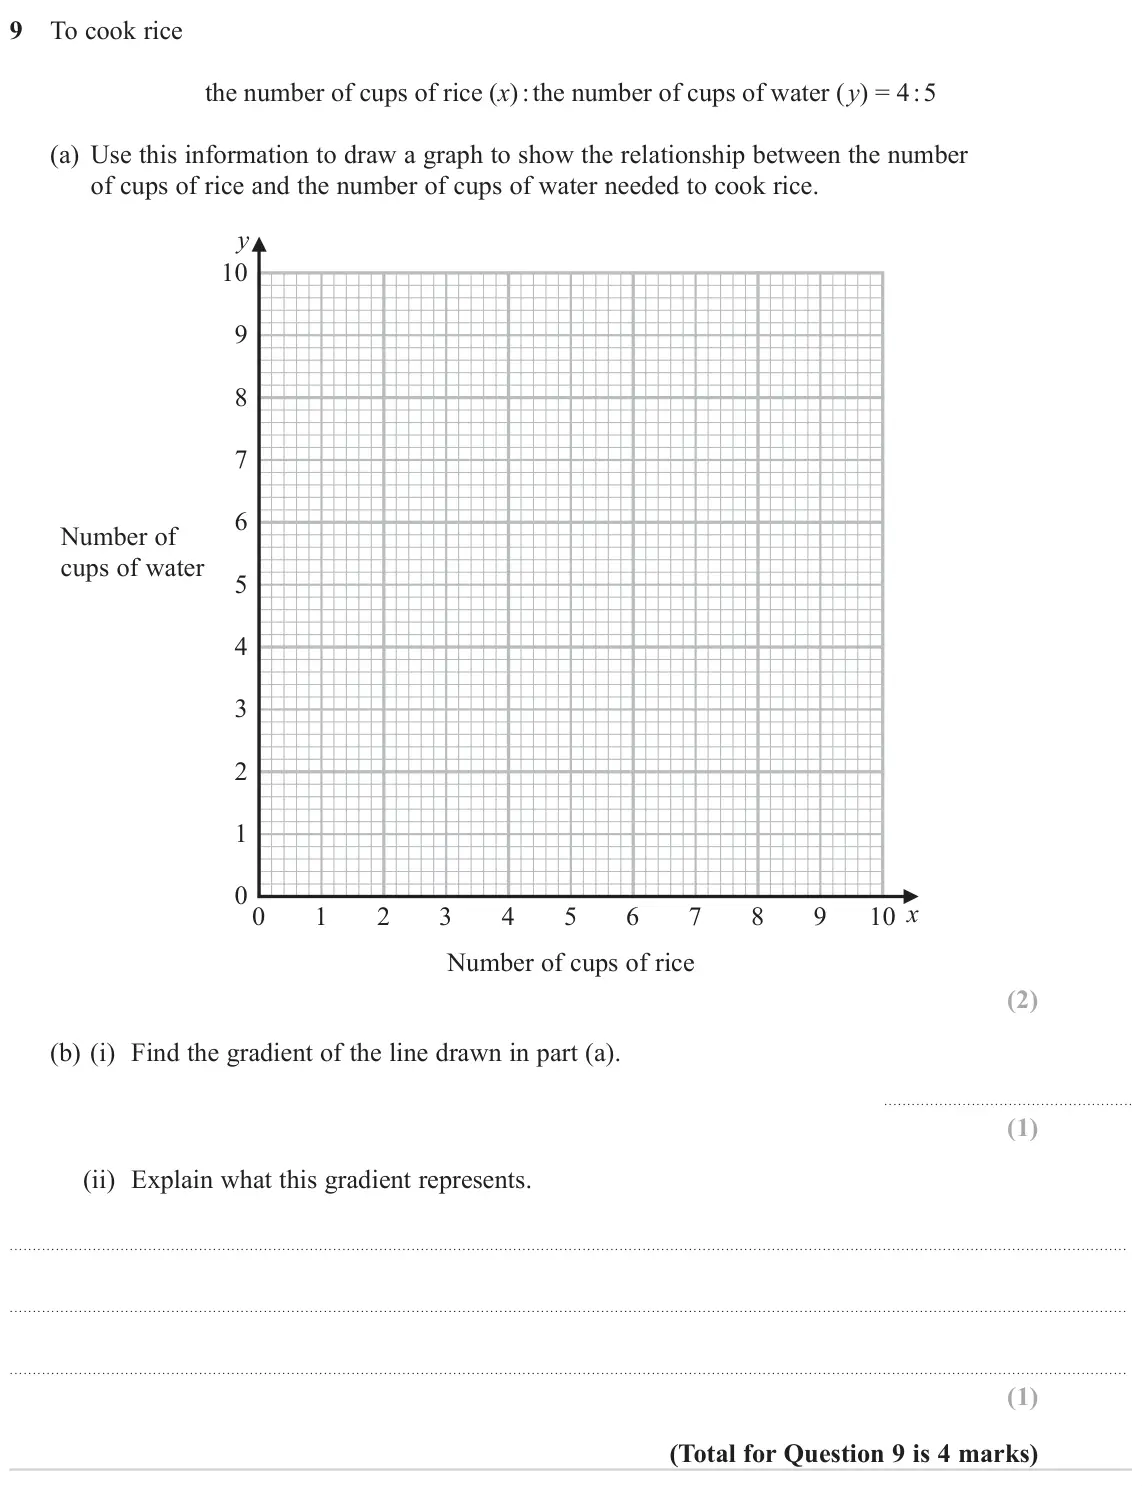
- November 2023, Paper 1H, Q9 (4 marks): To cook rice the number of cups of rice (x) : the number of cups of water (y) = 4 : 5 (a) Use this information to draw a graph to show the relationship between
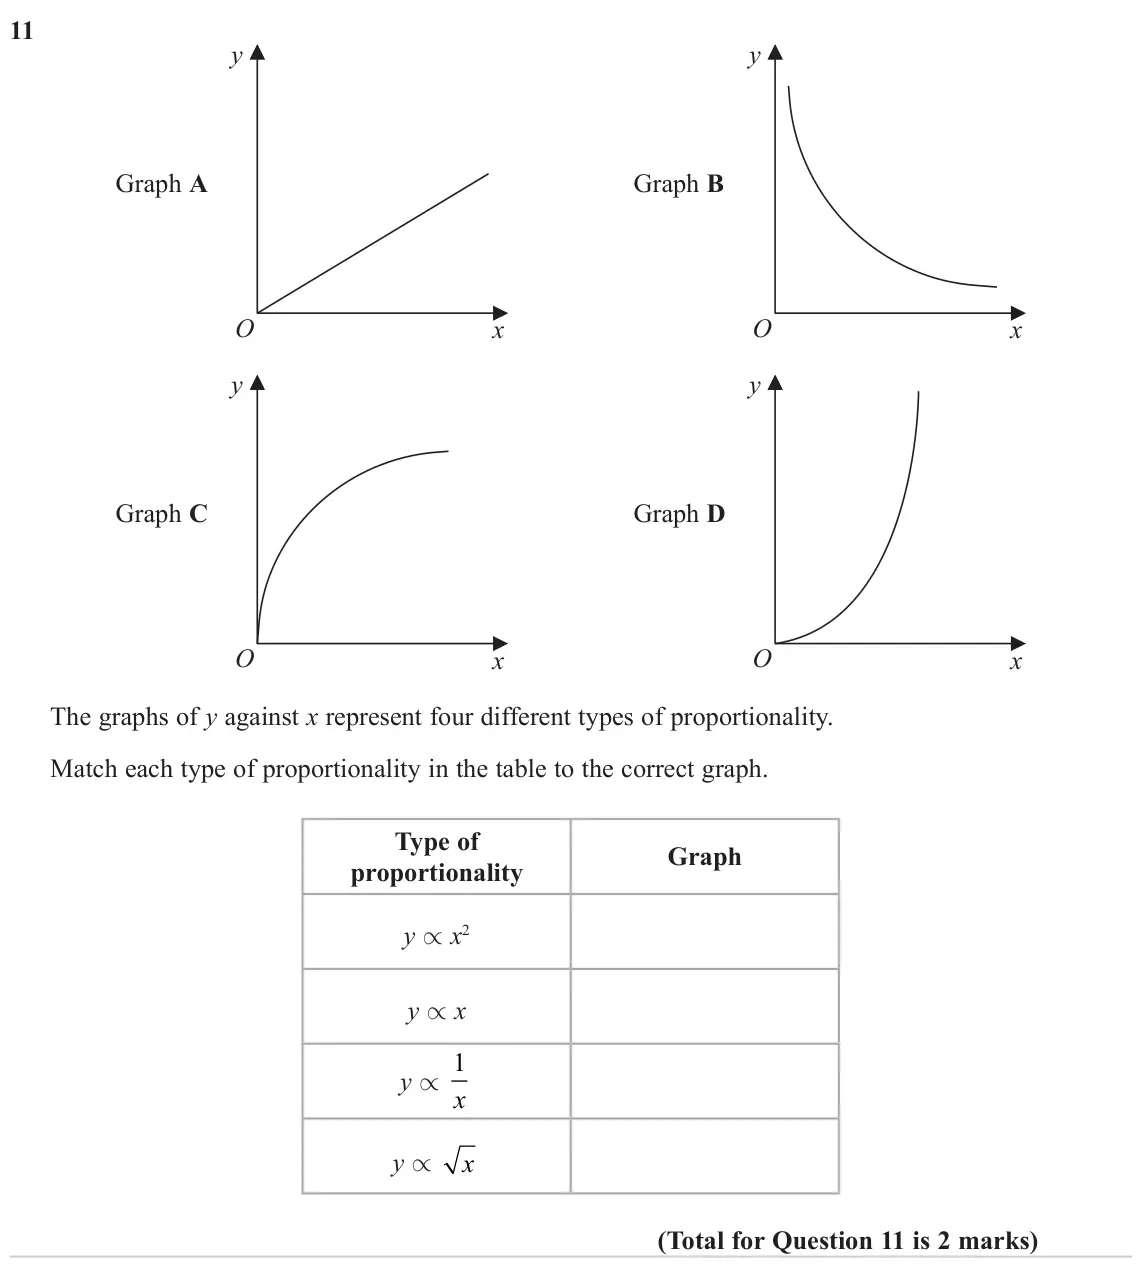
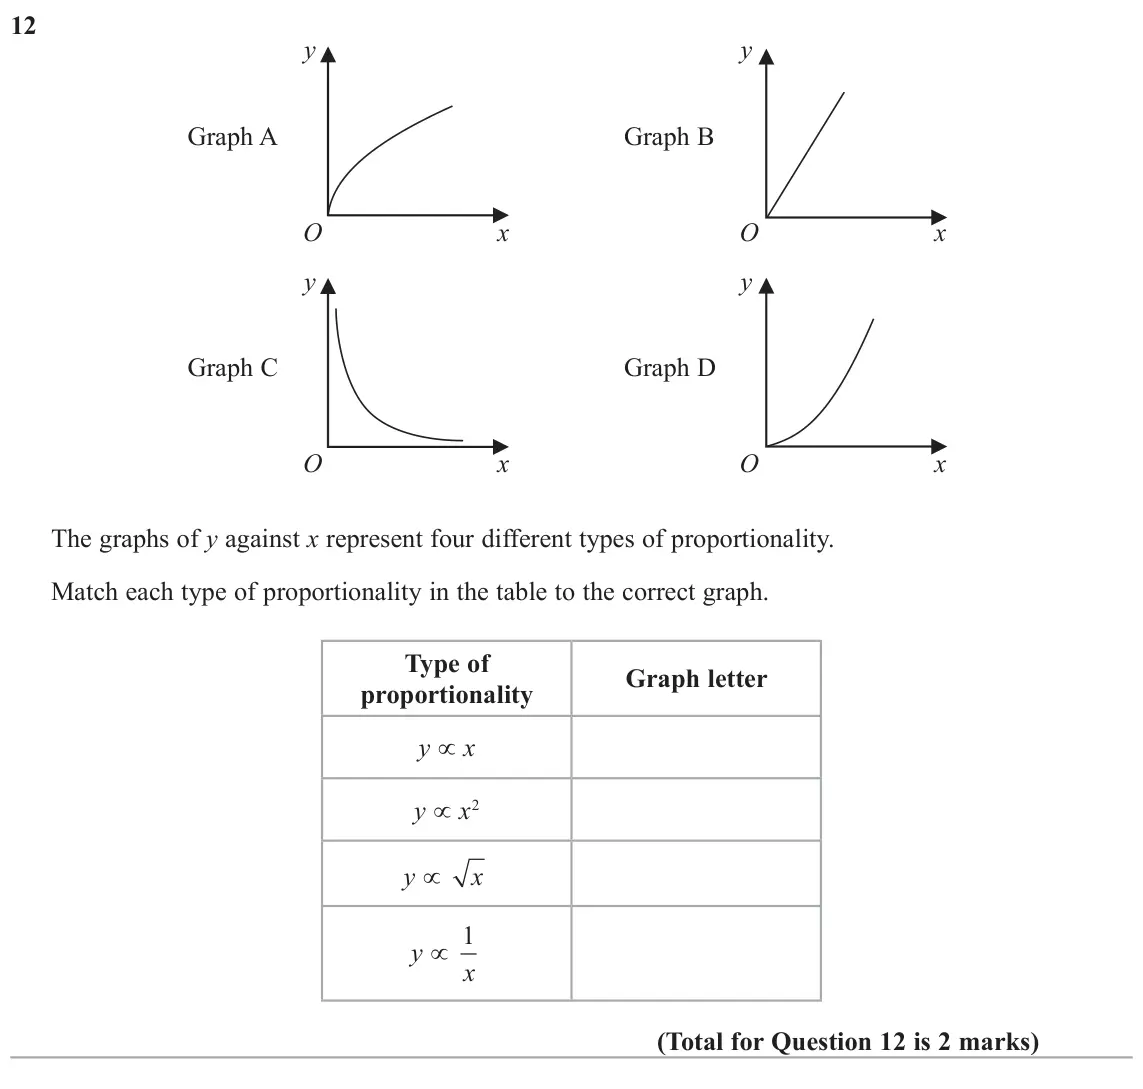
- November 2023, Paper 2H, Q11 (2 marks): y y Graph A Graph B O O x x y y Graph C Graph D O O x x The graphs of y against x represent four different types of proportionality. Match each type of proporti
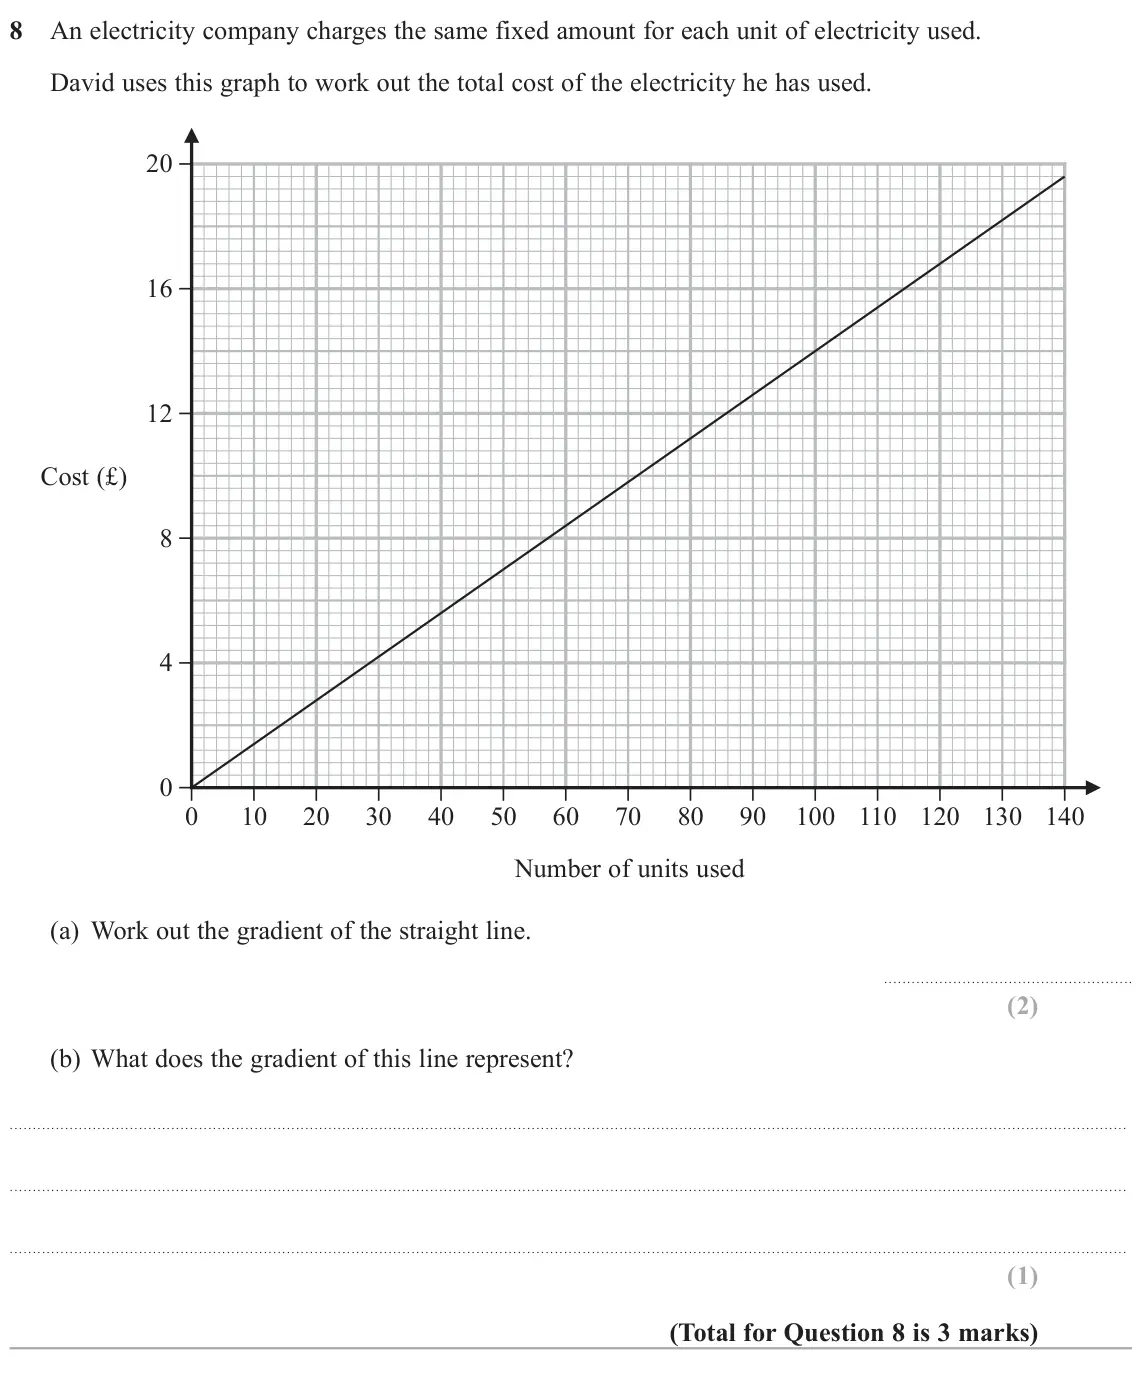
- June 2022, Paper 3H, Q8 (3 marks): An electricity company charges the same fixed amount for each unit of electricity used. David uses this graph to work out the total cost of the electricity he h
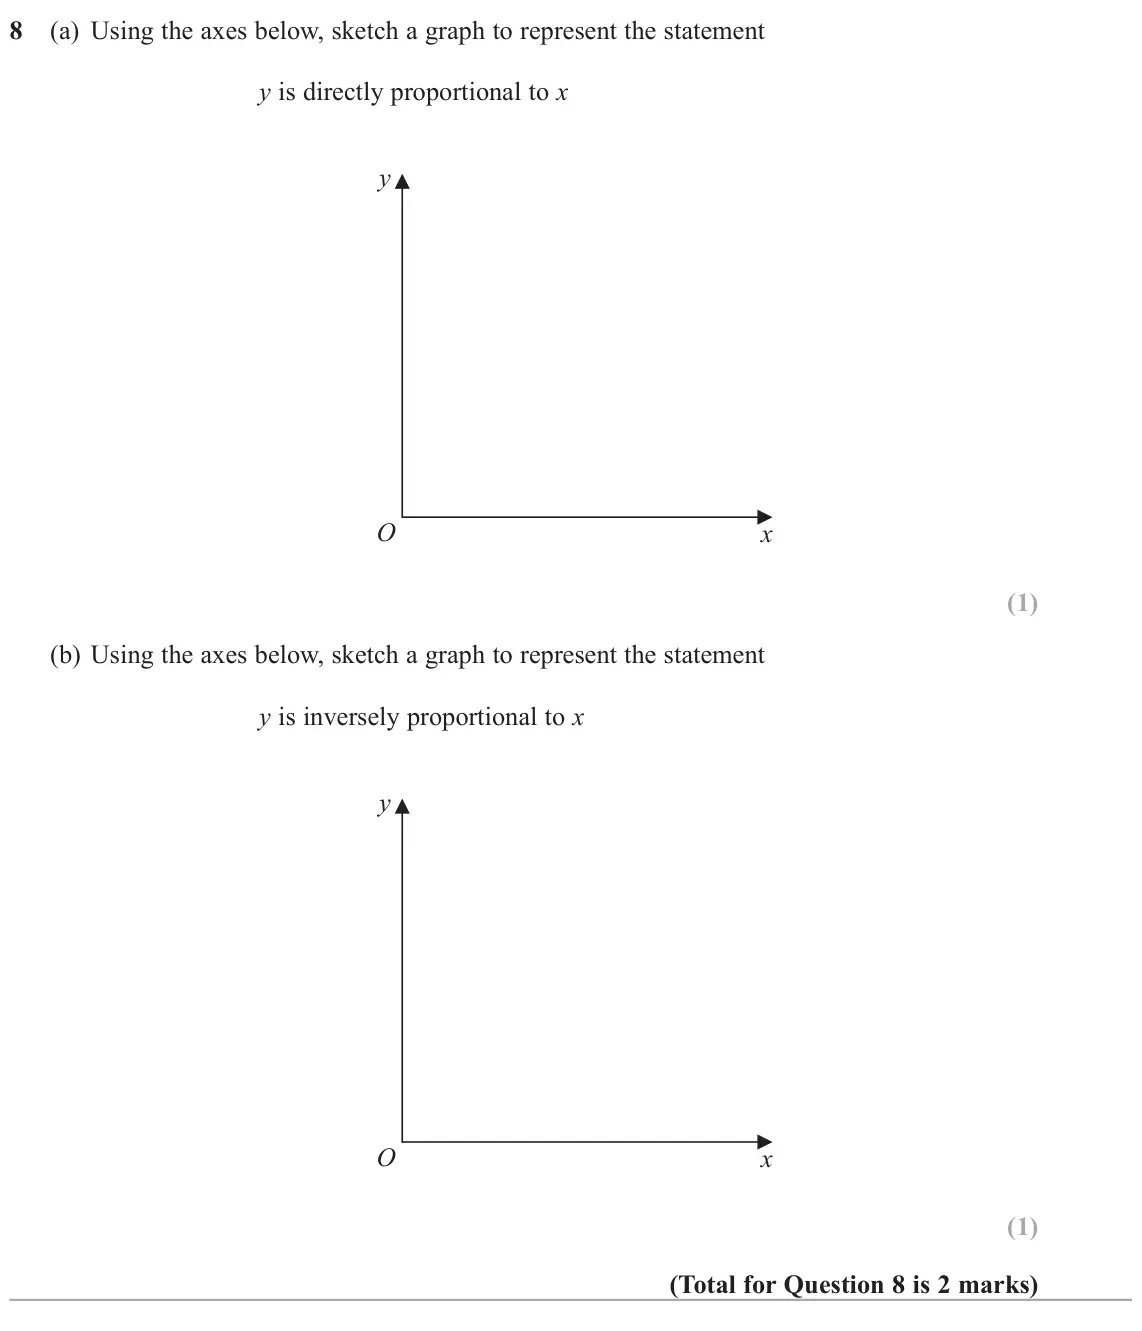
- November 2021, Paper 3H, Q8 (2 marks): (a) Using the axes below, sketch a graph to represent the statement y is directly proportional to x y O x (b) Using the axes below, sketch a graph to represent
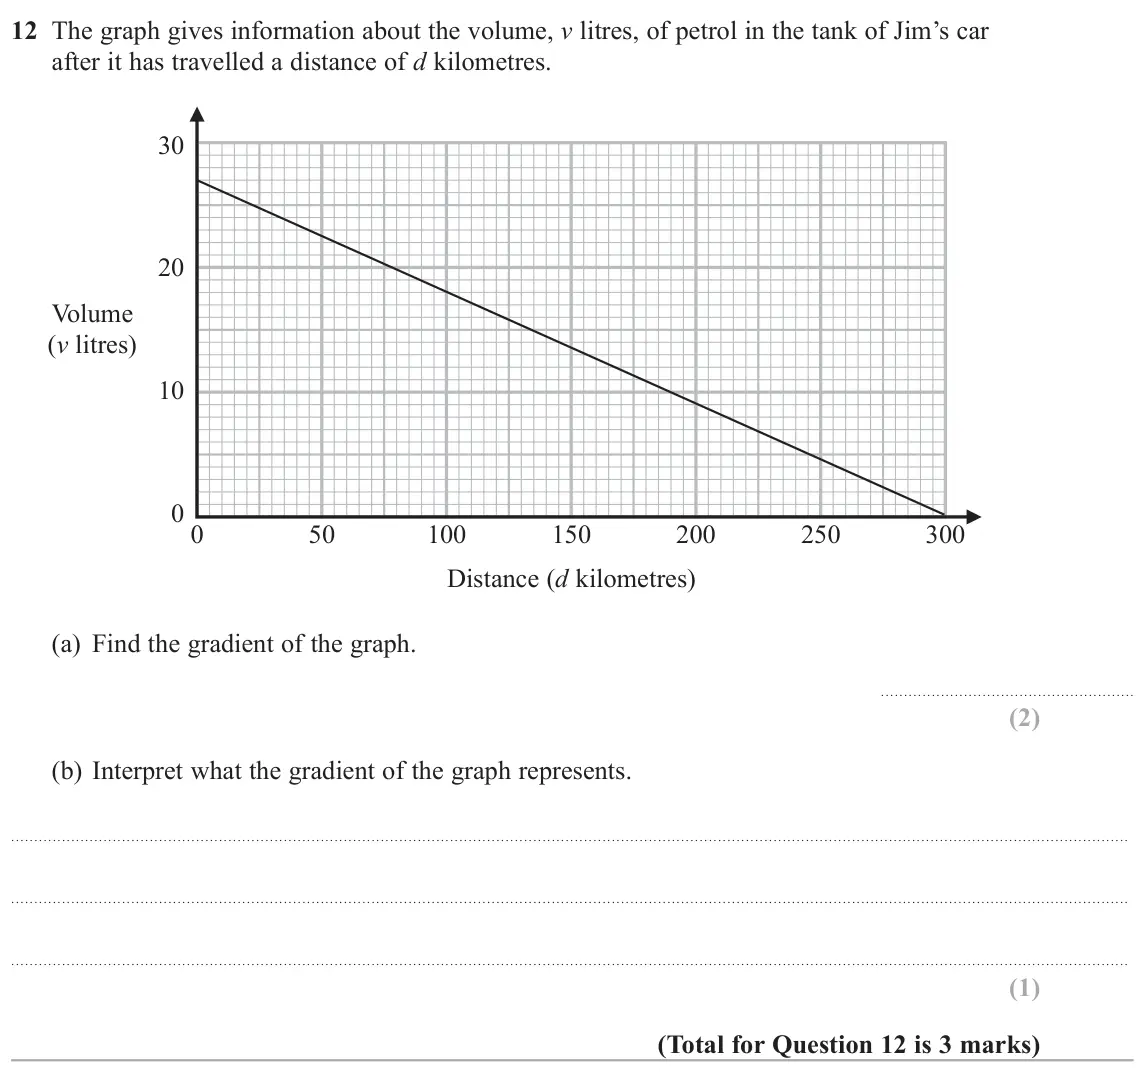
- November 2020, Paper 2H, Q12 (3 marks): The graph gives information about the volume, v litres, of petrol in the tank of Jim’s car after it has travelled a distance of d kilometres. 30 20 Volume (v li
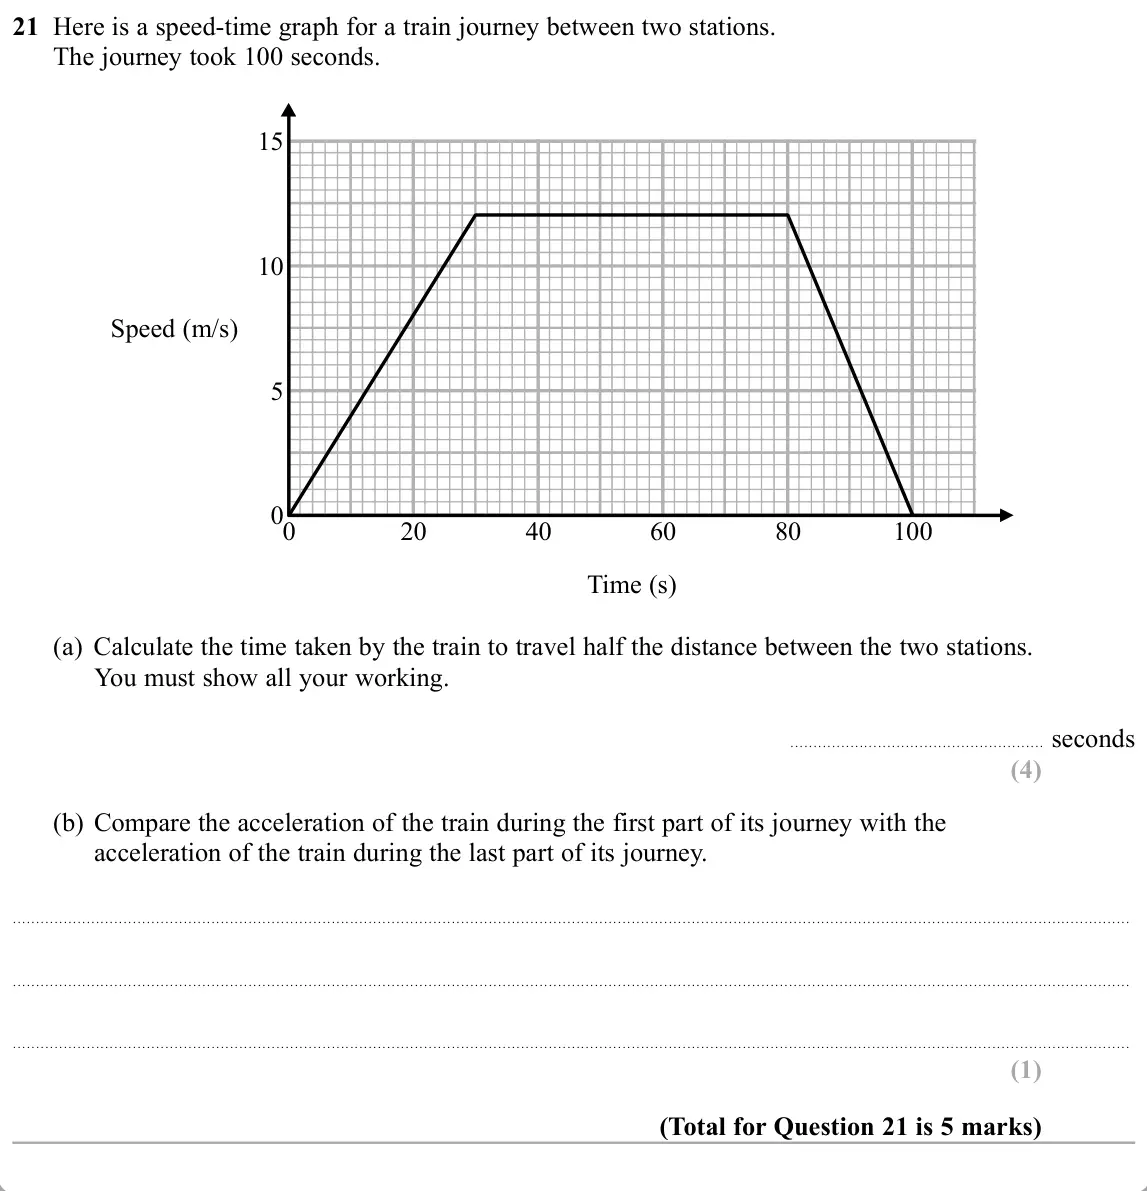
- November 2019, Paper 2H, Q21 (5 marks): Here is a speed-time graph for a train journey between two stations. The journey took 100 seconds. 15 10 Speed (m/s) 5 0 0 20 40 60 80 100 Time (s) (a) Calculat
- June 2018, Paper 2H, Q12 (2 marks): y y Graph A Graph B O x O x y y Graph C Graph D O x O x The graphs of y against x represent four different types of proportionality. Match each type of proporti
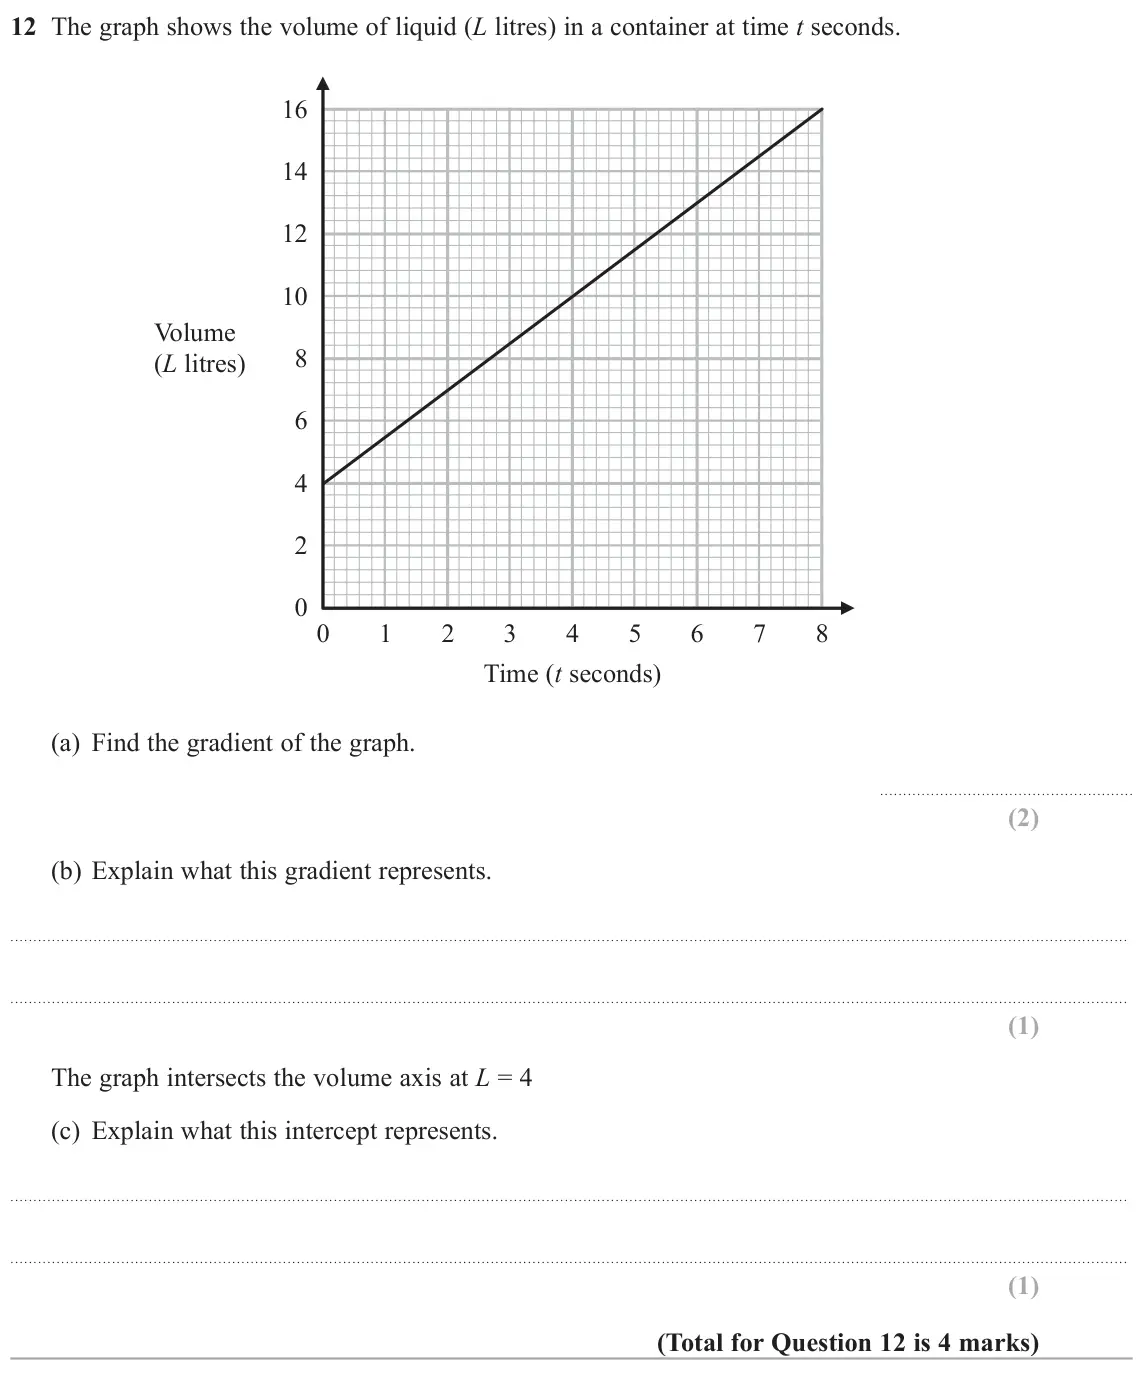
- June 2018, Paper 3H, Q12 (4 marks): The graph shows the volume of liquid (L litres) in a container at time t seconds. 16 14 12 10 Volume 8 (L litres) 6 4 2 0 0 1 2 3 4 5 6 7 8 Time (t seconds) (a)
Questions, mark schemes and examiner’s reports are © Pearson Edexcel, from their published past papers. Plumi isn’t affiliated with any exam board. Want whole papers? Every Edexcel GCSE Maths paper.
Rather write your answers by hand on iPad? Plumi marks them against the same mark schemes.