 plumi
Investigating river landscapes: Edexcel GCSE Geography A questions
Edexcel GCSE Geography A past-paper questions on Investigating river landscapes, 2018–2025, with mark schemes and examiner’s reports where available.
Paper
All papers
Exam
All years
Calculations
Loading the full question list…
Q1(a)
The whole paper ↗ (Total for Question 1 is 1 mark)
Q1(b)
The whole paper ↗(Total for Question 1 is 1 mark)
Q1(c)(i)
The whole paper ↗(Total for Question 1 is 2 marks)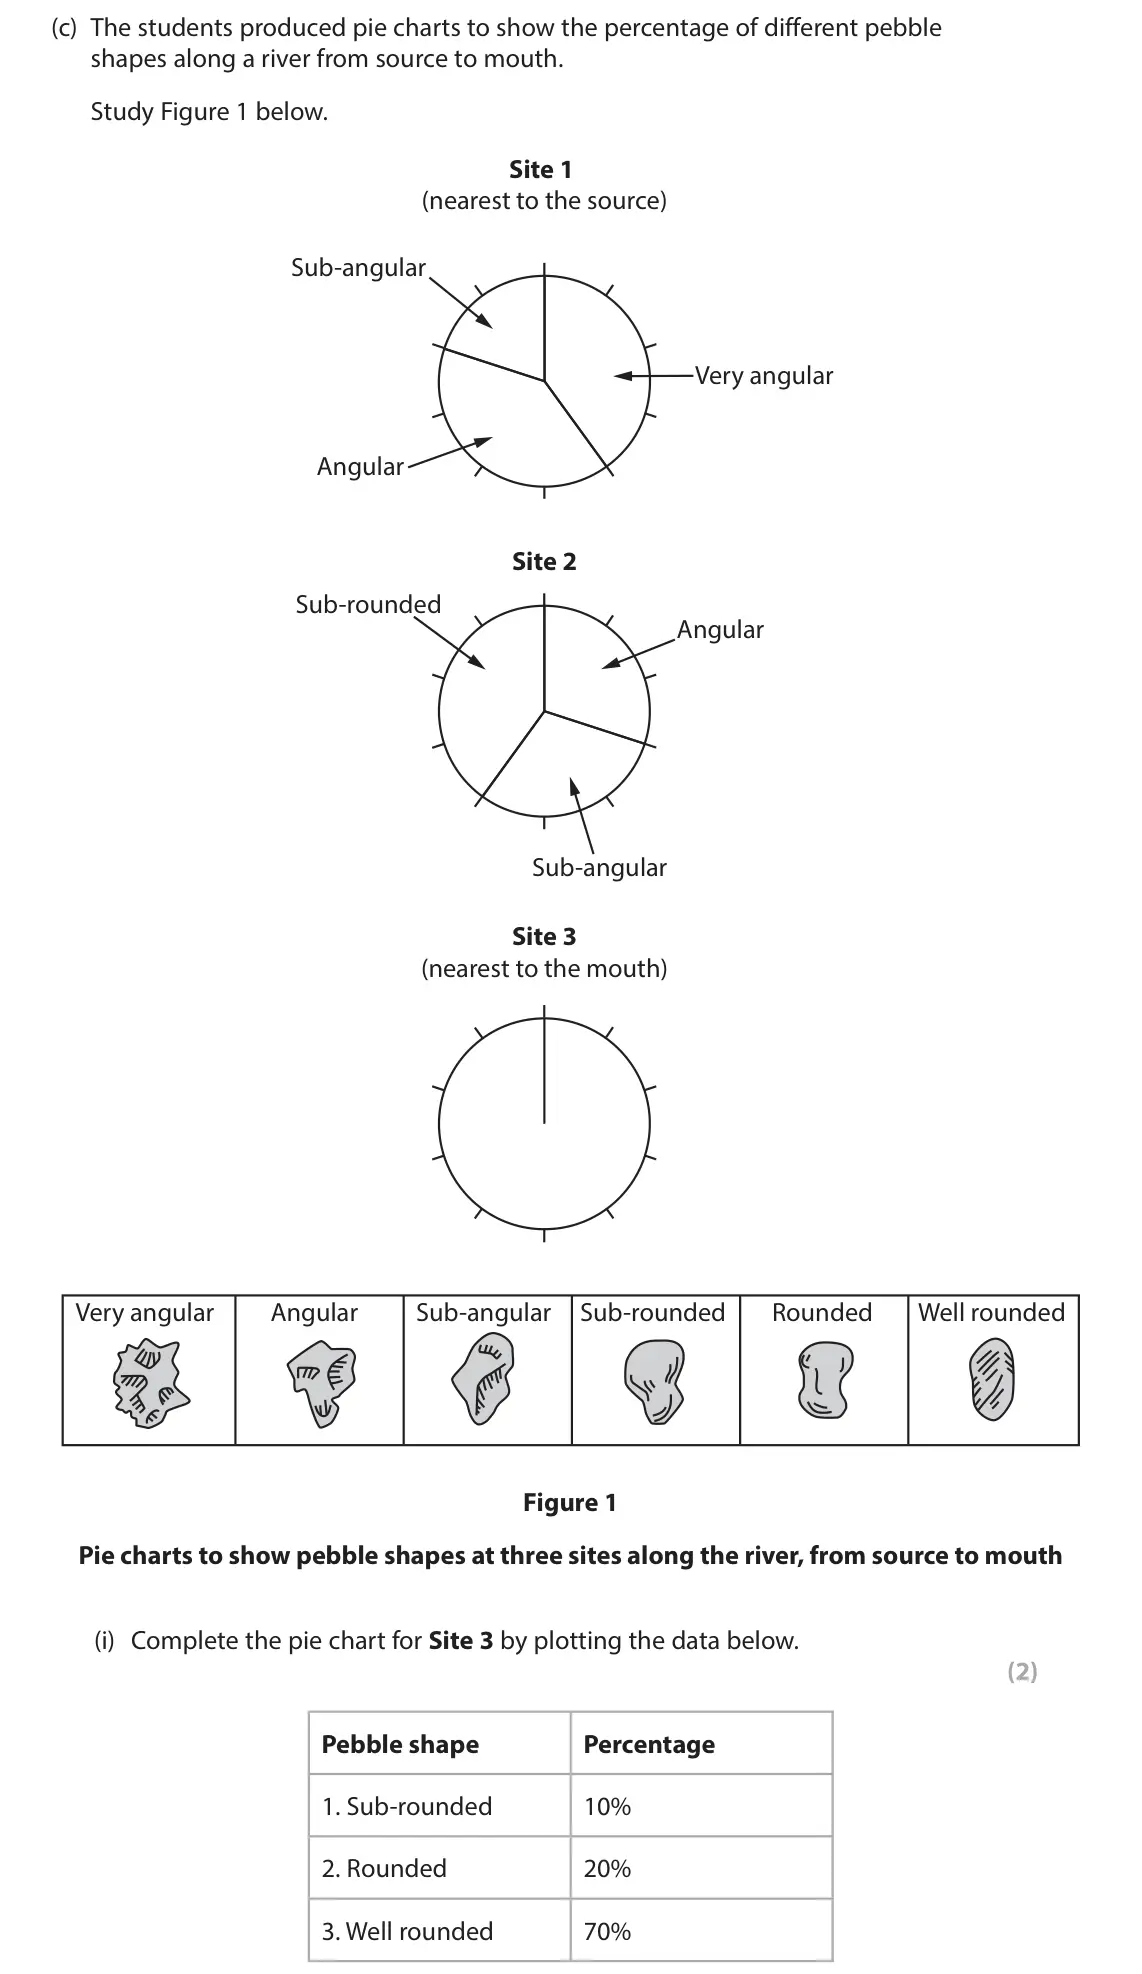
Q1(c)(ii)
The whole paper ↗(Total for Question 1 is 2 marks)
Q1(d)(i)
The whole paper ↗(Total for Question 1 is 2 marks)
Q1(d)(ii)
The whole paper ↗(Total for Question 1 is 2 marks)
Q1(e)
The whole paper ↗(Total for Question 1 is 8 marks)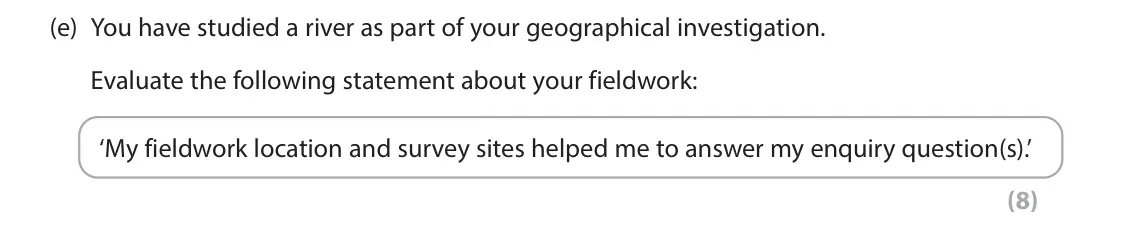
Q1(a)(i)
The whole paper ↗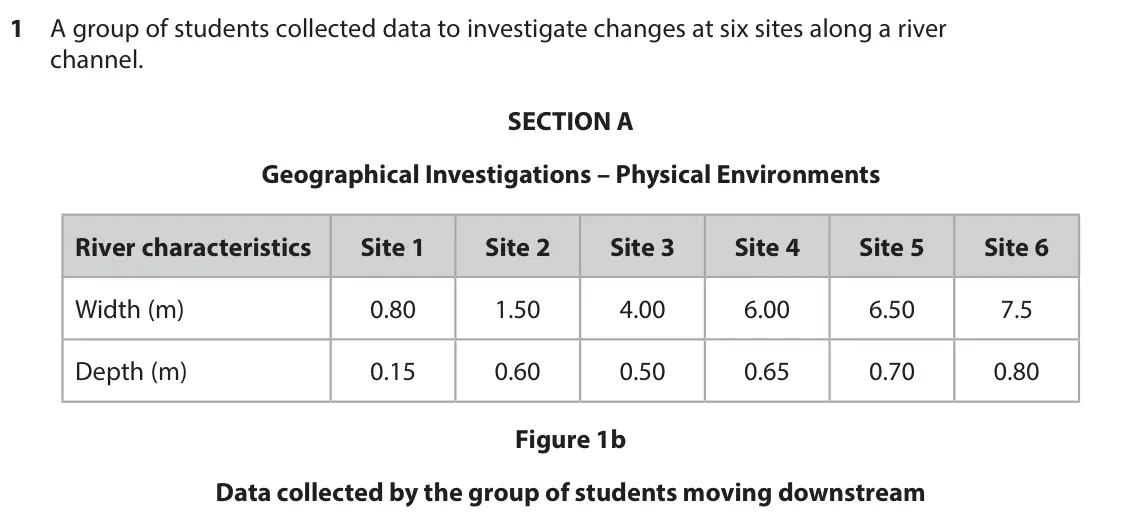 (Total for Question 1 is 2 marks)

Q1(a)(ii)
The whole paper ↗(Total for Question 1 is 2 marks)
Q1(b)(i)
The whole paper ↗(Total for Question 1 is 2 marks)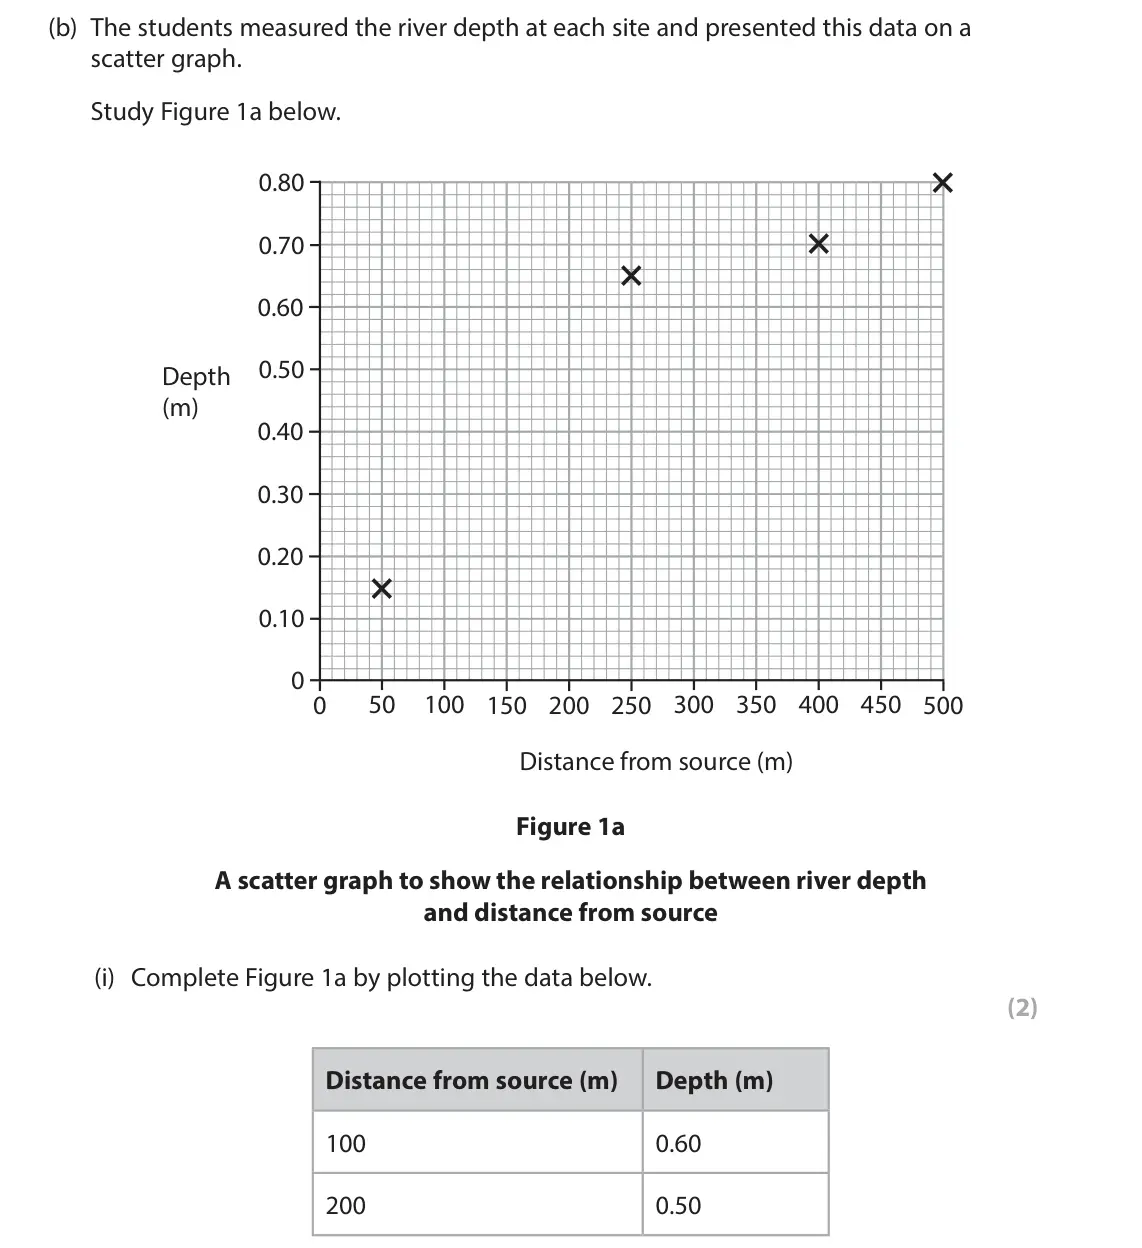
Q1(b)(ii)
The whole paper ↗(Total for Question 1 is 2 marks)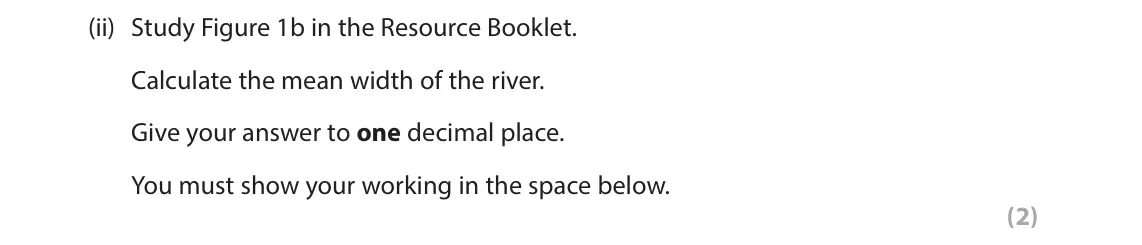
Q1(b)(iii)
The whole paper ↗(Total for Question 1 is 2 marks)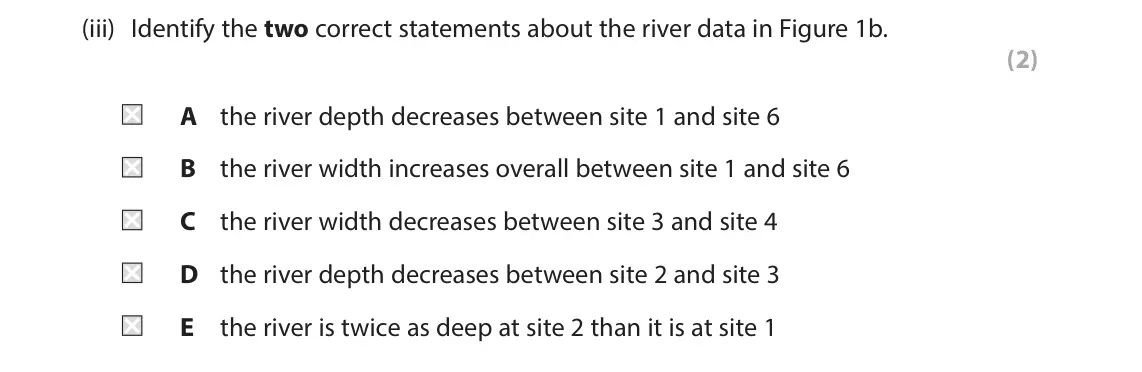
Q1(c)
The whole paper ↗(Total for Question 1 is 8 marks)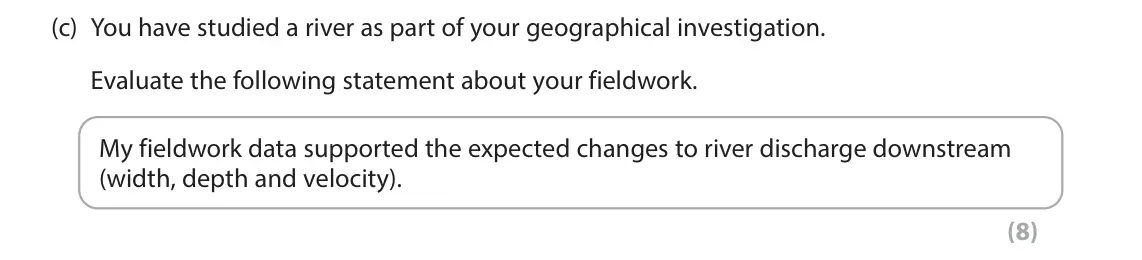
Q1(a)
The whole paper ↗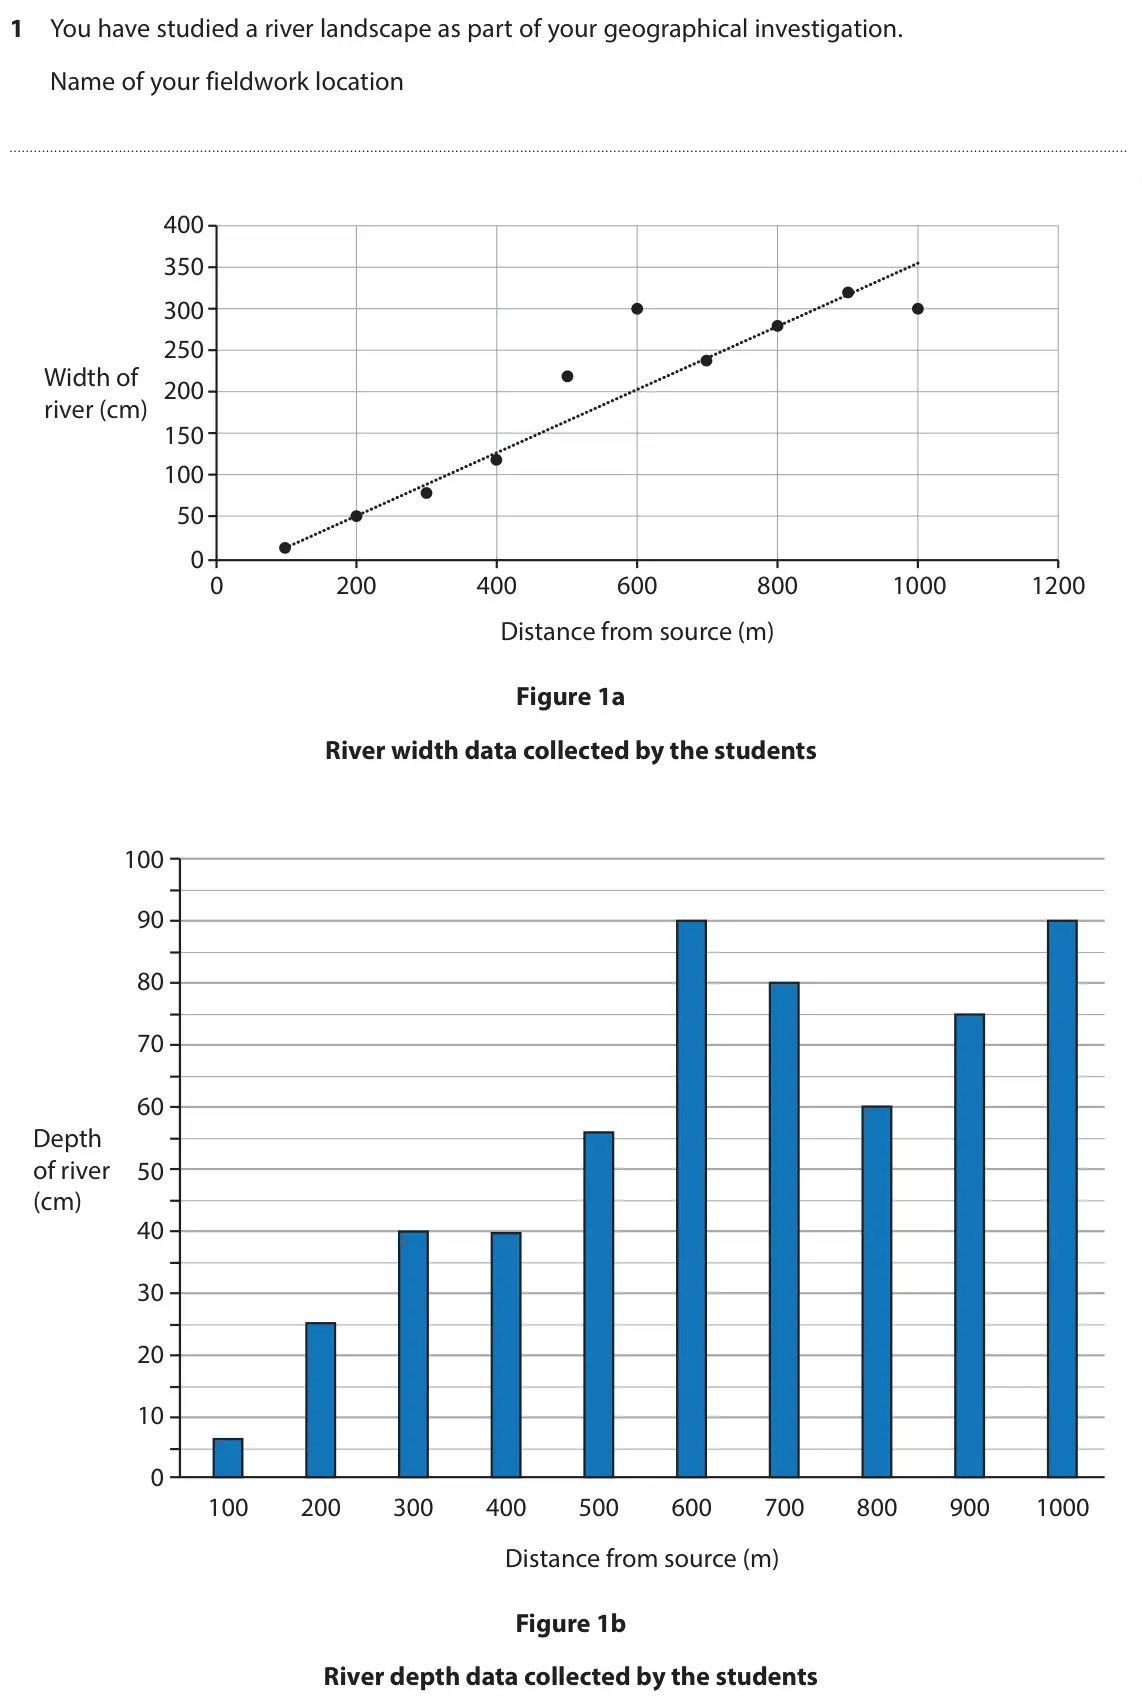 (Total for Question 1 is 2 marks)

Q1(b)
The whole paper ↗(Total for Question 1 is 2 marks)
Q1(c)
The whole paper ↗(Total for Question 1 is 2 marks)
Q1(d)
The whole paper ↗(Total for Question 1 is 4 marks)
Q1(e)
The whole paper ↗(Total for Question 1 is 8 marks)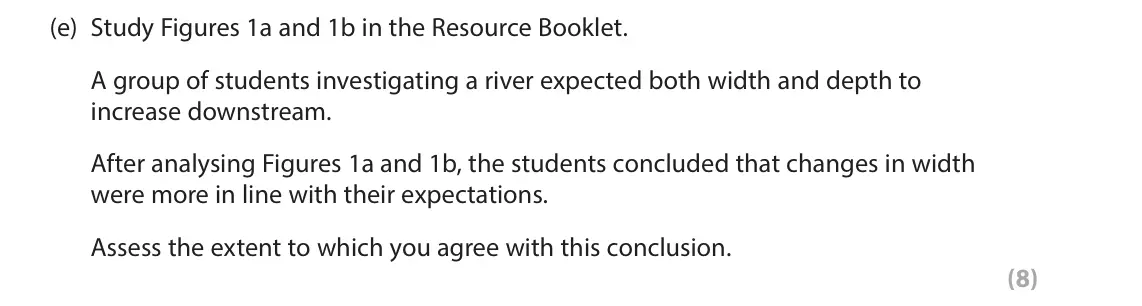
Q1(a)
The whole paper ↗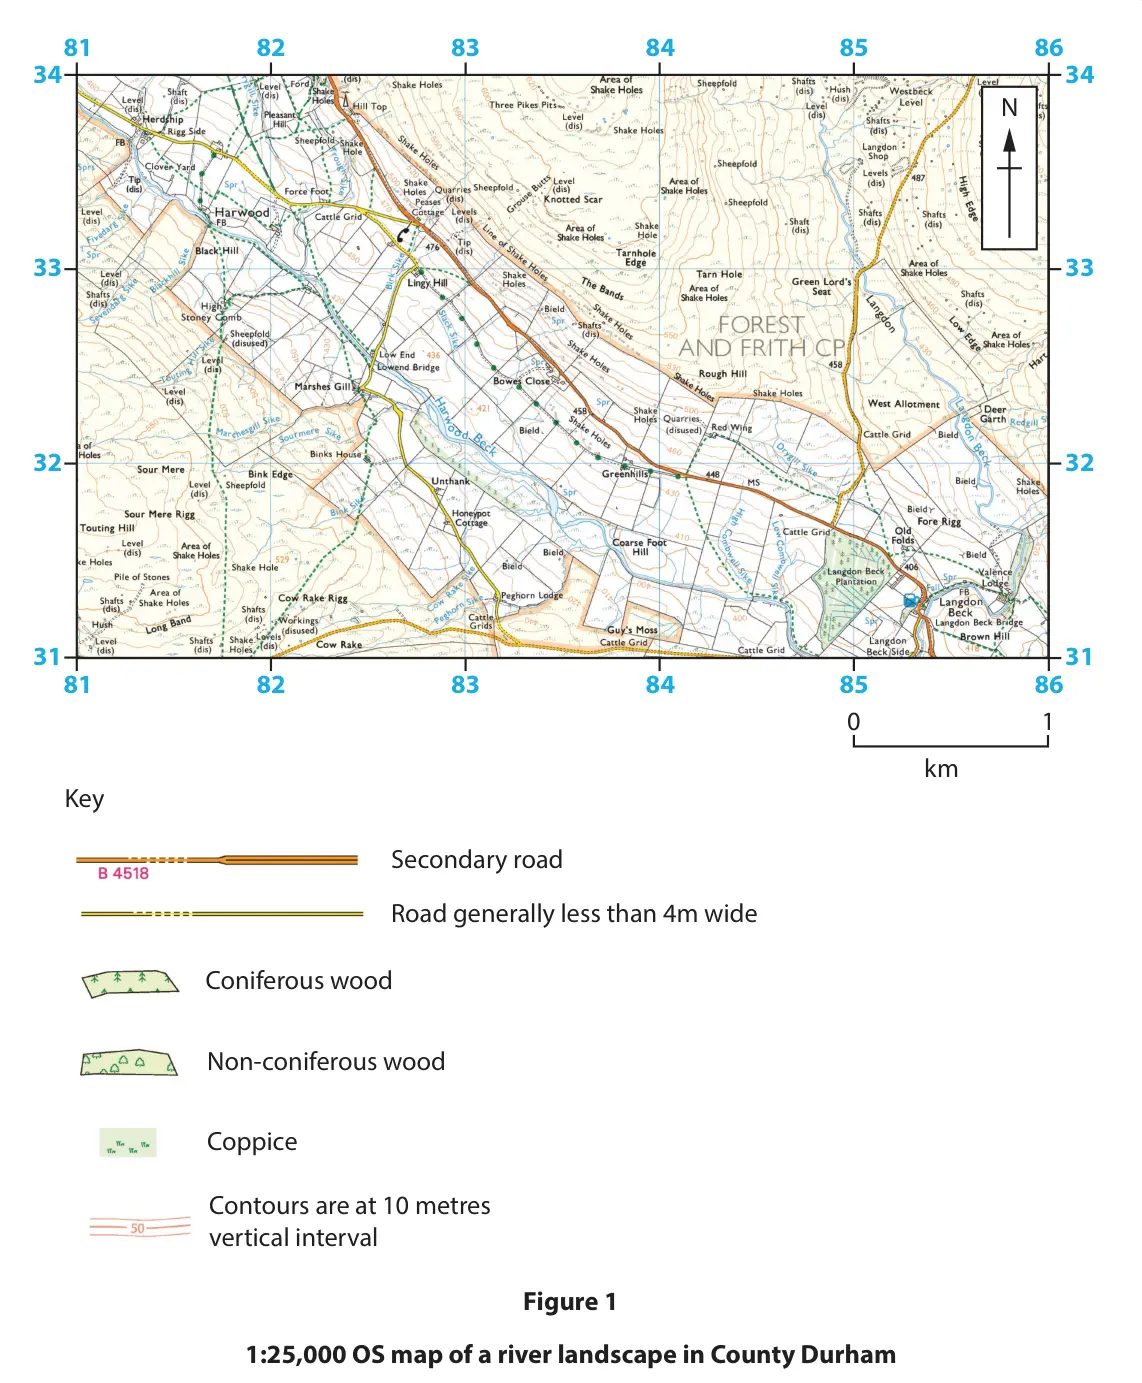 (Total for Question 1 is 2 marks)

Q1(b)
The whole paper ↗(Total for Question 1 is 8 marks)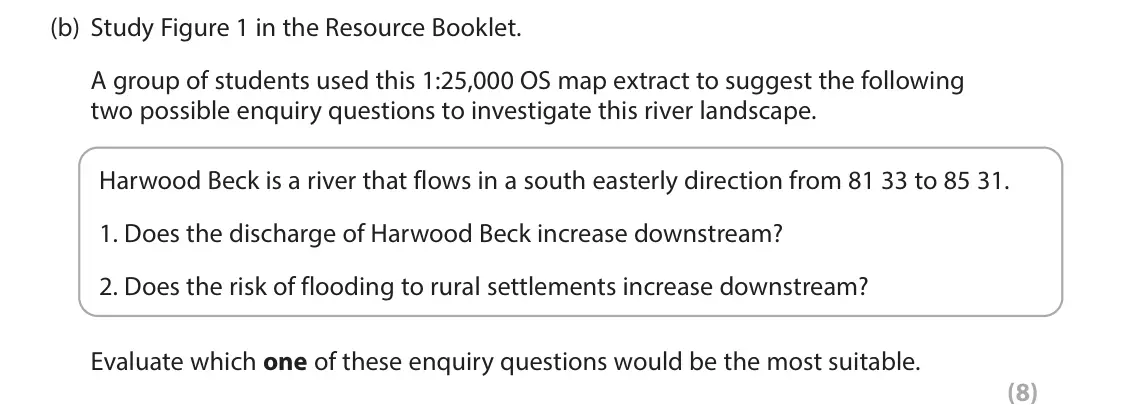
All 40 questions on Investigating river landscapes, as a list
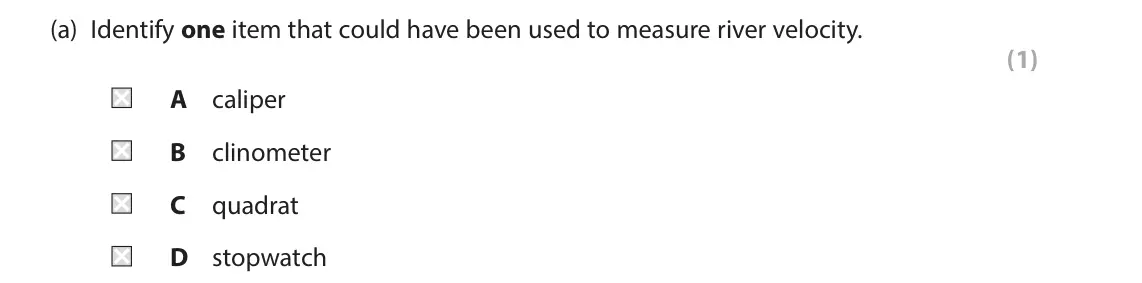
- June 2025, Paper 3, Q1(a) (1 mark): Identify one item that could have been used to measure river velocity. (1) A caliper B clinometer C quadrat D stopwatch 1 A group of students collected data to
- June 2025, Paper 3, Q1(b) (1 mark): Name the correct unit of measurement for river velocity. (1) 1 A group of students collected data to investigate changes along a section of a river channel. The
- June 2025, Paper 3, Q1(c)(i) (2 marks): Complete the pie chart for Site 3 by plotting the data below. (2) Pebble shape Percentage 1. Sub-rounded 10% 2. Rounded 20% 3. Well rounded 70% 1 A group of stu
- June 2025, Paper 3, Q1(c)(ii) (2 marks): Suggest one conclusion the students could make about the changes in pebble shape shown on Figure 1. (2) 1 A group of students collected data to investigate chan
- June 2025, Paper 3, Q1(d)(i) (2 marks): Describe one fieldwork method that could have been used by the students to measure river width. (2) 1 A group of students collected data to investigate changes
- June 2025, Paper 3, Q1(d)(ii) (2 marks): Suggest one way this method to measure river width might not have been accurate. (2) 1 A group of students collected data to investigate changes along a section
- June 2025, Paper 3, Q1(e) (8 marks): You have studied a river as part of your geographical investigation. Evaluate the following statement about your fieldwork: ‘My fieldwork location and survey si
- June 2024, Paper 3, Q1(a)(i) (2 marks): Describe one fieldwork method that could have been used by the students to measure river depth. (2) 1 A group of students collected data to investigate changes
- June 2024, Paper 3, Q1(a)(ii) (2 marks): Explain one disadvantage of using this fieldwork method. (2) 1 A group of students collected data to investigate changes at six sites along a river channel. SEC
- June 2024, Paper 3, Q1(b)(i) (2 marks): Complete Figure 1a by plotting the data below. (2) Distance from source (m) Depth (m) 100 0.60 200 0.50 1 A group of students collected data to investigate chan
- June 2024, Paper 3, Q1(b)(ii) (2 marks): Study Figure 1b in the Resource Booklet. Calculate the mean width of the river. Give your answer to one decimal place. You must show your working in the space b
- June 2024, Paper 3, Q1(b)(iii) (2 marks): Identify the two correct statements about the river data in Figure 1b. (2) A the river depth decreases between site 1 and site 6 B the river width increases ove
- June 2024, Paper 3, Q1(c) (8 marks): You have studied a river as part of your geographical investigation. Evaluate the following statement about your fieldwork. My fieldwork data supported the expe
- June 2023, Paper 3, Q1(a) (2 marks): Explain one advantage of a sampling strategy you used in your geographical investigation. (2) 1 You have studied a river landscape as part of your geographical
- June 2023, Paper 3, Q1(b) (2 marks): Explain one risk you considered before carrying out the data collection at your chosen location. (2) 1 You have studied a river landscape as part of your geogra
- June 2023, Paper 3, Q1(c) (2 marks): Explain one way your investigation helped you understand how river processes affect people. (2) 1 You have studied a river landscape as part of your geographica
- June 2023, Paper 3, Q1(d) (4 marks): Explain two ways you tried to make sure that your data collection methods were accurate. (4) 1 You have studied a river landscape as part of your geographical i
- June 2023, Paper 3, Q1(e) (8 marks): Study Figures 1a and 1b in the Resource Booklet. A group of students investigating a river expected both width and depth to increase downstream. After analysing
- June 2022, Paper 3, Q1(a) (2 marks): Study Figure 1 in the Resource Booklet. Describe one fieldwork method the students could have used to collect data to investigate this river landscape. (2) 81 8
- June 2022, Paper 3, Q1(b) (8 marks): Study Figure 1 in the Resource Booklet. A group of students used this 1:25,000 OS map extract to suggest the following two possible enquiry questions to investi
- November 2021, Paper 3, Q1(a) (1 mark): Study Figure 1a below. Figure 1a One of the sites chosen by the students State one fieldwork method the students may have used at this site. (1) 1 A group of st
- November 2021, Paper 3, Q1(b)(i) (2 marks): Complete Figure 1b by plotting the data below. (2) Mean velocity (m/s) Cross-sectional area (m2) 0.4 1.4 0.62 2.6 1 A group of students collected data to invest
- November 2021, Paper 3, Q1(b)(ii) (4 marks): Explain two possible reasons for the anomaly shown at X in Figure 1b. (4) 1 A group of students collected data to investigate changes along a river channel.
- November 2021, Paper 3, Q1(b)(iii) (3 marks): Suggest one way students could have used a flood risk map to investigate this river. (3) 1 A group of students collected data to investigate changes along a riv
- November 2020, Paper 3, Q1(a)(i) (2 marks): Describe one fieldwork method that could be used by the students to measure river width. (2) 1 A group of students collected data to investigate changes at five
- November 2020, Paper 3, Q1(a)(ii) (2 marks): Explain one disadvantage of using this data collection method. (2) 1 A group of students collected data to investigate changes at five sites along a river chann
- November 2020, Paper 3, Q1(b)(i) (2 marks): Calculate the mean width of the river. Give your answer to two decimal places. You must show your working in the space below. (2) 1 A group of students collecte
- November 2020, Paper 3, Q1(b)(ii) (2 marks): Explain one conclusion that could be drawn from the data in Figure 1b. (2) 1 A group of students collected data to investigate changes at five sites along a riv
- November 2020, Paper 3, Q1(c) (2 marks): The students measured sediment size at each site and presented data in a bar chart. Study Figure 1c below. 200 180 160 140 120 100 80 60 40 20 0 Site 1 Site 2 S
- November 2020, Paper 3, Q1(d) (8 marks): You have studied a river as part of your geographical investigation. Evaluate the effectiveness of the different techniques used to present your fieldwork data.
- June 2019, Paper 3, Q1(a)(i) (2 marks): Explain one advantage of a qualitative fieldwork method you used. Named qualitative fieldwork method (2) What was measured? How was it measured? What were the p
- June 2019, Paper 3, Q1(a)(ii) (3 marks): Explain one way the secondary data you collected supported your investigation. (3) What was measured? How was it measured? What were the problems? Depth We reco
- June 2019, Paper 3, Q1(a)(iii) (2 marks): Explain one advantage of the type of graph you used to present fieldwork data. Type of graph (2) What was measured? How was it measured? What were the problems?
- June 2019, Paper 3, Q1(a)(iv) (3 marks): You developed at least one question or hypothesis to help you investigate a river you have studied. Explain how this question or hypothesis helped your investig
- June 2019, Paper 3, Q1(b) (8 marks): Evaluate the accuracy and reliability of the fieldwork methods shown in Figure 1. (8) What was measured? How was it measured? What were the problems? Depth We r
- June 2018, Paper 3, Q1(a)(i) (2 marks): Explain one limitation of the quantitative fieldwork method you used when investigating river discharge. (2) SECTION A Site 1 nearest source 1 Direction Width (
- June 2018, Paper 3, Q1(a)(ii) (2 marks): Explain one way you could have improved the quantitative fieldwork method. (2) SECTION A Site 1 nearest source 1 Direction Width (cm) 2 of f low 0 50 100 150 20
- June 2018, Paper 3, Q1(b) (3 marks): Explain one way the qualitative fieldwork method you used supported your understanding of river landforms. (3) SECTION A Site 1 nearest source 1 Direction Width
- June 2018, Paper 3, Q1(c) (3 marks): Explain one way river processes might affect people living in the catchment area of the river you studied. (3) SECTION A Site 1 nearest source 1 Direction Width
- June 2018, Paper 3, Q1(d) (8 marks): Study Figure 1a and Figure 1b in the Resource Booklet. Using both Figure 1a and Figure 1b, assess the possible conclusions that might be drawn from this river i
Questions, mark schemes and examiner’s reports are © Pearson Edexcel, from their published past papers. Plumi isn’t affiliated with any exam board. Want whole papers? Edexcel GCSE Geography A past papers.
The Plumi iPad app also offers exam-style questions with AI feedback on your handwritten working.