 plumi
Investigating central/inner urban areas: Edexcel GCSE Geography A questions
Edexcel GCSE Geography A past-paper questions on Investigating central/inner urban areas, 2018–2025, with mark schemes and examiner’s reports where available.
Paper
All papers
Exam
All years
Calculations
Loading the full question list…
Q3(a)(i)
The whole paper ↗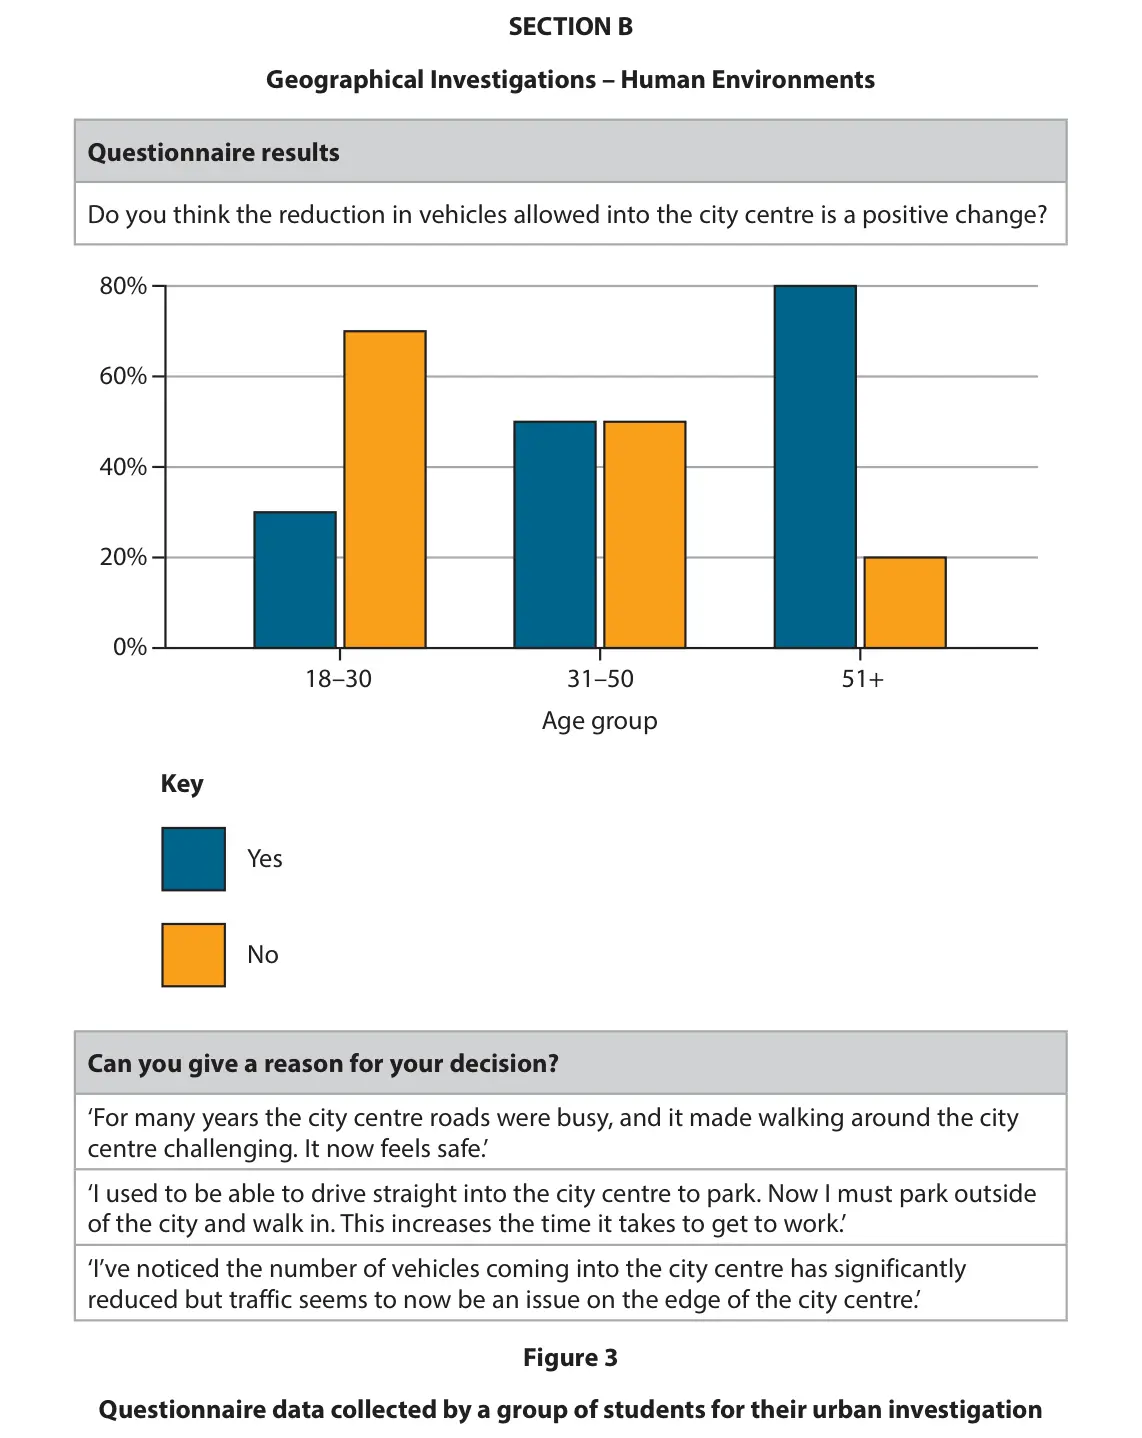 (Total for Question 3 is 1 mark)

Q3(a)(ii)
The whole paper ↗(Total for Question 3 is 2 marks)
Q3(b)
The whole paper ↗(Total for Question 3 is 2 marks)
Q3(c)
The whole paper ↗(Total for Question 3 is 2 marks)
Q3(d)
The whole paper ↗(Total for Question 3 is 3 marks)
Q3(e)
The whole paper ↗(Total for Question 3 is 8 marks)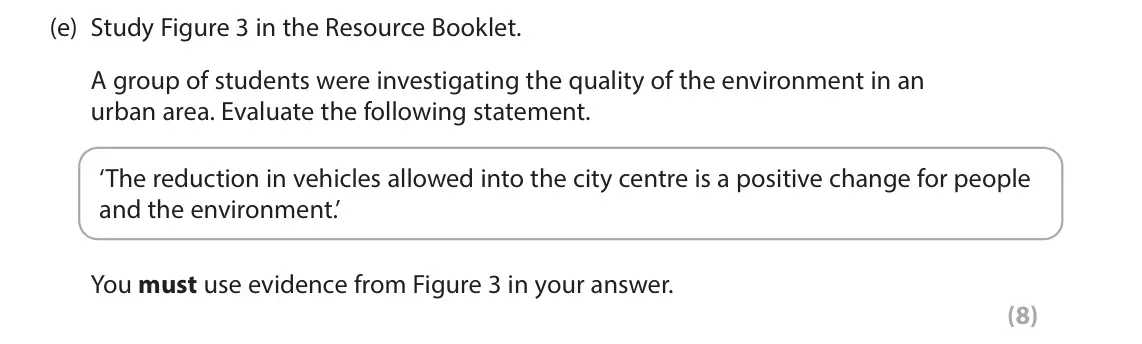
Q3(a)
The whole paper ↗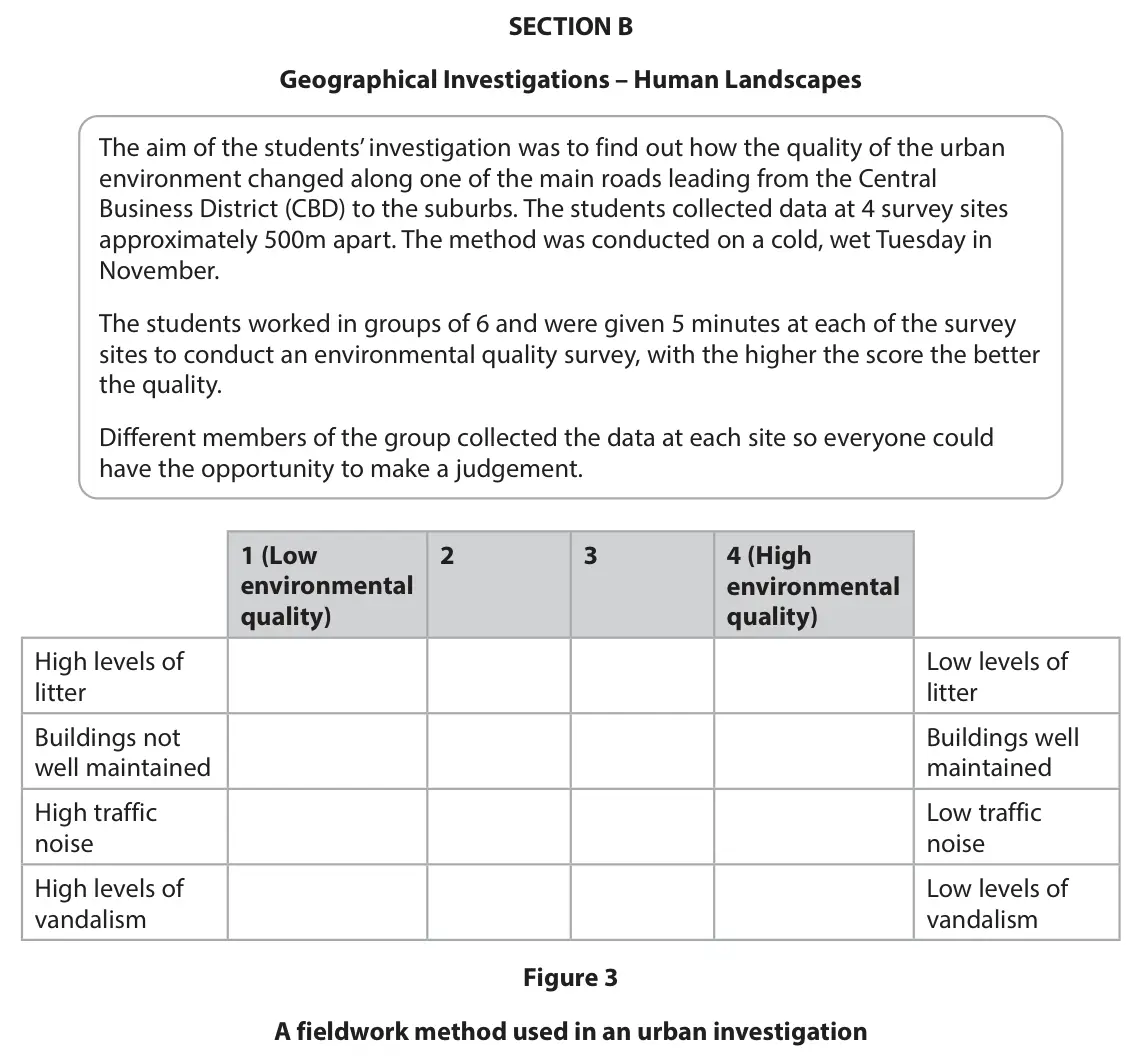 (Total for Question 3 is 4 marks)

Q3(b)
The whole paper ↗(Total for Question 3 is 2 marks)
Q3(c)
The whole paper ↗(Total for Question 3 is 2 marks)
Q3(d)
The whole paper ↗(Total for Question 3 is 2 marks)
Q3(e)
The whole paper ↗(Total for Question 3 is 8 marks)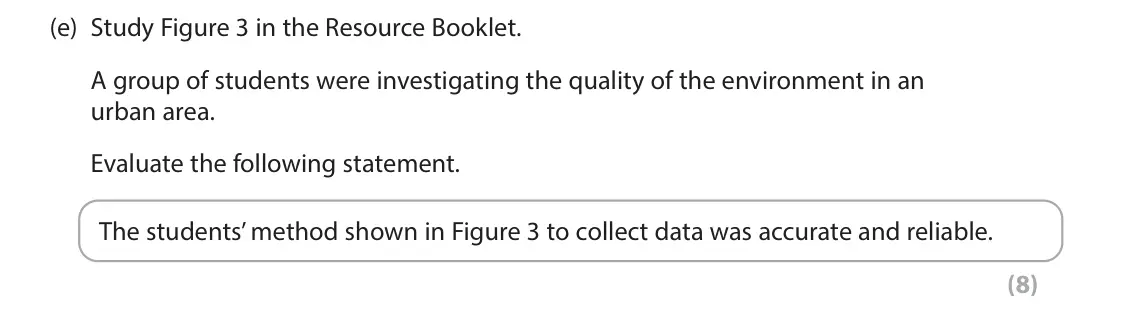
Q3(a)(i)
The whole paper ↗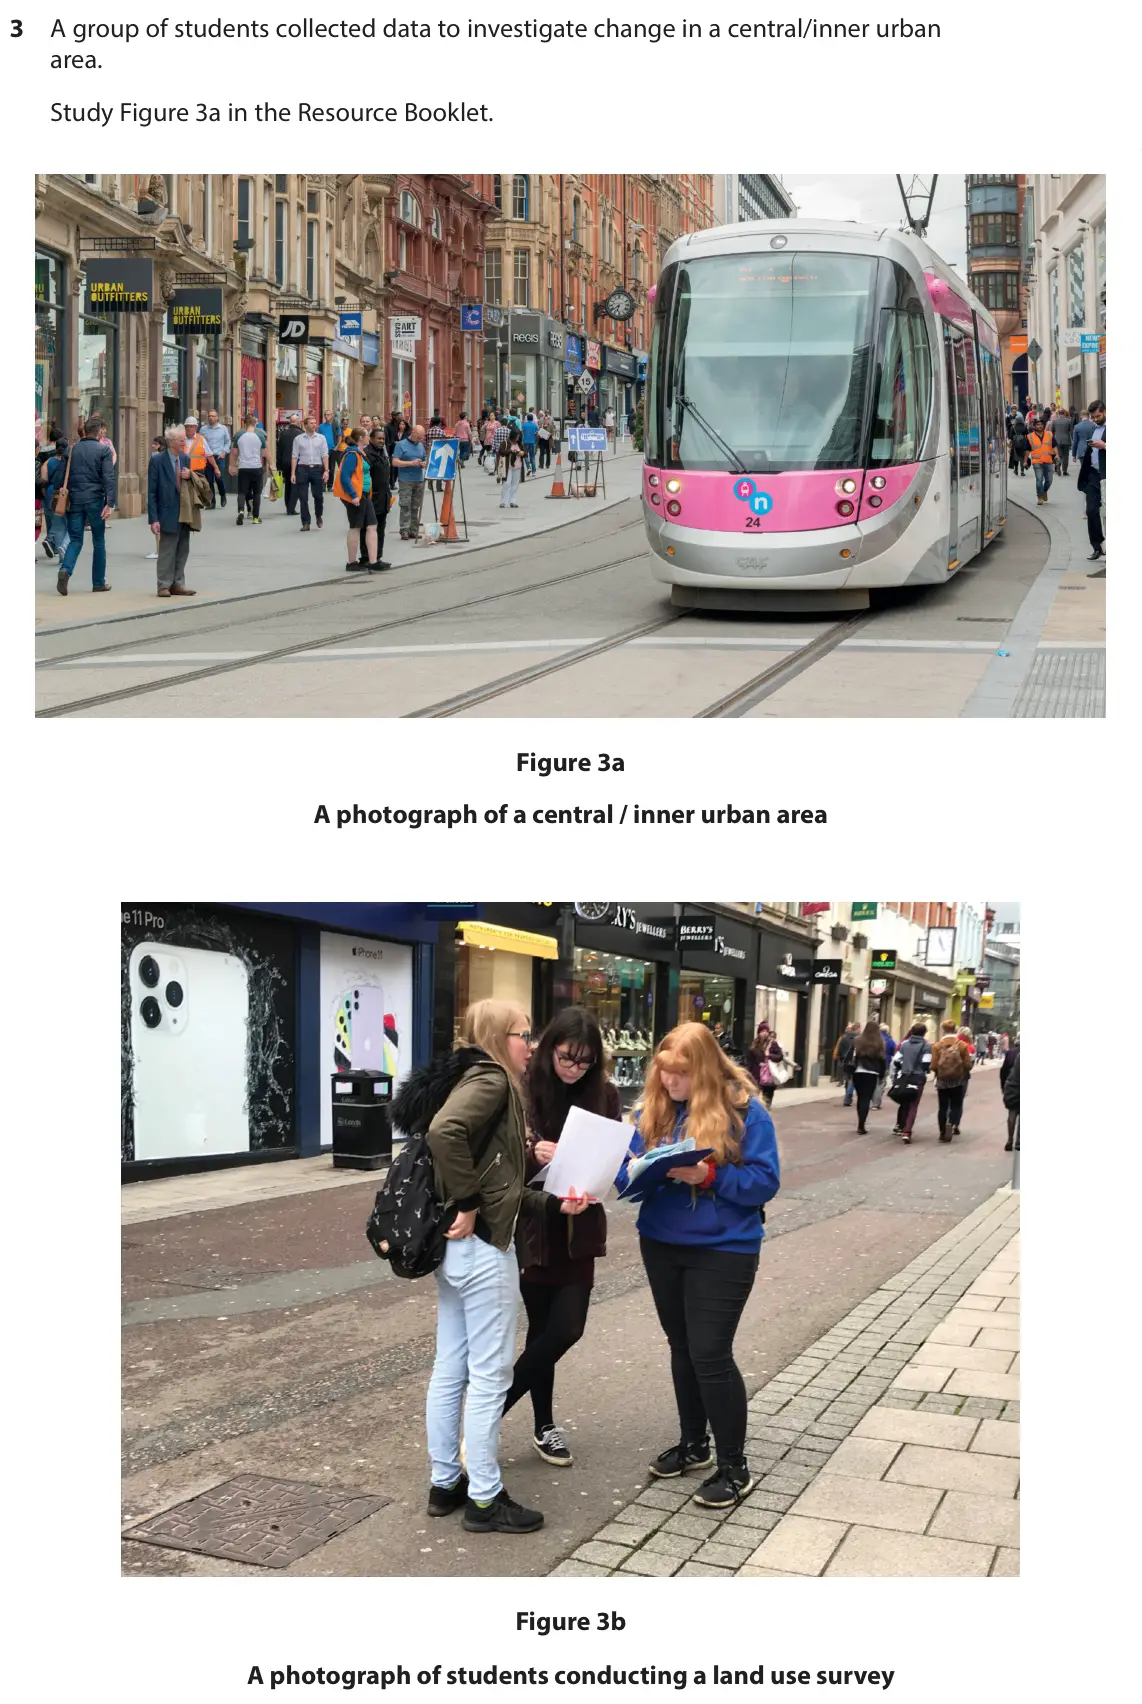 (Total for Question 3 is 2 marks)
Q3(a)(ii)
The whole paper ↗(Total for Question 3 is 2 marks)
Q3(b)
The whole paper ↗(Total for Question 3 is 2 marks)
Q3(c)
The whole paper ↗(Total for Question 3 is 2 marks)
Q3(d)
The whole paper ↗(Total for Question 3 is 2 marks)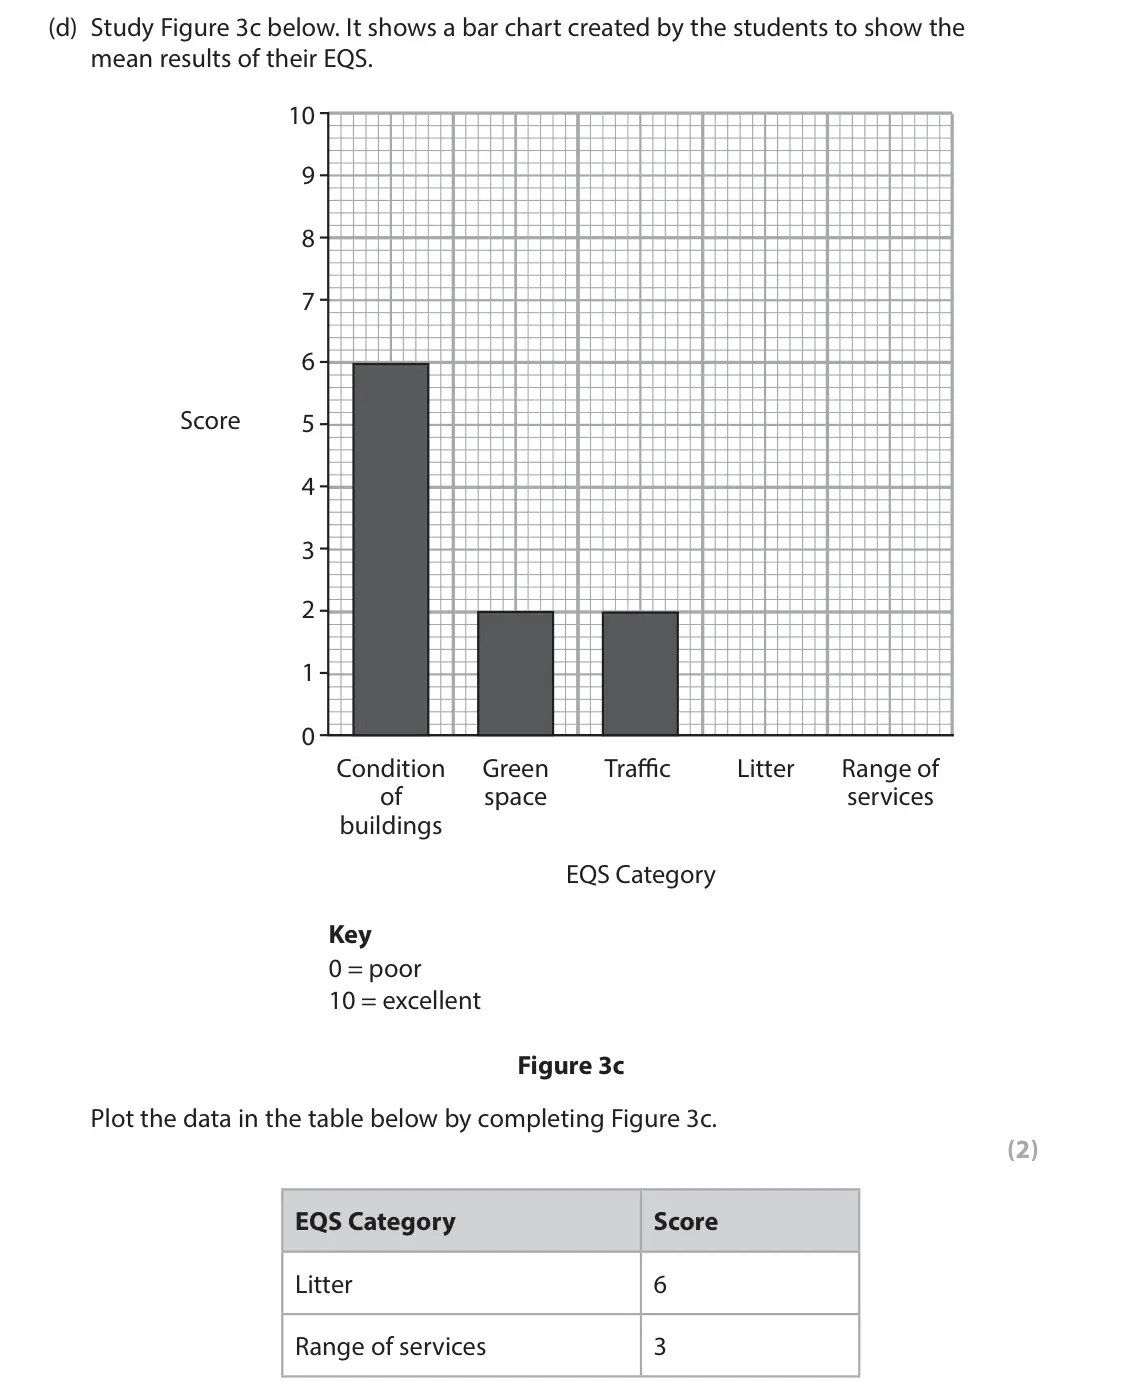
Q3(e)
The whole paper ↗(Total for Question 3 is 8 marks)
Q3(a)(i)
The whole paper ↗ (Total for Question 3 is 2 marks)
Q3(a)(ii)
The whole paper ↗(Total for Question 3 is 2 marks)
Q3(b)(i)
The whole paper ↗(Total for Question 3 is 3 marks)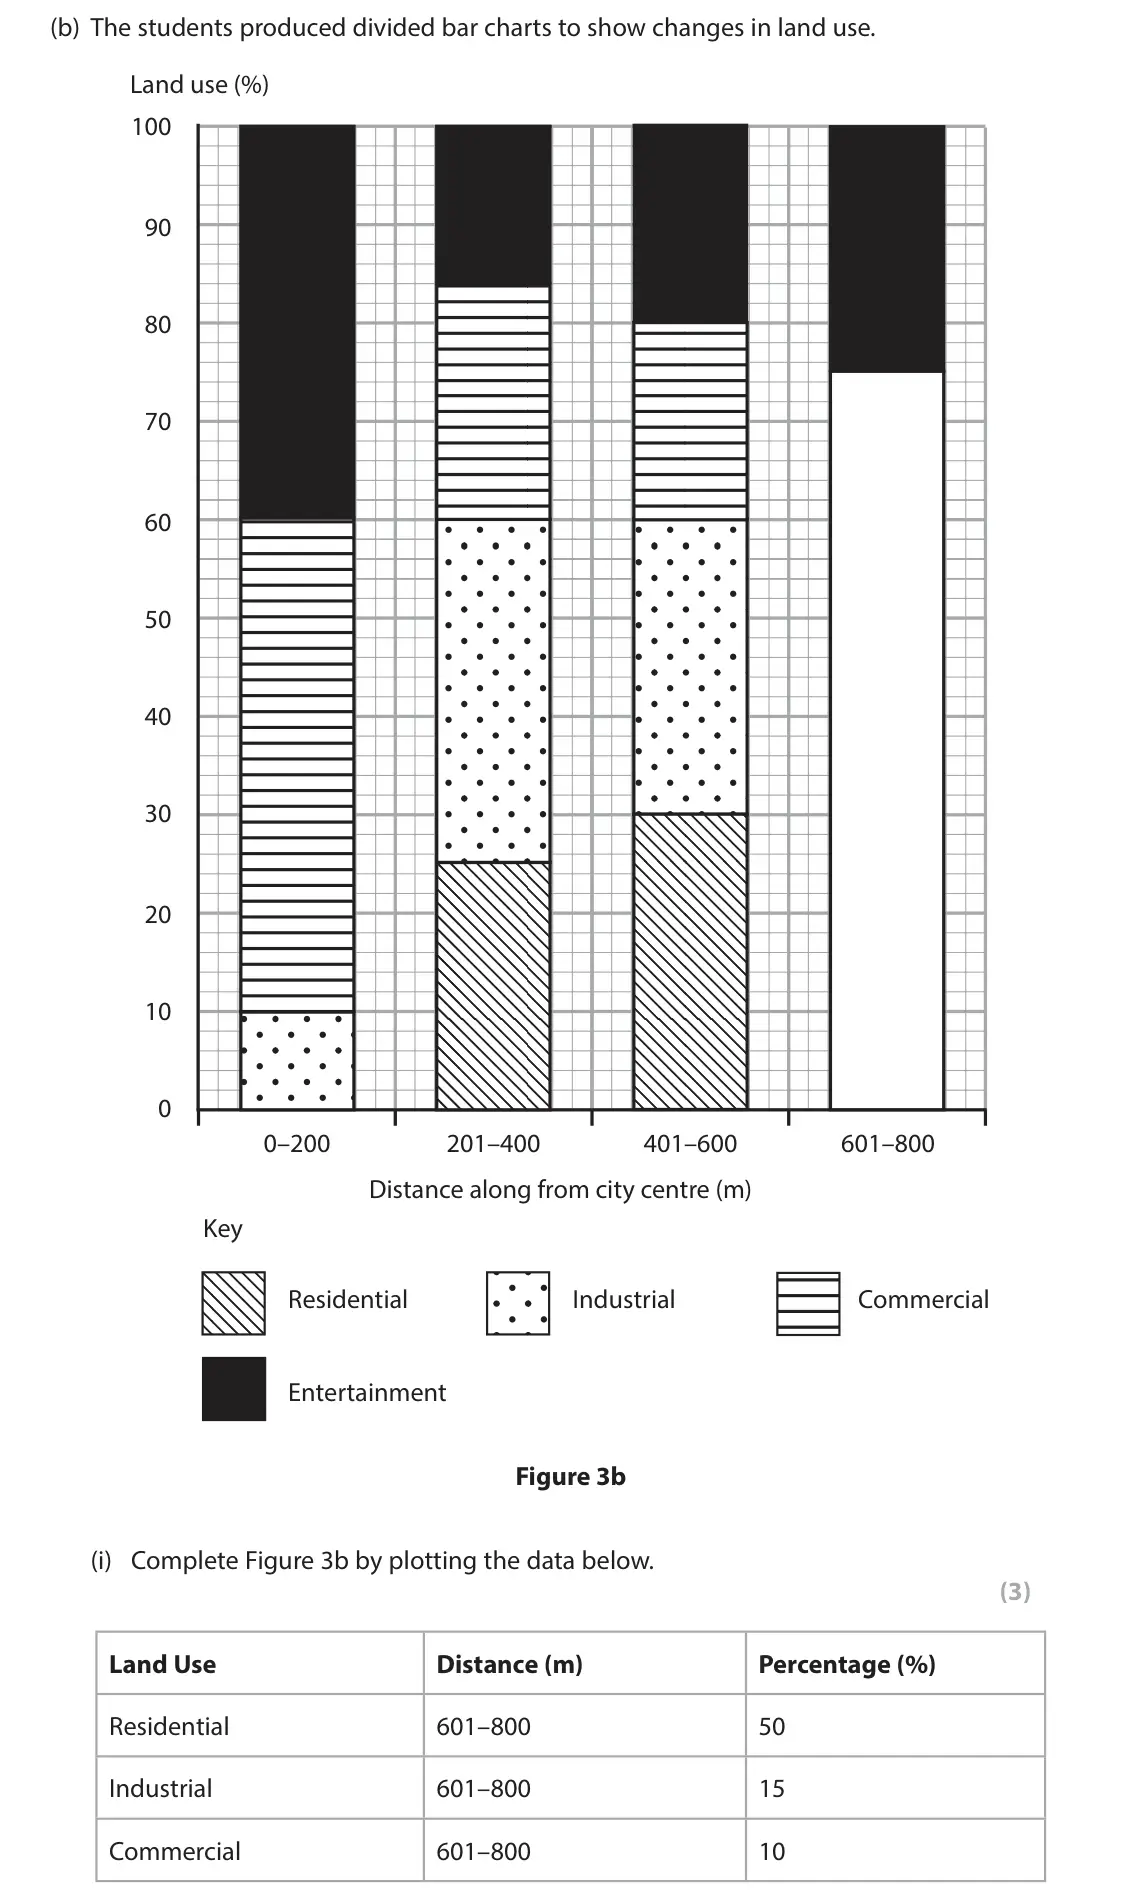
All 41 questions on Investigating central/inner urban areas, as a list
- June 2025, Paper 3, Q3(a)(i) (1 mark): State one risk you considered before collecting your fieldwork data. (1) SECTION B Geographical Investigations – Human Environments Questionnaire results Do you
- June 2025, Paper 3, Q3(a)(ii) (2 marks): Describe one way you attempted to reduce this risk. (2) SECTION B Geographical Investigations – Human Environments Questionnaire results Do you think the reduct
- June 2025, Paper 3, Q3(b) (2 marks): Explain one limitation of your fieldwork method to record environmental quality. (2) SECTION B Geographical Investigations – Human Environments Questionnaire re
- June 2025, Paper 3, Q3(c) (2 marks): Explain one way the use of Census data helped your investigation. (2) SECTION B Geographical Investigations – Human Environments Questionnaire results Do you th
- June 2025, Paper 3, Q3(d) (3 marks): Explain one conclusion that you made about the land use in your urban area. (3) SECTION B Geographical Investigations – Human Environments Questionnaire results
- June 2025, Paper 3, Q3(e) (8 marks): Study Figure 3 in the Resource Booklet. A group of students were investigating the quality of the environment in an urban area. Evaluate the following statement
- June 2024, Paper 3, Q3(a) (4 marks): You have studied an urban area as part of your own fieldwork. Explain two methods you used to collect your fieldwork data. (4) SECTION B Geographical Investigat
- June 2024, Paper 3, Q3(b) (2 marks): Explain one advantage of a technique used to present your fieldwork data. (2) SECTION B Geographical Investigations – Human Landscapes The aim of the students’
- June 2024, Paper 3, Q3(c) (2 marks): Explain one disadvantage of a sampling strategy used in your investigation. (2) SECTION B Geographical Investigations – Human Landscapes The aim of the students
- June 2024, Paper 3, Q3(d) (2 marks): Explain one way secondary data helped to support your investigation. (2) SECTION B Geographical Investigations – Human Landscapes The aim of the students’ inves
- June 2024, Paper 3, Q3(e) (8 marks): Study Figure 3 in the Resource Booklet. A group of students were investigating the quality of the environment in an urban area. Evaluate the following statement
- June 2023, Paper 3, Q3(a)(i) (2 marks): Identify the two most likely land uses in Figure 3a. (2) A commercial (shops) B industrial C transport D open space E residential (housing) 3 A group of student
- June 2023, Paper 3, Q3(a)(ii) (2 marks): Describe one way the students could have presented their land use data. (2) 3 A group of students collected data to investigate change in a central/inner urban
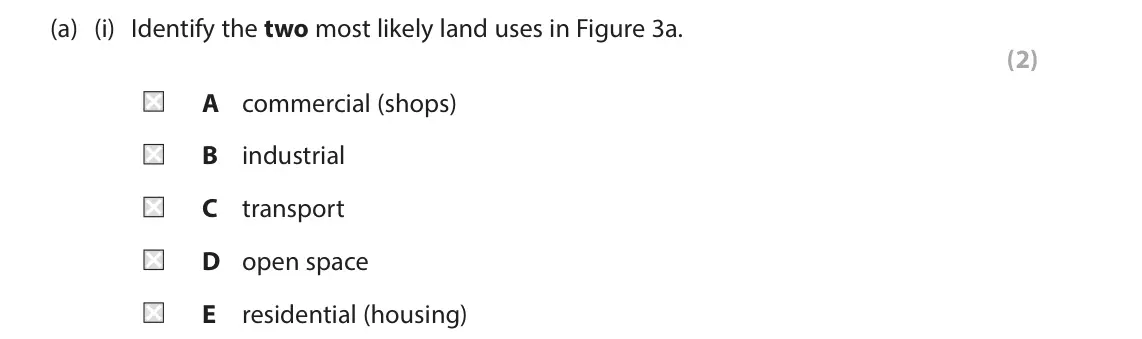
- June 2023, Paper 3, Q3(b) (2 marks): Study Figure 3b in the Resource Booklet. Explain one limitation of using this fieldwork method. (2) 3 A group of students collected data to investigate change i
- June 2023, Paper 3, Q3(c) (2 marks): The students used random sampling to select the sites for an environmental quality survey (EQS). Explain one limitation of using random sampling to collect this
- June 2023, Paper 3, Q3(d) (2 marks): Study Figure 3c below. It shows a bar chart created by the students to show the mean results of their EQS. 10 9 8 7 6 Score 5 4 3 2 1 0 Condition Green Traffic Li
- June 2023, Paper 3, Q3(e) (8 marks): You have studied a central/inner urban area(s) as part of your geographical investigation. Evaluate the success of the methods used to collect your fieldwork (p
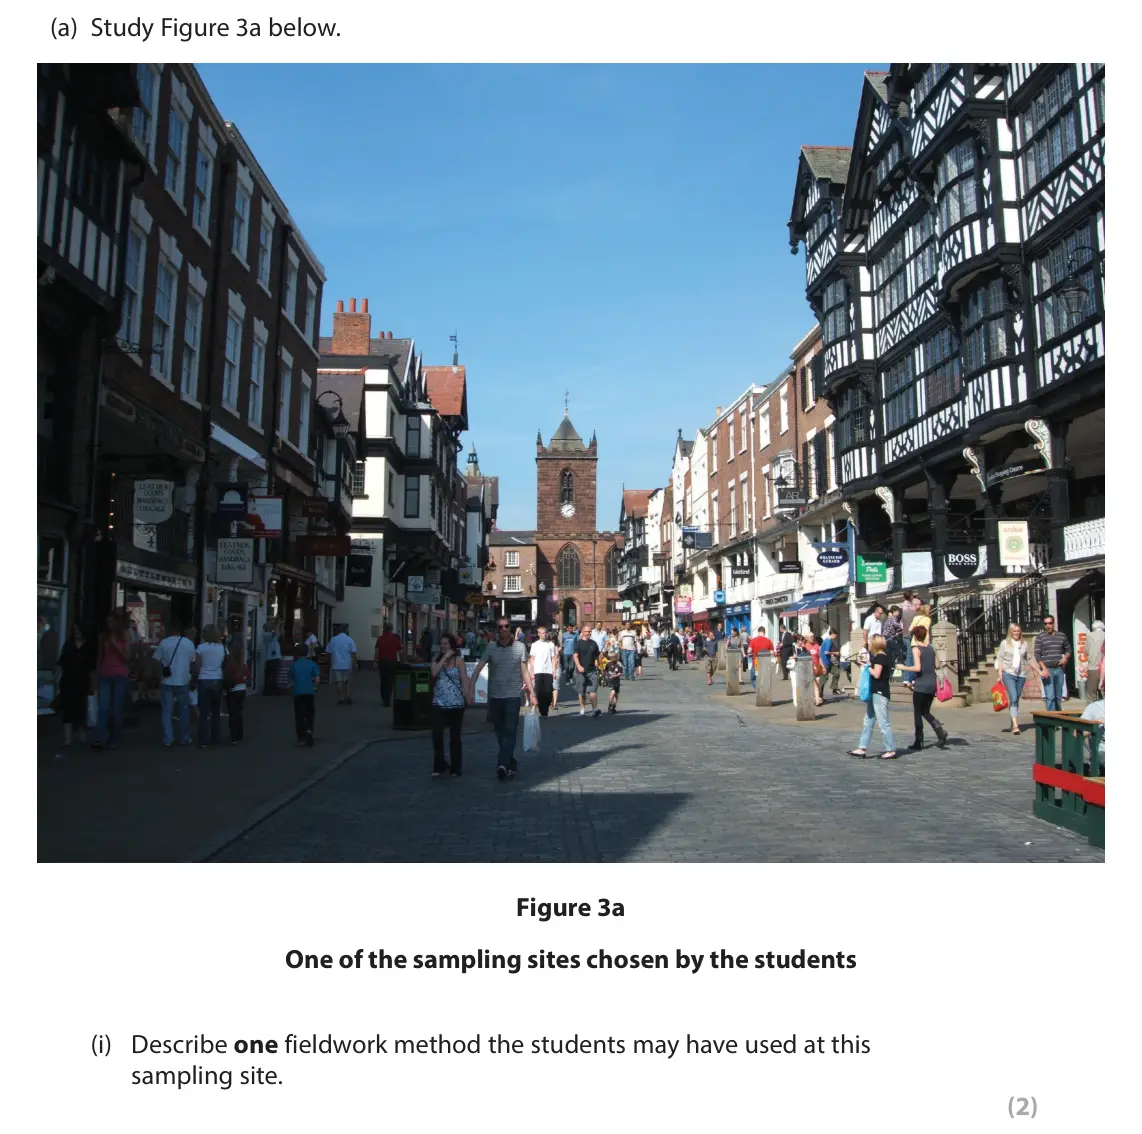
- June 2022, Paper 3, Q3(a)(i) (2 marks): Describe one fieldwork method the students may have used at this sampling site. (2) 3 A group of students collected data to investigate change in Chester’s cent
- June 2022, Paper 3, Q3(a)(ii) (2 marks): Suggest one problem that the students might have experienced when collecting data at this sampling site. (2) 3 A group of students collected data to investigate
- June 2022, Paper 3, Q3(b)(i) (3 marks): Complete Figure 3b by plotting the data below. (3) Land Use Distance (m) Percentage (%) Residential 601–800 50 Industrial 601–800 15 Commercial 601–800 10 3 A g
- June 2022, Paper 3, Q3(b)(ii) (1 mark): State one limitation of using divided bar charts to present this data. (1) 3 A group of students collected data to investigate change in Chester’s central/inner
- June 2022, Paper 3, Q3(b)(iii) (2 marks): Suggest one way this data could have been presented differently. (2) 3 A group of students collected data to investigate change in Chester’s central/inner urban
- November 2021, Paper 3, Q3(a) (2 marks): Study Figure 3 in the Resource Booklet. Suggest one way the students could have presented the data from their urban study. (2) SECTION B Geographical Investigat
- November 2021, Paper 3, Q3(b) (8 marks): Study Figure 3 in the Resource Booklet. Evaluate the accuracy and reliability of the fieldwork methods shown in Figure 3. (8) SECTION B Geographical Investigati
- November 2020, Paper 3, Q3(a)(i) (2 marks): Explain one reason why you used a qualitative fieldwork method. Named qualitative fieldwork method (2) SECTION B Geographical Investigations – Human Landscapes
- November 2020, Paper 3, Q3(a)(ii) (2 marks): Explain one disadvantage of this qualitative fieldwork method. (2) SECTION B Geographical Investigations – Human Landscapes A group of students collected data i
- November 2020, Paper 3, Q3(b) (1 mark): State one risk that you considered before collecting your urban fieldwork data. (1) SECTION B Geographical Investigations – Human Landscapes A group of students
- November 2020, Paper 3, Q3(c) (2 marks): Explain one advantage of a sampling strategy you used to collect your data. Use evidence from your own fieldwork in your answer. Named sampling strategy (2) SEC
- November 2020, Paper 3, Q3(d) (3 marks): Explain one way in which the secondary data that you collected helped your urban investigation. Named secondary source (3) SECTION B Geographical Investigations
- November 2020, Paper 3, Q3(e) (8 marks): Study Figures 3a and 3b in the Resource Booklet. Using both Figures 3a and 3b, assess the conclusions that might be drawn from this urban investigation. (8) SEC
- June 2019, Paper 3, Q3(a) (1 mark): Identify which one of the following is a quantitative fieldwork method. (1) A interview B newspaper article C pedestrian count D street observation Very dirty V
- June 2019, Paper 3, Q3(b)(i) (1 mark): State the purpose of this fieldwork method. (1) Very dirty Very clean Cold weather Hot weather Run down appearance Modern appearance Lots of traffic noise No tr
- June 2019, Paper 3, Q3(b)(ii) (3 marks): Explain one limitation of using this fieldwork method. (3) Very dirty Very clean Cold weather Hot weather Run down appearance Modern appearance Lots of traffic
- June 2019, Paper 3, Q3(c) (3 marks): Explain one advantage of using stratified sampling. (3) Very dirty Very clean Cold weather Hot weather Run down appearance Modern appearance Lots of traffic noi
- June 2019, Paper 3, Q3(d) (2 marks): Study Figure 3b below. It shows a line graph for a pedestrian count in an urban area. 45 40 35 30 25 20 15 10 5 0 Site 1 Site 2 Site 3 Site 4 Site 5 Site 6 Surv
- June 2019, Paper 3, Q3(e) (8 marks): You have studied an urban area as part of your fieldwork. Assess the extent to which your conclusions answered the enquiry question(s). (8) Very dirty Very clea
- June 2018, Paper 3, Q3(a) (1 mark): Identify which one of the following is a type of qualitative data. (1) A traffic count B newspaper article C pedestrian count D population census SECTION B Figu
- June 2018, Paper 3, Q3(b)(i) (4 marks): Explain one advantage and one disadvantage of the technique shown in Figure 3a. (4) SECTION B Figure 3a Student conducting a questionnaire about environmental q
- June 2018, Paper 3, Q3(b)(ii) (3 marks): The student used a random sampling strategy to collect the data. Explain one disadvantage of using this sampling strategy. (3) SECTION B Figure 3a Student condu
- June 2018, Paper 3, Q3(c) (2 marks): Study Figure 3b below. It shows a radial graph for an Environmental Quality Survey (EQS) completed at an urban location. Condition of buildings 10 8 6 Green spa
- June 2018, Paper 3, Q3(d) (8 marks): You have studied an urban area as part of your fieldwork. Evaluate the different techniques used to present your fieldwork data. (8) SECTION B Figure 3a Student
Questions, mark schemes and examiner’s reports are © Pearson Edexcel, from their published past papers. Plumi isn’t affiliated with any exam board. Want whole papers? Edexcel GCSE Geography A past papers.
The Plumi iPad app also offers exam-style questions with AI feedback on your handwritten working.