 plumi
Motion and SUVAT: Edexcel A‑Level Physics questions
Every Edexcel A-Level Physics exam question on Motion and SUVAT (specification points 9–11), 2016–2025, with its mark scheme and examiner’s report.
Find questions1,540
Calculations
Q12(b)(i)
The whole paper ↗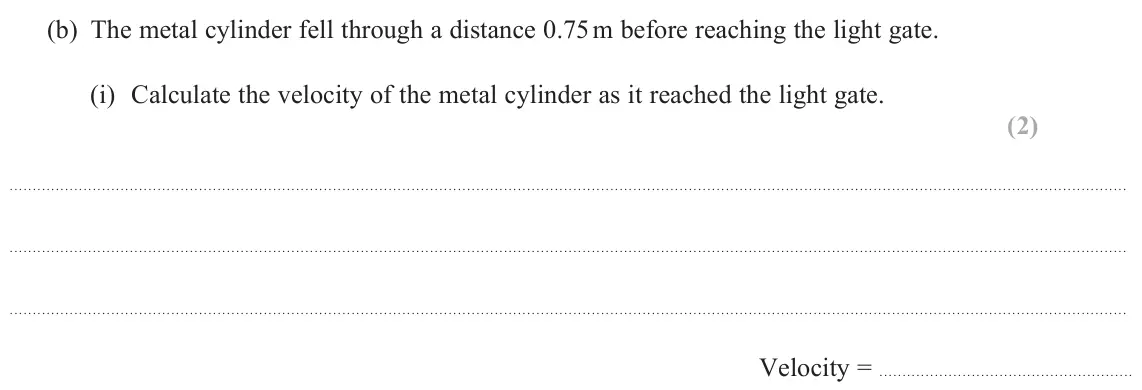
Q18(b)(i)
The whole paper ↗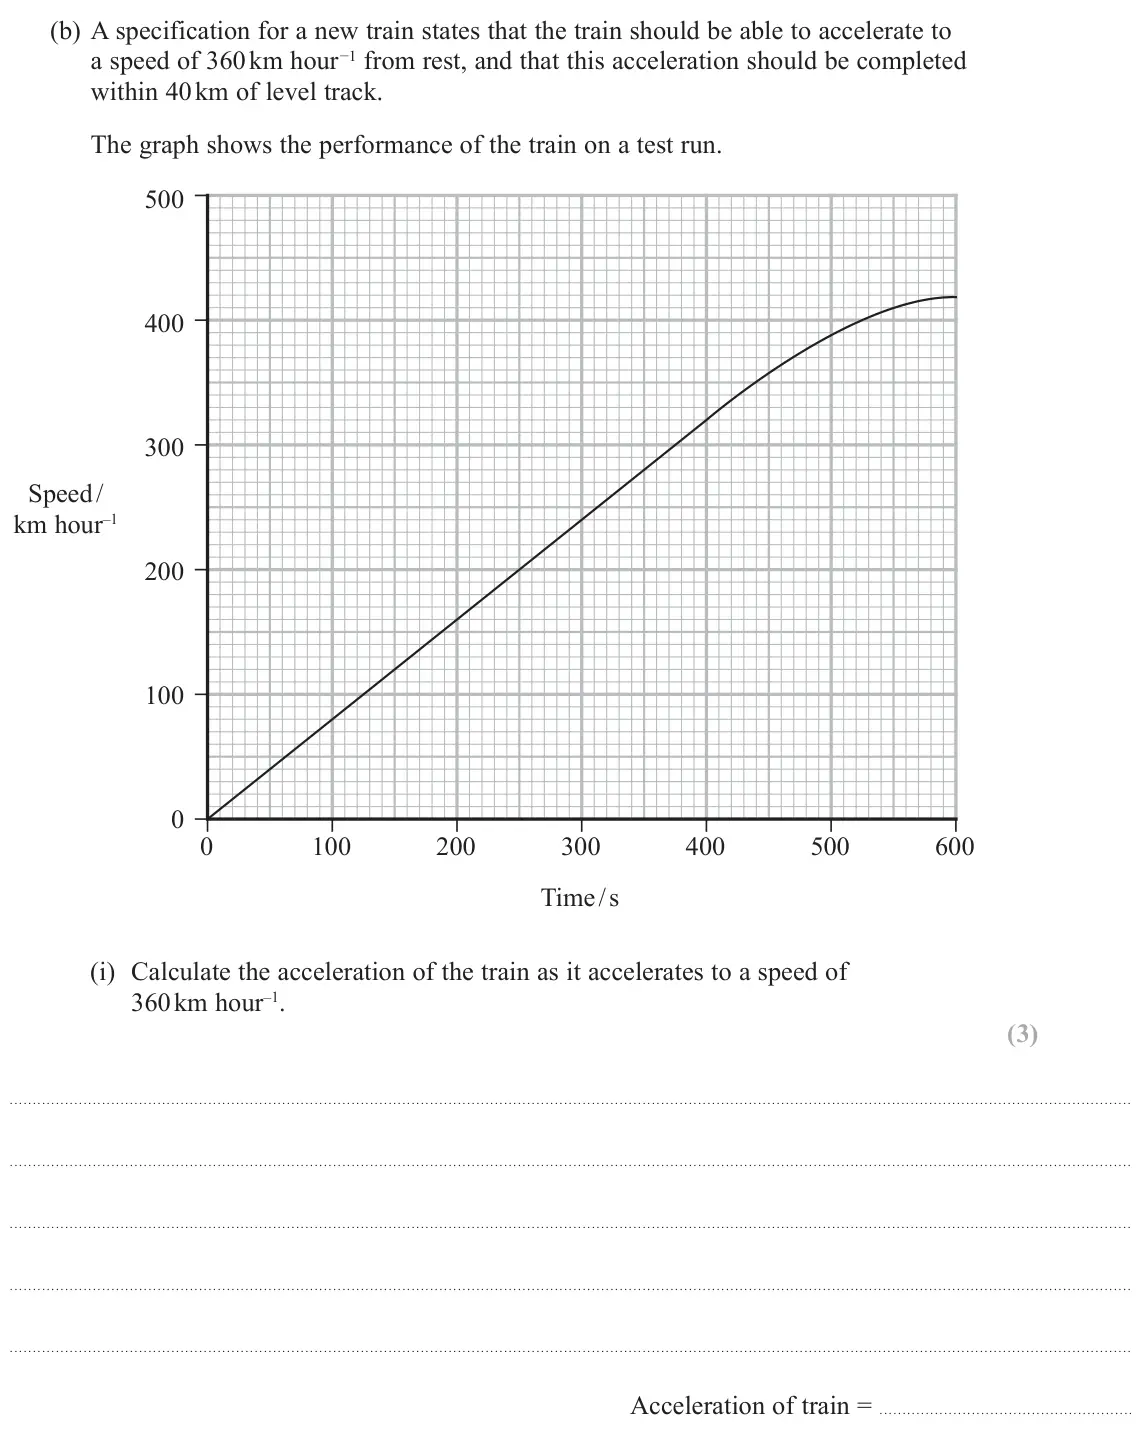
Q18(b)(ii)
The whole paper ↗
Q10(a)
The whole paper ↗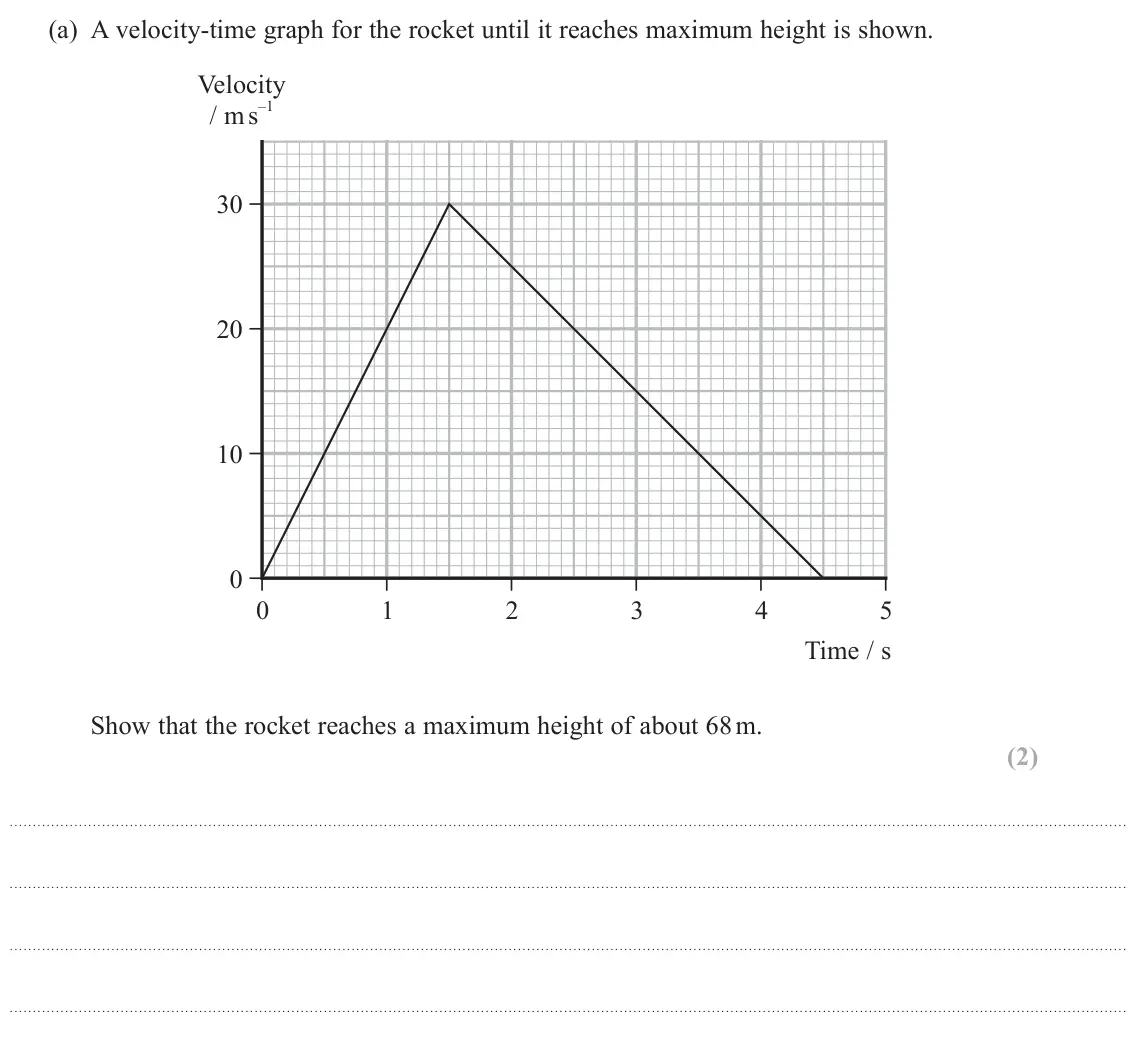
Q10(b)
The whole paper ↗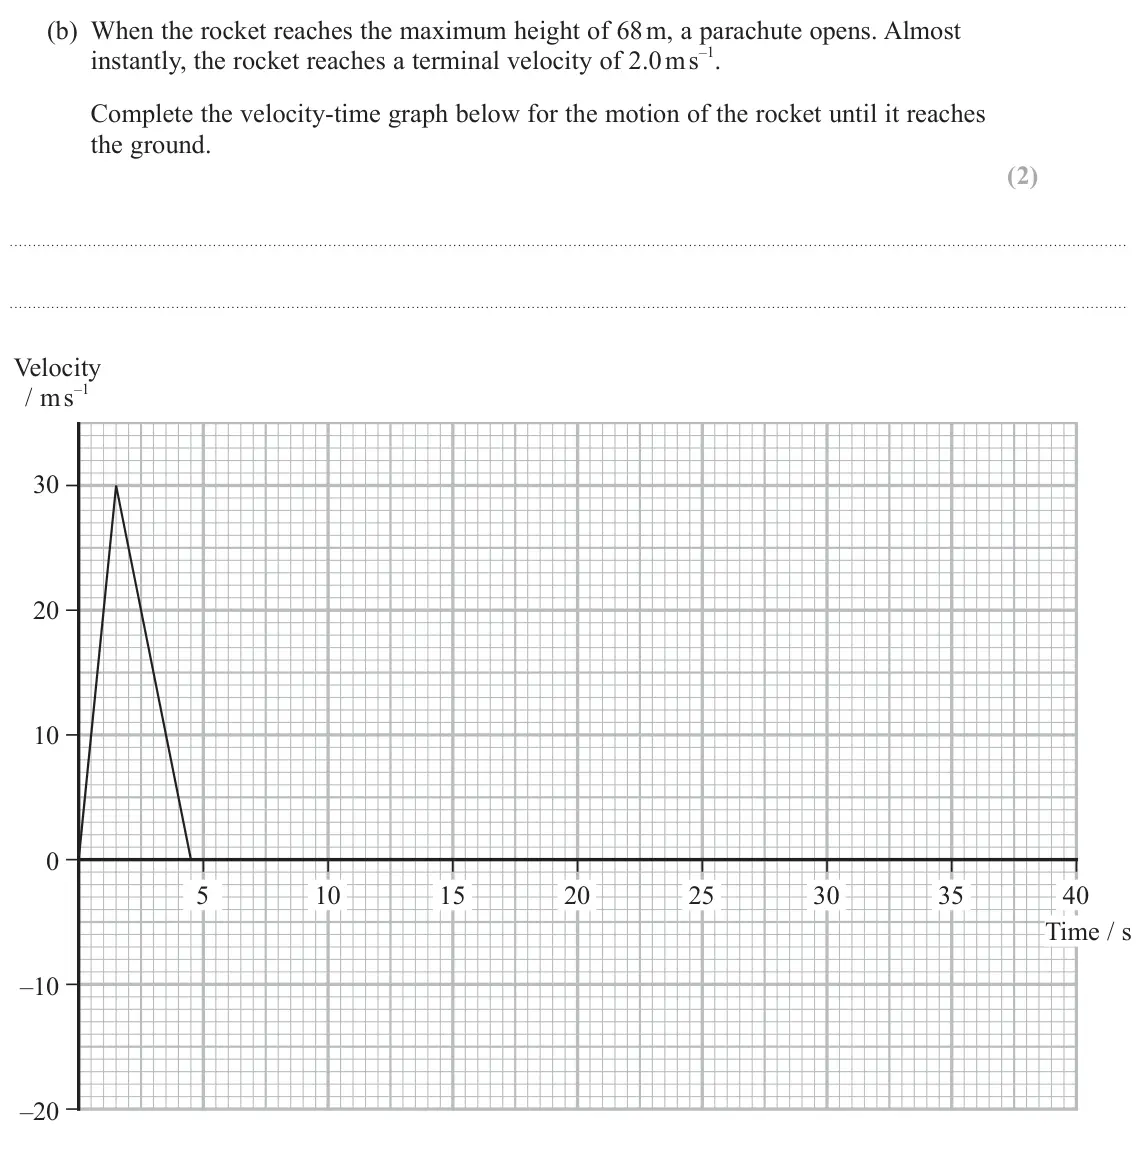
Q12(b)(i)
The whole paper ↗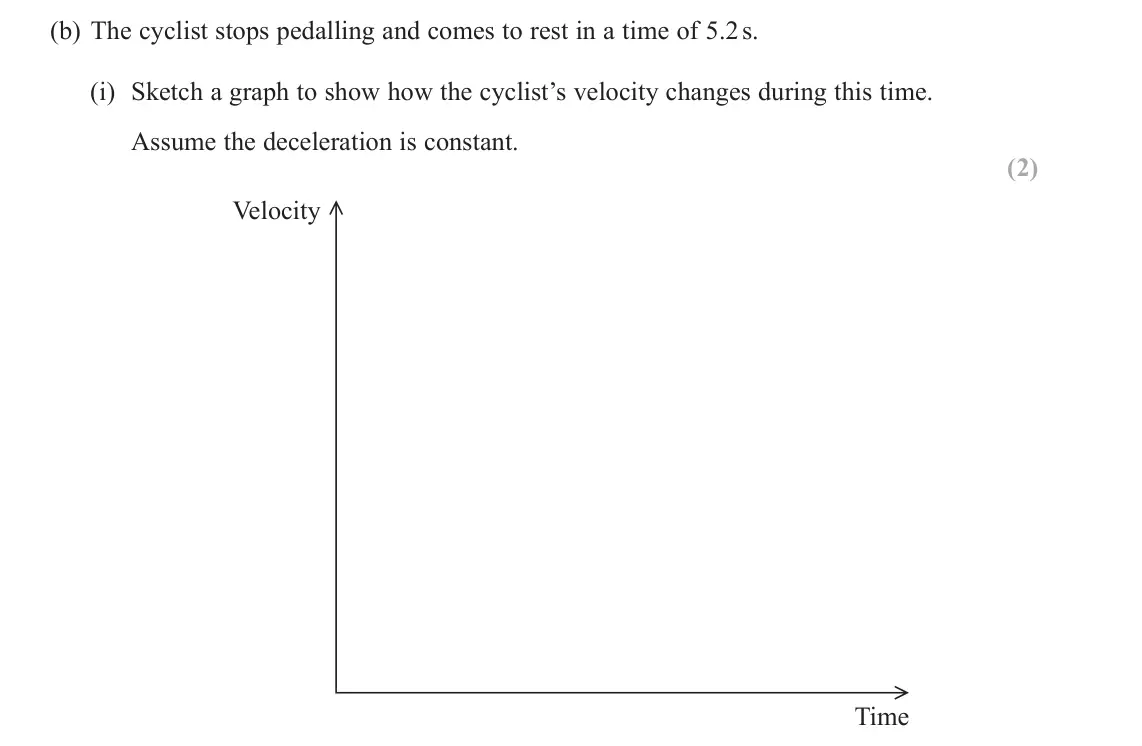
Q12(b)(ii)
The whole paper ↗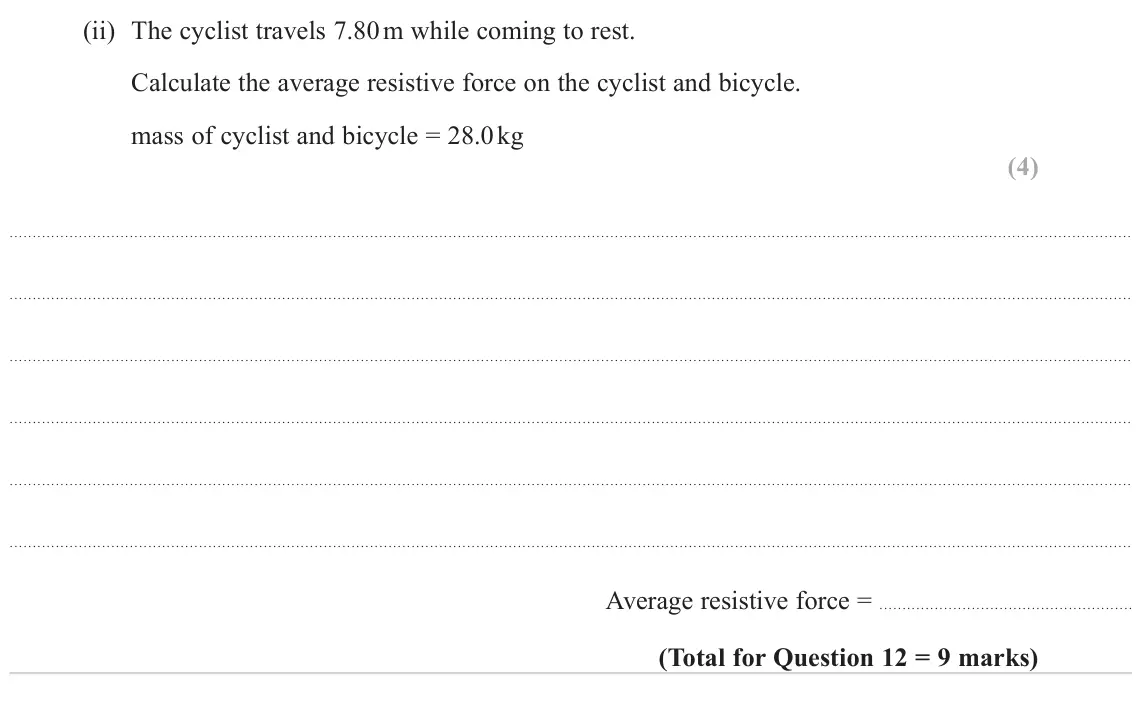
Q18(b)(iv)
The whole paper ↗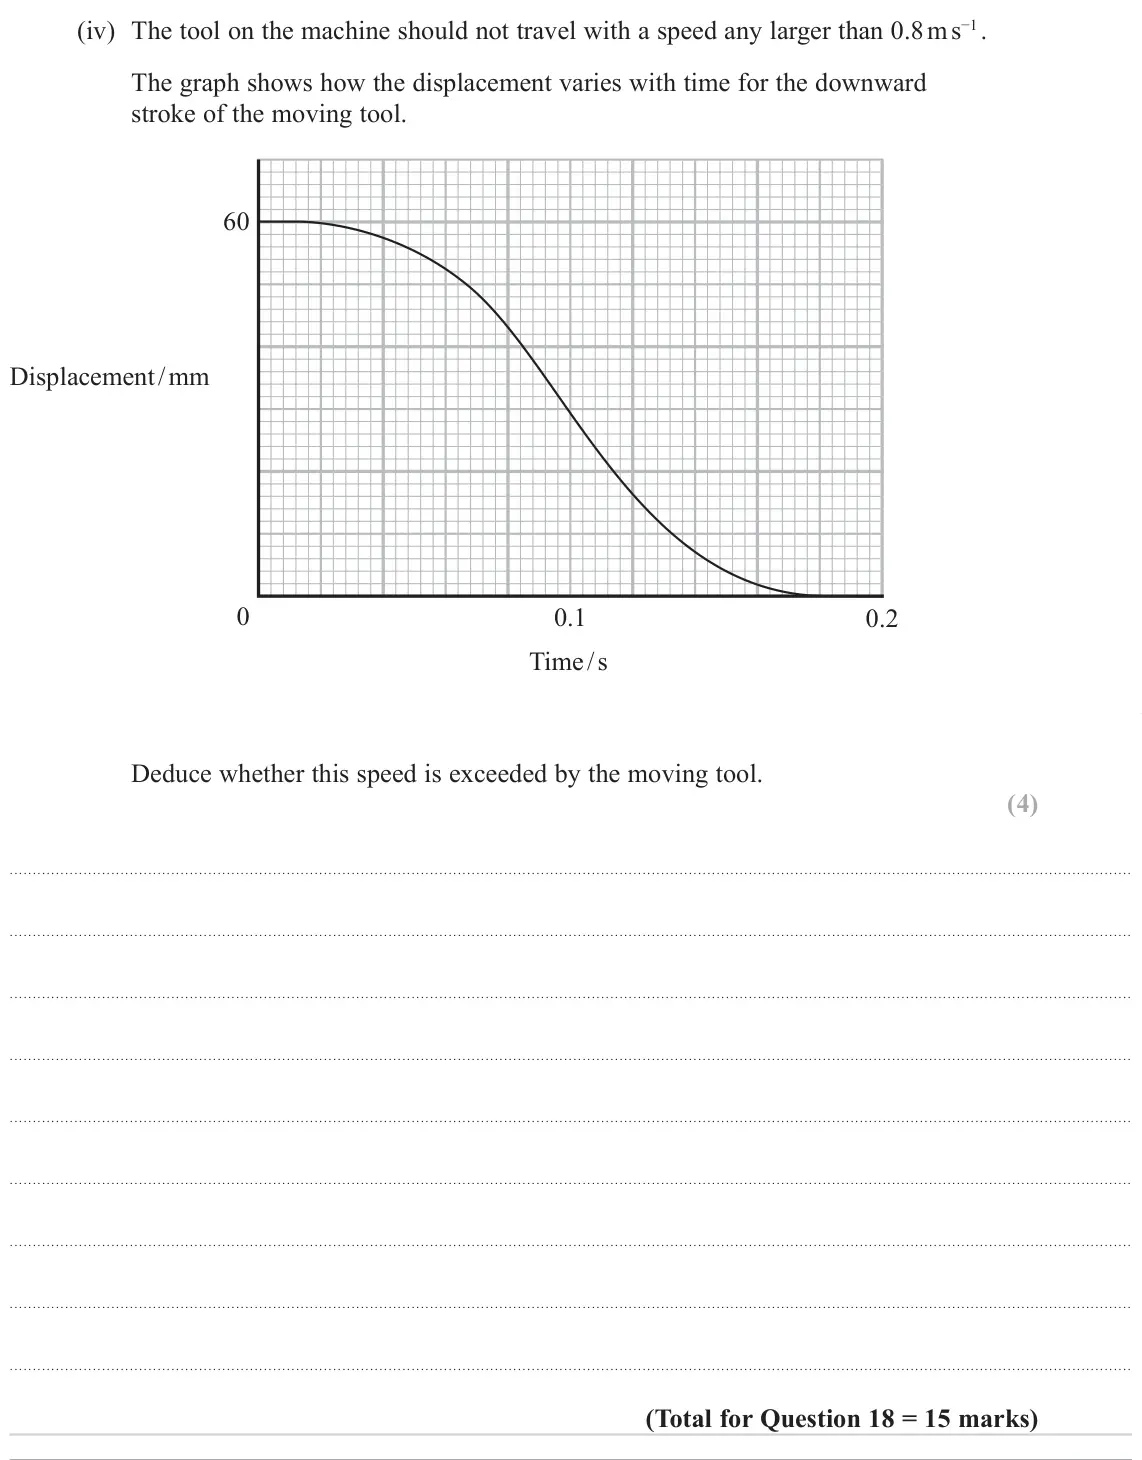
Q11(a)
The whole paper ↗
Q11(b)
The whole paper ↗
Q17(a)(i)
The whole paper ↗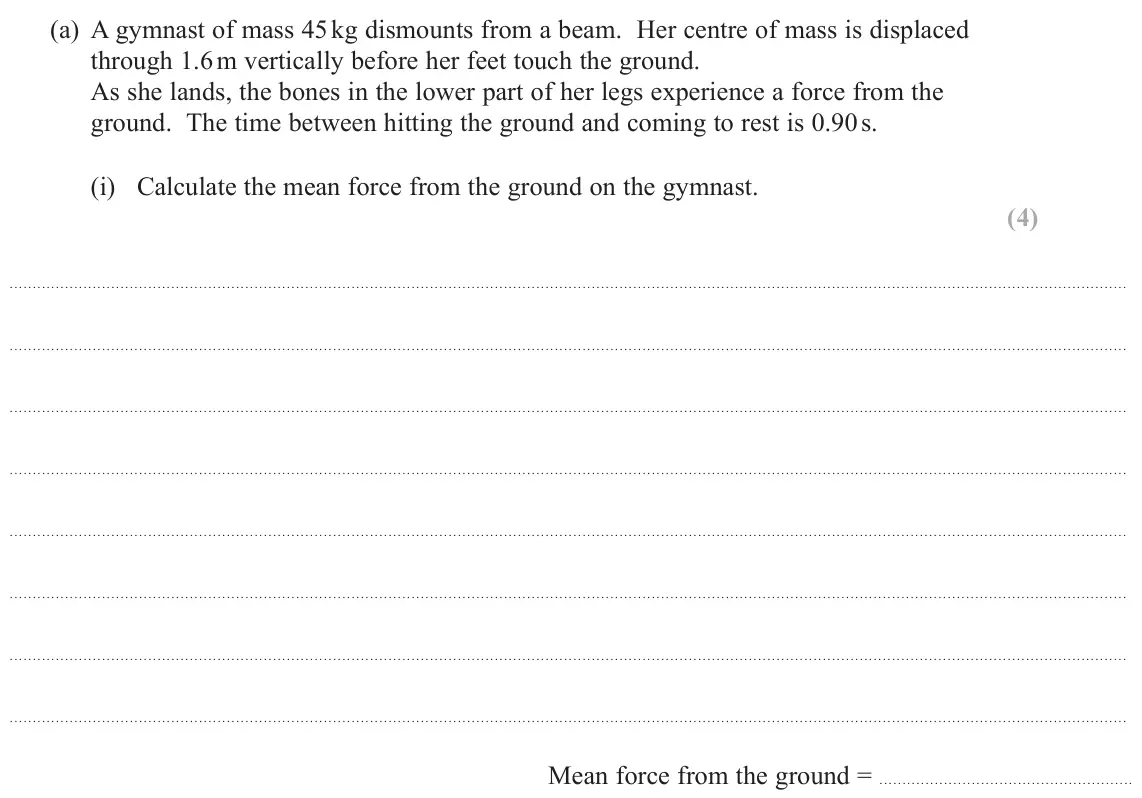
Q13(b)(i)
The whole paper ↗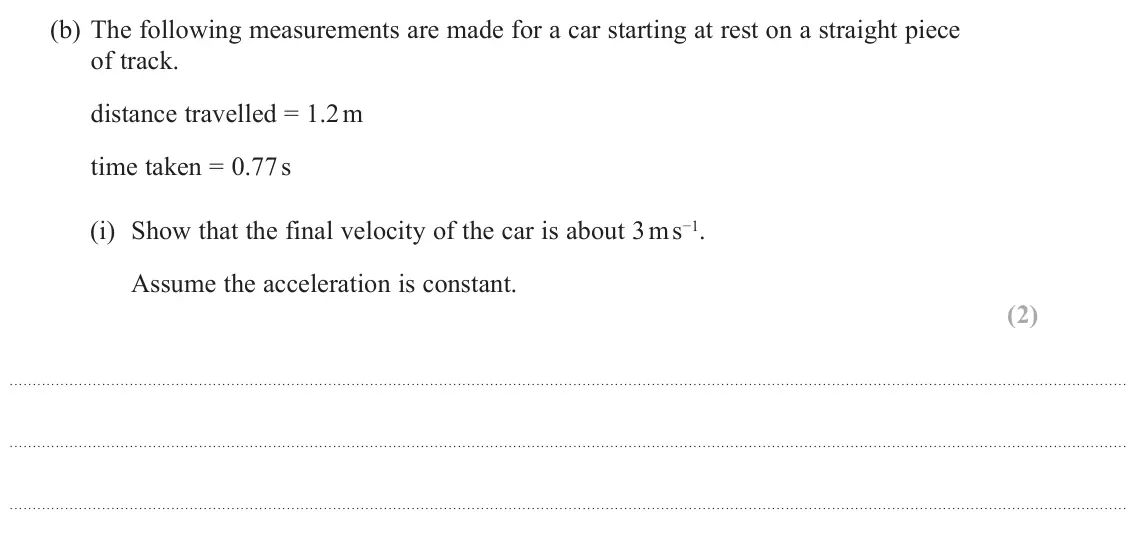
All 48 questions on Motion and SUVAT, as a list
- June 2025, Paper 3, Q12(b)(i) (2 marks): Calculate the velocity of the metal cylinder as it reached the light gate. (2) Velocity =
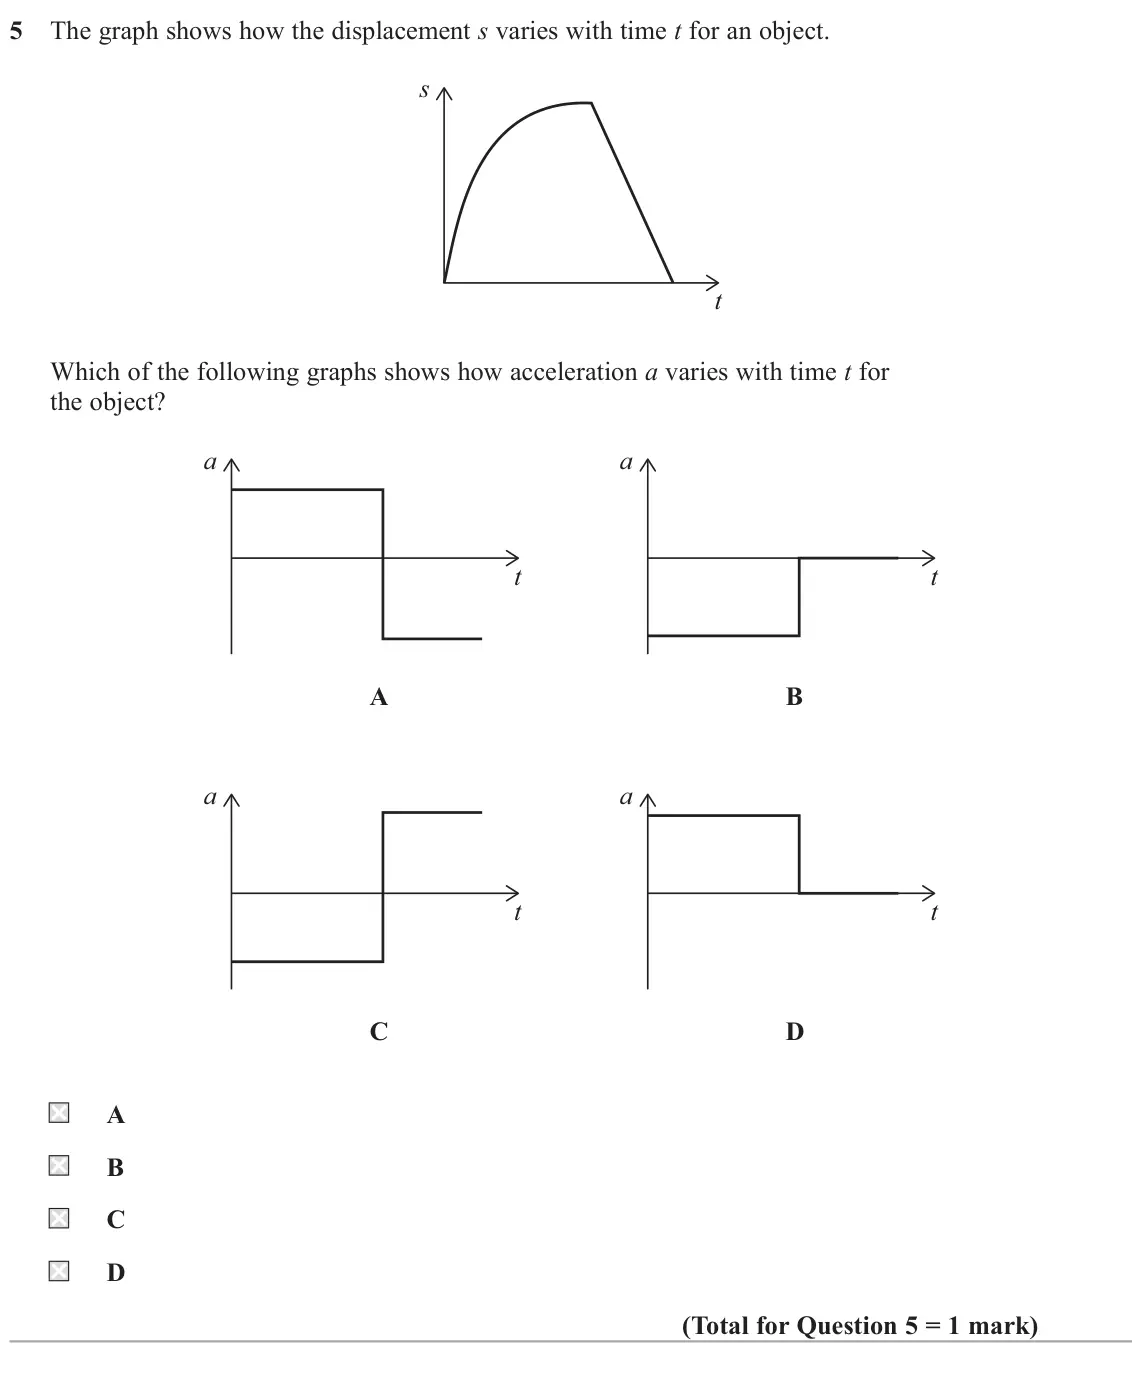
- June 2025, AS Paper 1, Q5 (1 mark): The graph shows how the displacement s varies with time t for an object. s t Which of the following graphs shows how acceleration a varies with time t for the o
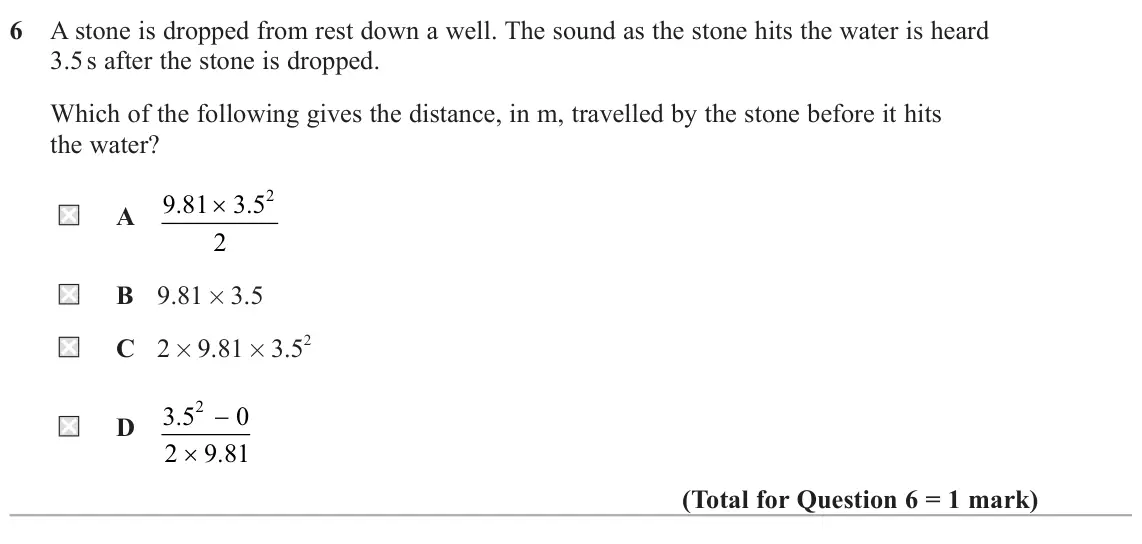
- June 2025, AS Paper 1, Q6 (1 mark): A stone is dropped from rest down a well. The sound as the stone hits the water is heard 3.5 s after the stone is dropped. Which of the following gives the dist
- June 2024, Paper 1, Q18(b)(i) (3 marks): Calculate the acceleration of the train as it accelerates to a speed of 360 km hour–1. (3) Acceleration of train =
- June 2024, Paper 1, Q18(b)(ii) (3 marks): Deduce whether the performance of the train met the specification on this test run. (3)
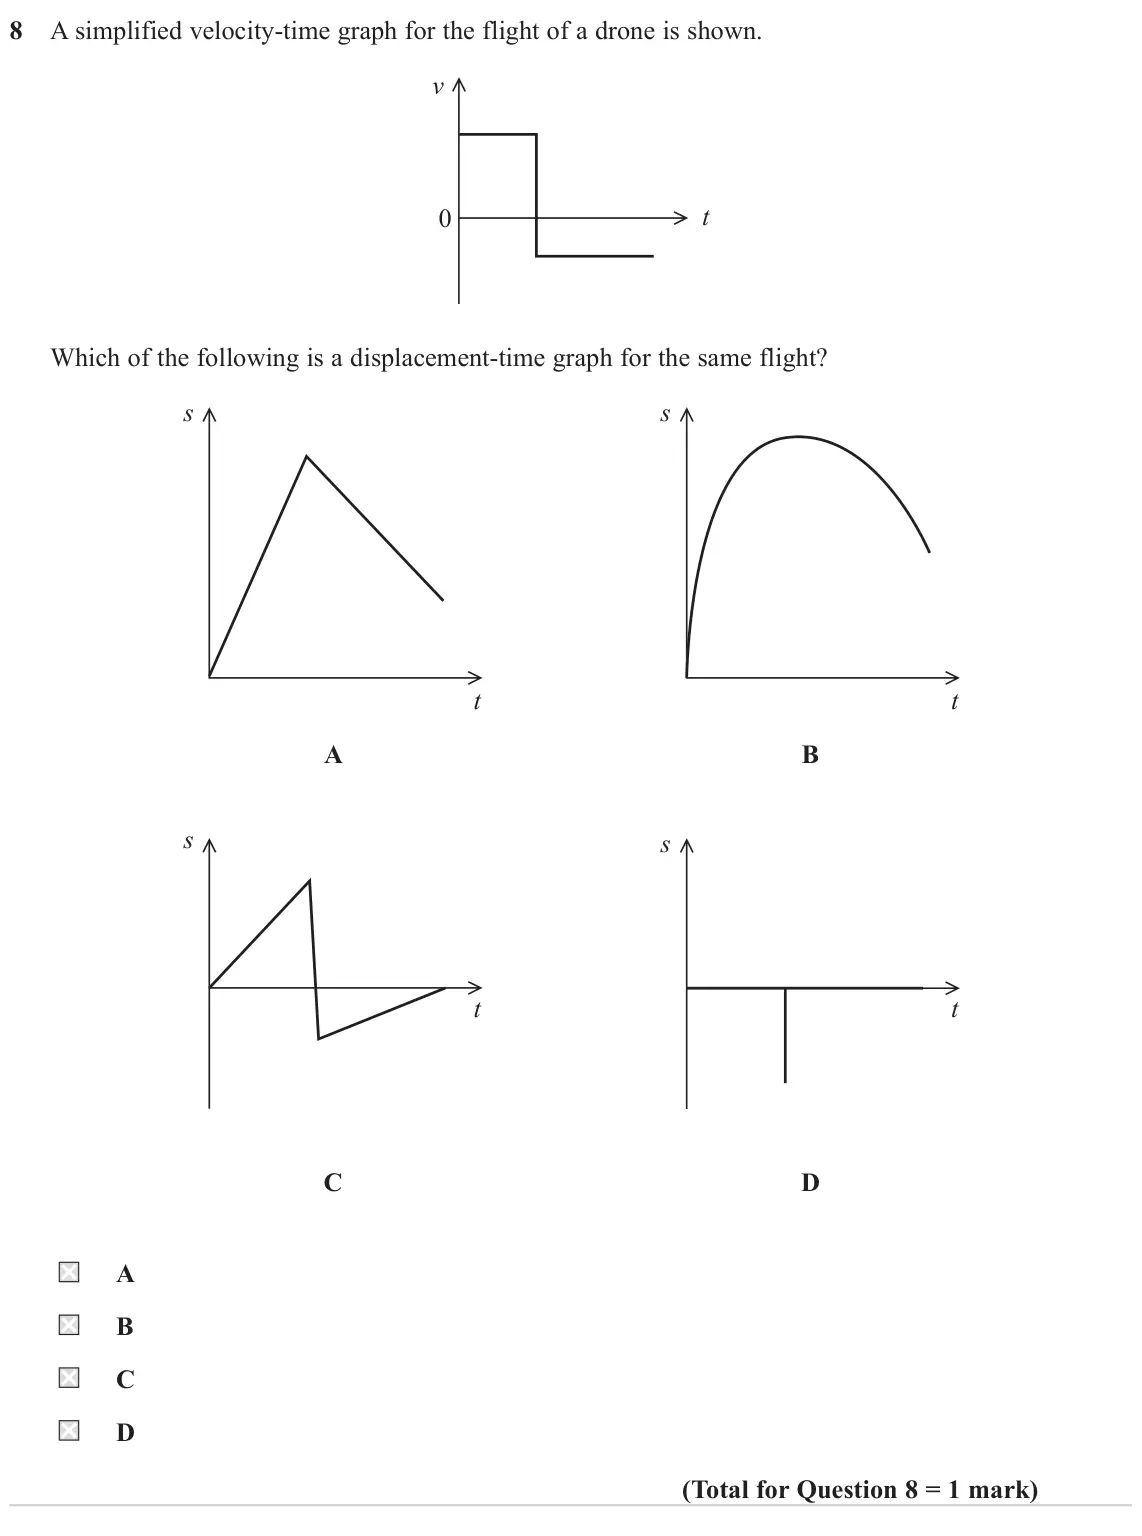
- June 2024, AS Paper 1, Q8 (1 mark): A simplified velocity-time graph for the flight of a drone is shown. v 0 t Which of the following is a displacement-time graph for the same flight? s s t t A B
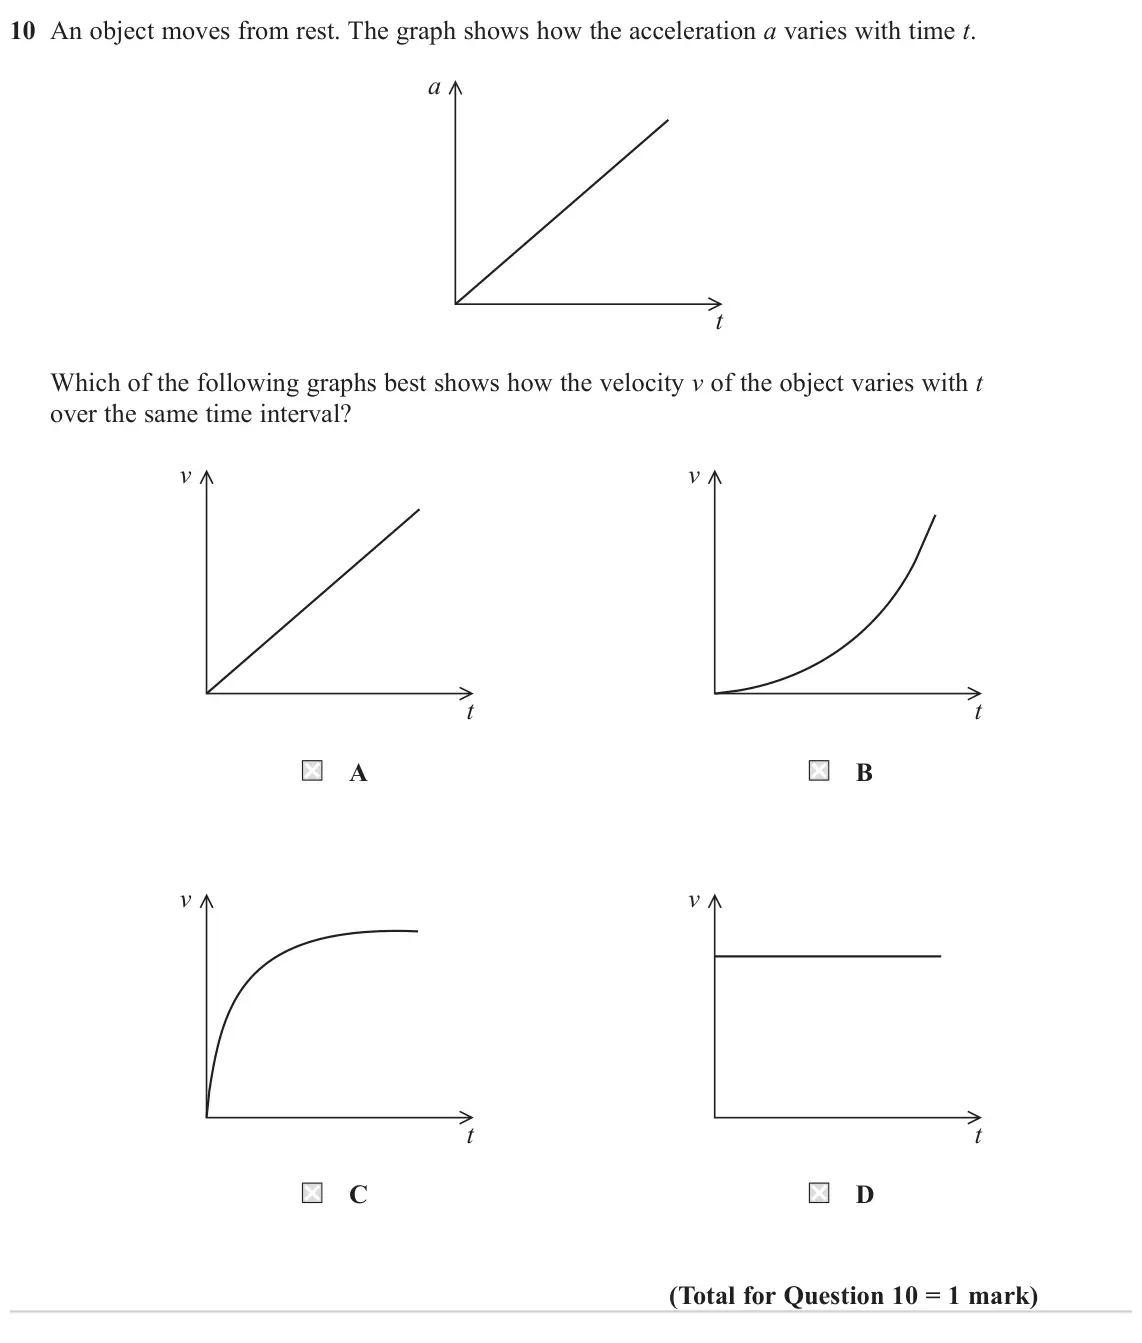
- June 2023, Paper 1, Q10 (1 mark): An object moves from rest. The graph shows how the acceleration a varies with time t. a t Which of the following graphs best shows how the velocity v of the obj
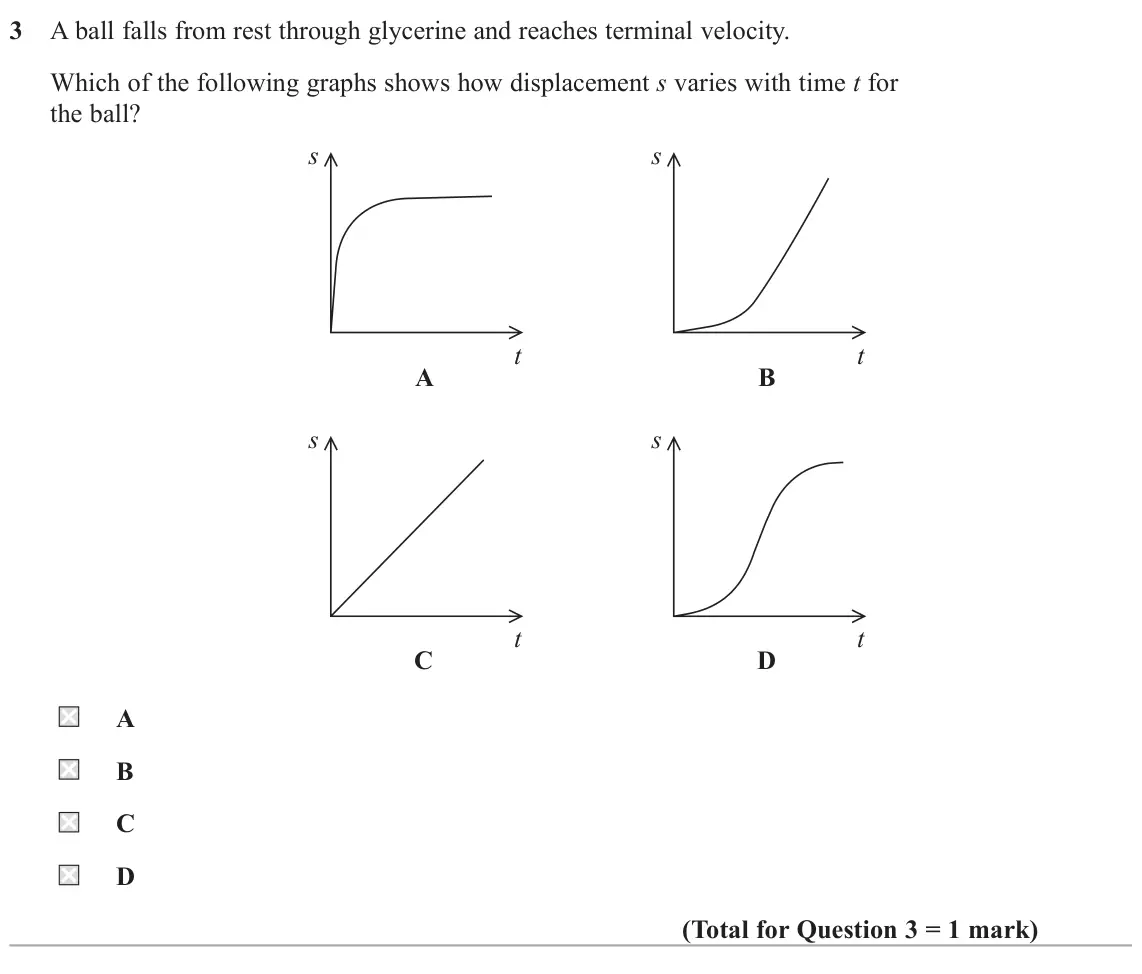
- June 2023, AS Paper 1, Q3 (1 mark): A ball falls from rest through glycerine and reaches terminal velocity. Which of the following graphs shows how displacement s varies with time t for the ball?
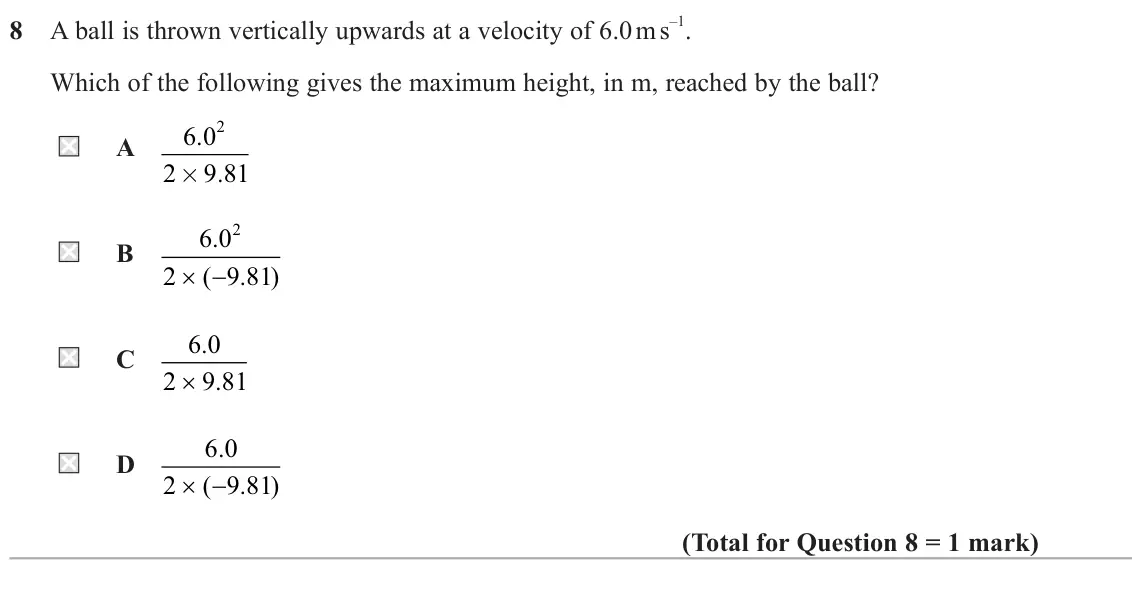
- June 2023, AS Paper 1, Q8 (1 mark): A ball is thrown vertically upwards at a velocity of 6.0 m s –1. Which of the following gives the maximum height, in m, reached by the ball? 2 6 0 . A 2 9 81 .
- June 2023, AS Paper 1, Q10(a) (2 marks): A velocity‑time graph for the rocket until it reaches maximum height is shown. Velocity / m s –1 30 20 10 0 0 1 2 3 4 5 Time / s Show that the rocket reaches a
- June 2023, AS Paper 1, Q10(b) (2 marks): When the rocket reaches the maximum height of 68 m, a parachute opens. Almost instantly, the rocket reaches a terminal velocity of 2.0 m s –1. Complete the velo
- June 2022, Paper 1, Q12(b)(i) (2 marks): Sketch a graph to show how the cyclist’s velocity changes during this time. Assume the deceleration is constant. (2) Velocity Time
- June 2022, Paper 1, Q12(b)(ii) (4 marks): The cyclist travels 7.80 m while coming to rest. Calculate the average resistive force on the cyclist and bicycle. mass of cyclist and bicycle = 28.0 kg (4) Ave
- June 2022, Paper 1, Q18(b)(iv) (4 marks): The tool on the machine should not travel with a speed any larger than 0.8 m s−1 . The graph shows how the displacement varies with time for the downward stroke
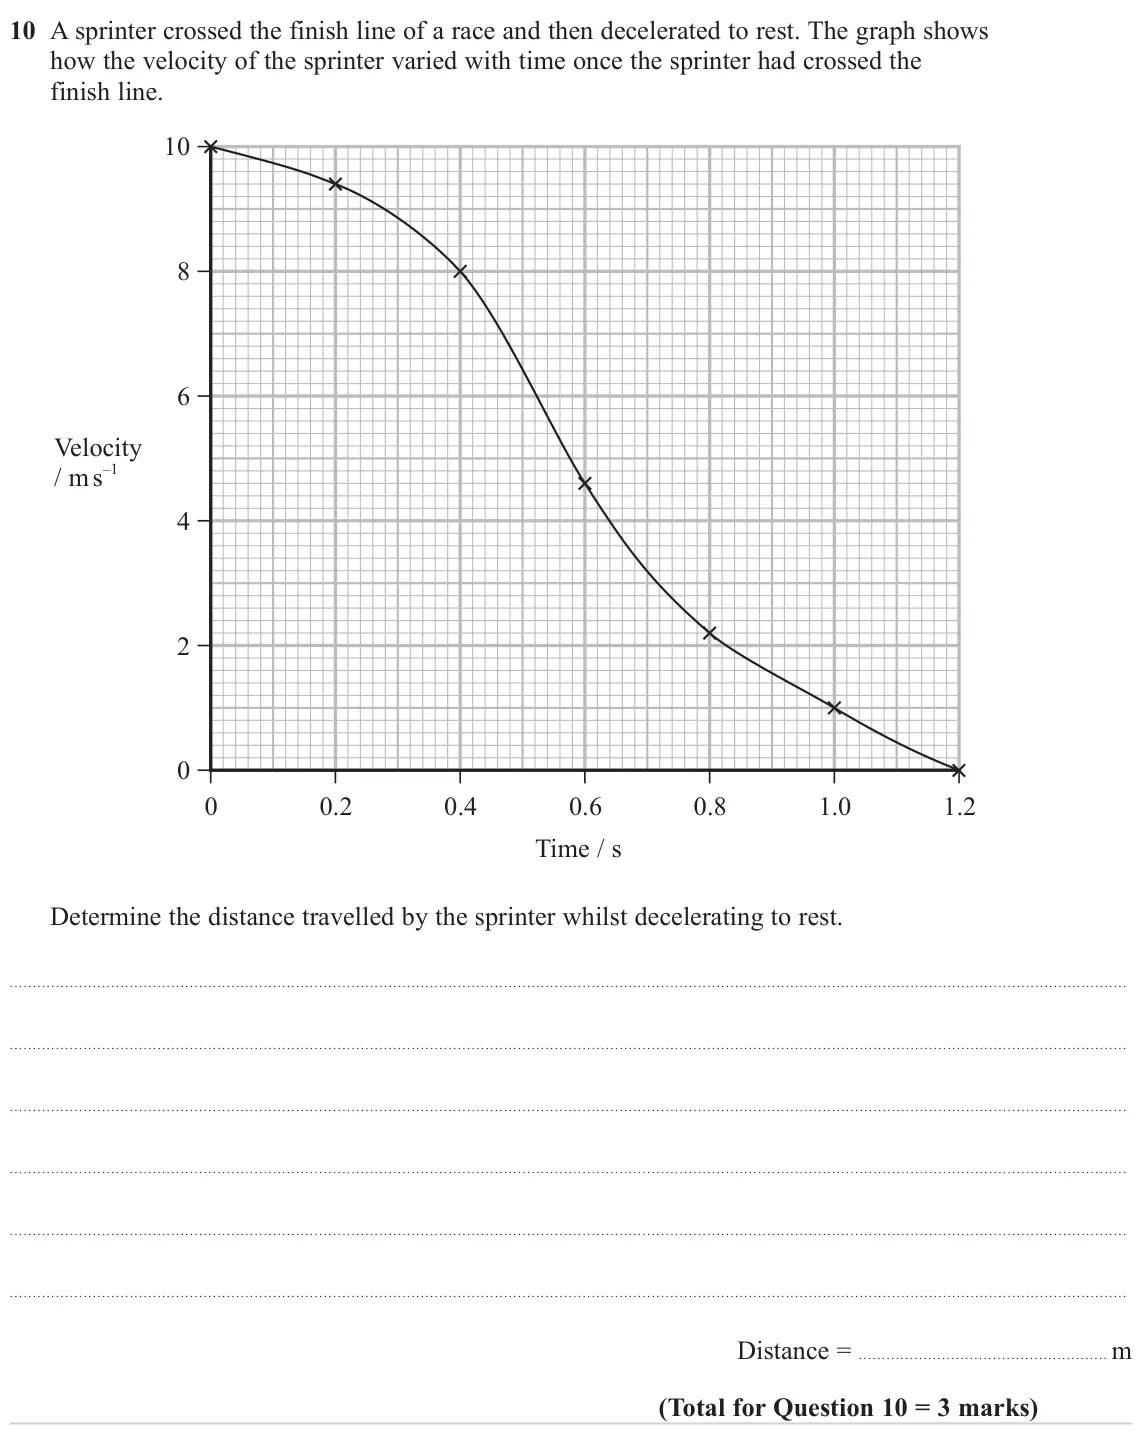
- June 2022, AS Paper 1, Q10 (3 marks): A sprinter crossed the finish line of a race and then decelerated to rest. The graph shows how the velocity of the sprinter varied with time once the sprinter h
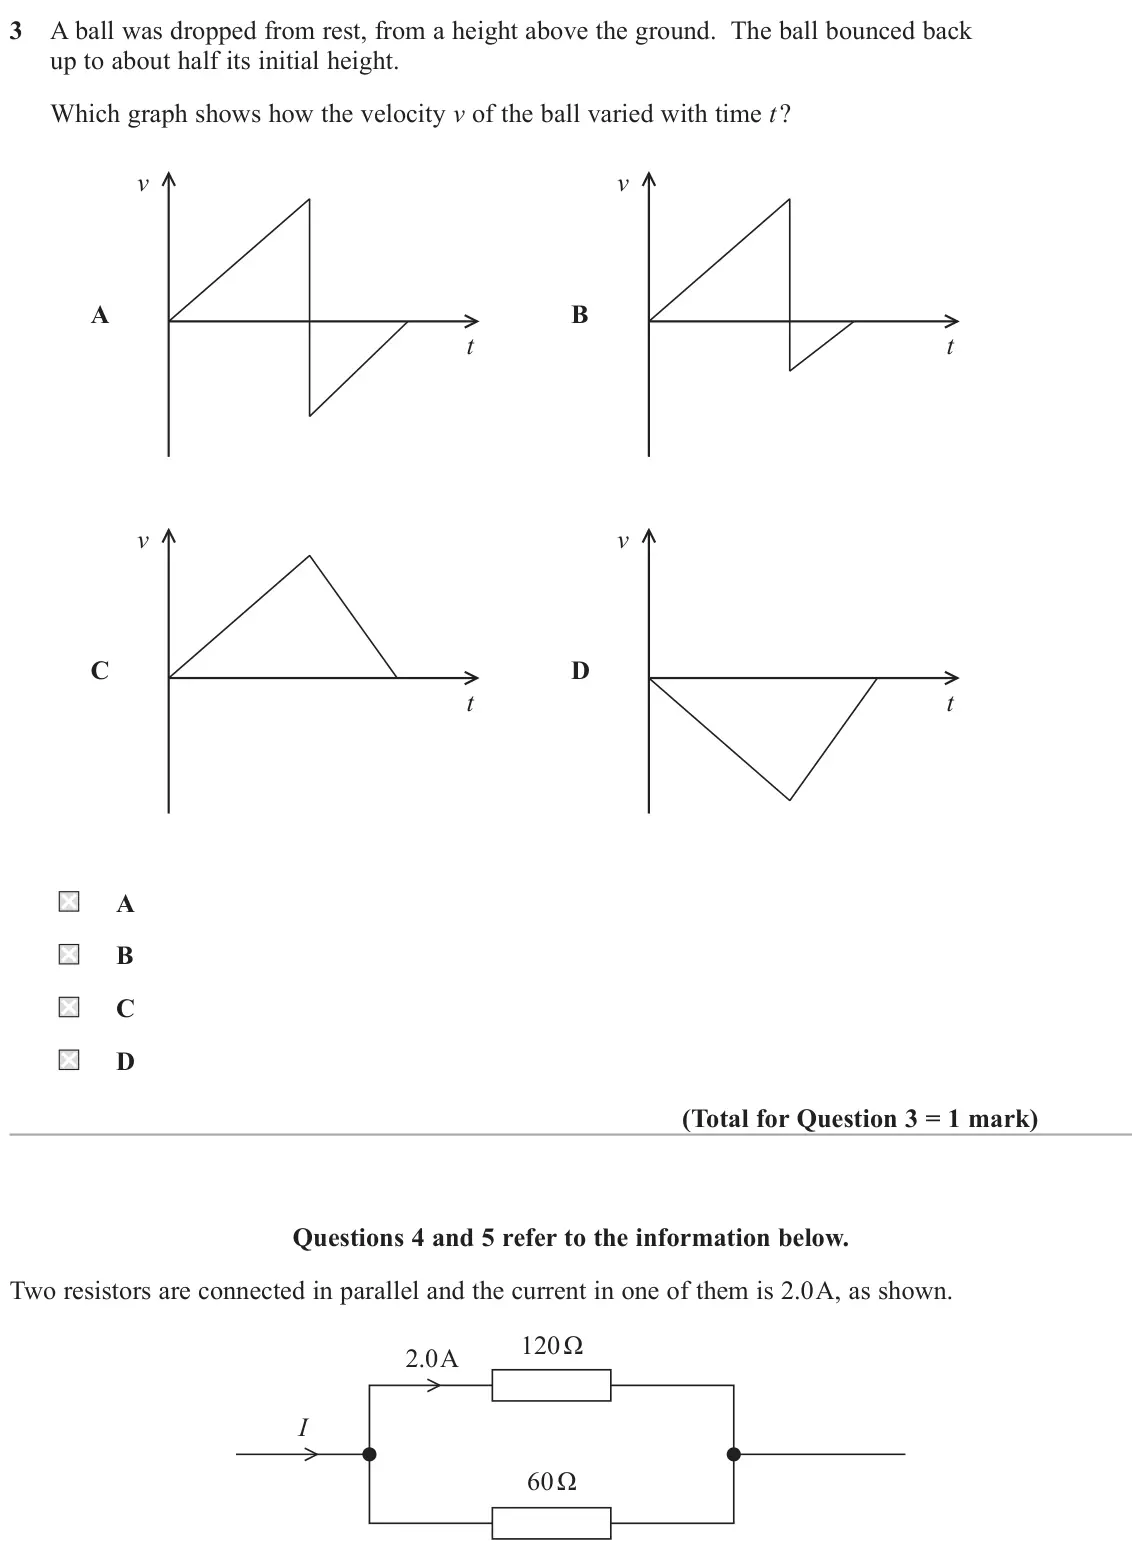
- November 2021, Paper 1, Q3 (1 mark): A ball was dropped from rest, from a height above the ground. The ball bounced back up to about half its initial height. Which graph shows how the velocity v of
- November 2021, AS Paper 1, Q11(a) (3 marks): Determine the acceleration of the skydiver when t = 4.0 s. (3) Acceleration of skydiver =
- November 2021, AS Paper 1, Q11(b) (3 marks): Determine an approximate value for the displacement of the skydiver over the first 16.0 s of the skydive. (3) Displacement of skydiver =
- November 2021, AS Paper 2, Q17(a)(i) (4 marks): Calculate the mean force from the ground on the gymnast. (4) Mean force from the ground =
- October 2020, Paper 1, Q13(b)(i) (2 marks): Show that the final velocity of the car is about 3 m s−1. Assume the acceleration is constant. (2)
- October 2020, Paper 3, Q2(a)(i) (4 marks): Explain how the terminal velocity of the ball could be determined using the phone camera recording. (4)
- October 2020, Paper 3, Q2(a)(ii) (2 marks): Explain how a systematic error could affect the value obtained for the terminal velocity. (2)
- October 2020, Paper 3, Q2(b) (2 marks): This experiment could have been attempted using a stopwatch to measure the time as the ping pong ball fell. Explain an advantage of using a phone camera rather
- October 2020, AS Paper 1, Q4 (1 mark): The graph shows how the velocity varies with time for an object. Velocity Time Which of the following graphs shows how the displacement varies with time for thi
- October 2020, AS Paper 1, Q9(a) (3 marks): Show that the velocity of the two cars at the start of the skid was about 9 m s−1. (3)
- October 2020, AS Paper 1, Q16(a)(i) (2 marks): Explain how the velocities have been calculated from the successive vertical positions of the shuttlecock. (2)
- October 2020, AS Paper 1, Q16(a)(ii) (1 mark): State why these velocities have been plotted at the mid-range of the time interval. (1)
- October 2020, AS Paper 1, Q16(a)(iv) (3 marks): Show, using the velocity-time graph, that the maximum height gained by the shuttlecock is about 3 m. (3)
- June 2019, AS Paper 1, Q3 (1 mark): A ball is dropped vertically onto a horizontal surface and bounces twice before being caught. The graph shows how the velocity of the ball varies with time for
- June 2018, Paper 1, Q14(a) (2 marks): Determine the height to which the rocket travelled. (2) Height =
- June 2018, Paper 1, Q14(b) (5 marks): Sketch the corresponding acceleration-time graph on the axes below. (5) 100 50 0 1.0 2.0 3.0 4.0 Time / s –50 –100
- June 2018, Paper 1, Q18(b)(iii) (2 marks): The two foil strips were 0.50 m apart. Calculate the horizontal velocity of the ball bearing. (2) Horizontal velocity =
- June 2018, Paper 3, Q10(a)(i) (2 marks): Calculate the average acceleration of the train during the first 120 s. (2) Average acceleration of train =
- June 2018, Paper 3, Q10(a)(ii) (3 marks): Calculate the average speed of the train for the period following the 120 s acceleration. (3) Average speed of train =
- June 2018, AS Paper 1, Q14(a) (3 marks): A track of length 23 km is available for the record attempt. Determine whether this track is long enough. (3)
- June 2018, AS Paper 1, Q14(b)(i) (1 mark): The jet engine runs throughout the car’s acceleration stage. The rocket engine runs for only part of that stage. State the time at which the rocket engine is st
- June 2018, AS Paper 1, Q14(b)(ii) (2 marks): Use the graph to determine the maximum positive acceleration of the car. (2) Maximum positive acceleration of the car =
- June 2017, Paper 1, Q17(b) (4 marks): The graph shows the data obtained from the data logger. 1.6 – 1.4 – 1.2 – 1.0 – 0.8 – 0.6 – 0.4 – 0.2 – 0 – 0 0.5 1.0 1.5 2.0 2.5 time / s Determine the velocit
- June 2017, Paper 1, Q17(c) (4 marks): The student calculated the velocity of the trolley at 2.0 s to be 1.5 m s–1. By considering the acceleration of the trolley, determine whether the student’s mea
- June 2017, AS Paper 1, Q2 (1 mark): Which of the following can be used to determine the magnitude of velocity? A area under an acceleration‑time graph B area under a velocity‑time graph C gradient
- June 2017, AS Paper 1, Q11(a) (2 marks): The car’s specification states that the minimum time for the car to accelerate from 0 to 60 miles per hour is 9.5 seconds. Show that the maximum value for the a
- June 2017, AS Paper 1, Q11(b) (3 marks): The police recorded a maximum speed for the car of 20 m s–1. The motorist knows that the speed at the start and at the end of the 120 m journey was zero. Assume
- June 2017, AS Paper 1, Q11(c) (2 marks): Explain why the assumptions about the acceleration in (b) may not be correct in practice. (2)
- June 2017, AS Paper 2, Q17(a) (3 marks): The article claims that a rider will feel weightless as they plummet from a height of 66 m. It takes 2.62 s for the car to fa
- June 2017, AS Paper 2, Q17(b) (3 marks): As mentioned in the passage, large accelerations can also be achieved by launched coasters which launch the cars horizontally
- June 2016, AS Paper 1, Q1 (1 mark): The winner of a 400m race must have the greatest A acceleration. B average speed. C instantaneous speed. D maximum speed.
- June 2016, AS Paper 1, Q6 (1 mark): The graphs shown represent the displacement-time and velocity-time graphs for the horizontal component of the motion of a ball. Horizontal Horizontal displaceme
- June 2016, AS Paper 1, Q13(b) (3 marks): A car accelerates uniformly at 3.7m s−2 as it passes a stationary road train. The initial speed of the car is 30m s−1 and it reaches the speed limit of 130km h−
Questions, mark schemes and examiner’s reports are © Pearson Edexcel, from their published past papers. Plumi isn’t affiliated with any exam board. Want whole papers? Every Edexcel A-Level Physics paper.
Rather write your answers by hand on iPad? Plumi marks them against the same mark schemes.