 plumi
Why might regeneration be needed?: Edexcel A‑Level Geography questions
Every Edexcel A-Level Geography exam question on Why might regeneration be needed? (specification points 4A.4–4A.6), 2017–2025, with its mark scheme and examiner’s report.
Find questions868
Calculations
Q3(b)
The whole paper ↗
Q3(a)(i)
The whole paper ↗
Q3(a)(ii)
The whole paper ↗
Q2(b)(i)
The whole paper ↗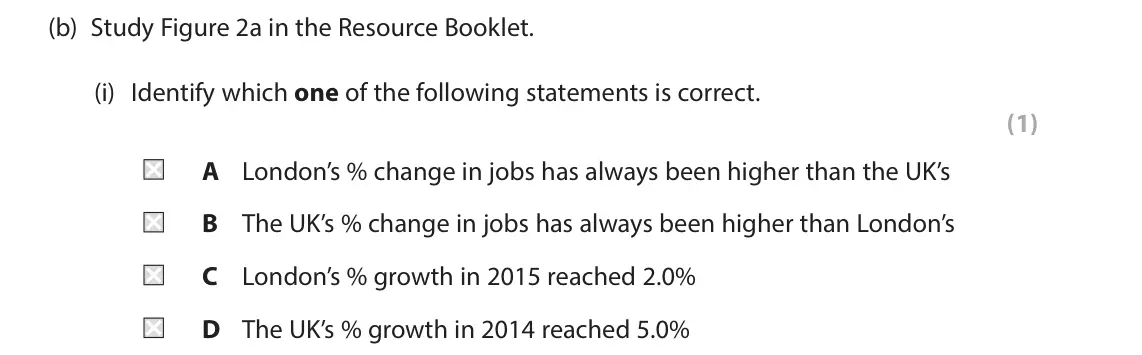
Q2(b)(ii)
The whole paper ↗
Q2(c)
The whole paper ↗
Q3(a)(i)
The whole paper ↗
Q3(a)(ii)
The whole paper ↗
Q3(b)
The whole paper ↗
Q3(c)
The whole paper ↗
Q3(b)
The whole paper ↗
Q2(a)
The whole paper ↗
Q2(b)(i)
The whole paper ↗
Q2(b)(ii)
The whole paper ↗
Q2(c)
The whole paper ↗
Q8(a)
The whole paper ↗
Q8(b)(i)
The whole paper ↗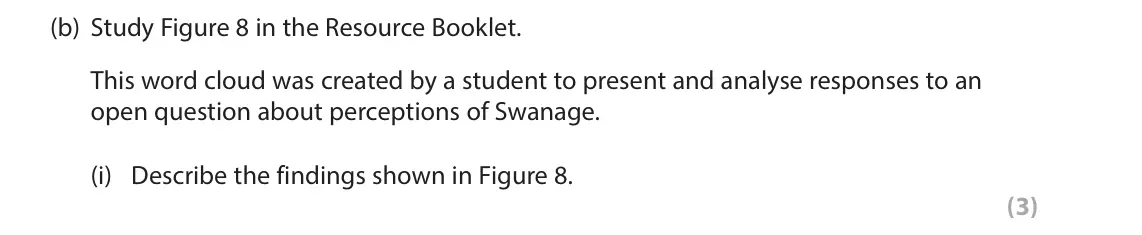
Q8(b)(ii)
The whole paper ↗
Q9(a)
The whole paper ↗
Q9(b)(i)
The whole paper ↗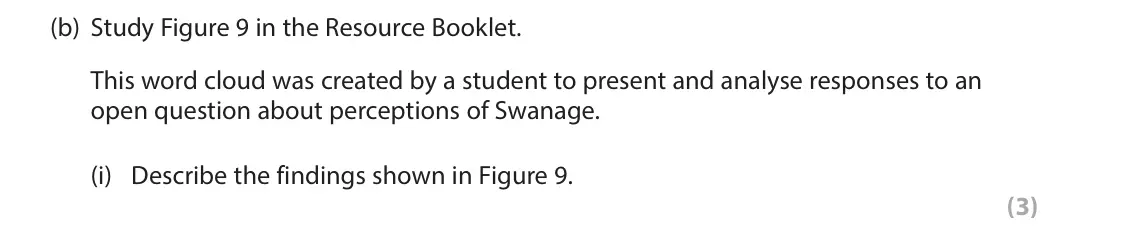
All 51 questions on Why might regeneration be needed?, as a list
- June 2025, Paper 2, Q3(b) (6 marks): Explain why some groups of people experience inequalities in rural places. (6) SECTION B The following resource relates to Question 3. Figure 2 Urban paint fest
- June 2023, Paper 2, Q3(a)(i) (3 marks): Suggest one reason why some age groups are more likely to vote than others. (3) SECTION B The following resources relate to Question 3. Age group National voter
- June 2023, Paper 2, Q3(a)(ii) (6 marks): Study Figure 1b in the Resource Booklet. Voter turnout is one measure of political engagement. Suggest why levels of deprivation may affect political engagement
- June 2023, AS Paper 2, Q2(b)(i) (1 mark): Identify which one of the following statements is correct. (1) A London’s % change in jobs has always been higher than the UK’s B The UK’s % change in jobs has
- June 2023, AS Paper 2, Q2(b)(ii) (1 mark): Calculate the difference between the % growth in jobs in London and the UK in 2011. (1) SECTION B The following resources relate to Question 2. 6.0 4.0 2.0 % gr
- June 2023, AS Paper 2, Q2(c) (3 marks): Suggest how deprivation scores for Bargate, central Southampton are useful for city authorities in decision making. You must make reference to Figure 2b in your
- June 2023, AS Paper 2, Q3(a)(i) (3 marks): Compare the environmental quality in Locations A and B. (3) 3 Study Figure 3 in the Resource Booklet. Students visited two locations in their local town. They c
- June 2023, AS Paper 2, Q3(a)(ii) (2 marks): Suggest two other criteria the students could have included in their environmental quality survey. (2) 3 Study Figure 3 in the Resource Booklet. Students visite
- June 2023, AS Paper 2, Q3(b) (4 marks): Explain how secondary data sources could be used to investigate the reasons for differences in environmental quality. (4) 3 Study Figure 3 in the Resource Bookl
- June 2023, AS Paper 2, Q3(c) (9 marks): You have also carried out fieldwork to investigate Regenerating Places. Assess the effectiveness of your data processing and presentation techniques in analysin
- June 2022, Paper 2, Q3(b) (6 marks): Explain the variations in the quality of the living environment within one local place you have studied. (6) SECTION B The following resource relates to Questio
- June 2022, AS Paper 2, Q2(a) (1 mark): State one reason successful regions have high inward migration rates. (1) SECTION B The following resource relates to Question 2. Bus Bus Bus Bus Bus stop Sharn
- June 2022, AS Paper 2, Q2(b)(i) (2 marks): Complete the table below by calculating the journey time and journey distance from Sharnford to Leicester city centre. (2) SECTION B The following resource rela
- June 2022, AS Paper 2, Q2(b)(ii) (3 marks): Suggest one way access to transport contributes to social deprivation in Sharnford. (3) SECTION B The following resource relates to Question 2. Bus Bus Bus Bus
- June 2022, AS Paper 2, Q2(c) (4 marks): Explain two reasons some groups of people living in a successful region may experience deprivation. (4) SECTION B The following resource relates to Question 2.
- June 2022, AS Paper 2, Q8(a) (2 marks): Suggest why this method was chosen. (2) 8 Students interviewed tourists on Swanage seafront as part of an investigation into perceptions of the town. They used
- June 2022, AS Paper 2, Q8(b)(i) (3 marks): Describe the findings shown in Figure 8. (3) 8 Students interviewed tourists on Swanage seafront as part of an investigation into perceptions of the town. They
- June 2022, AS Paper 2, Q8(b)(ii) (4 marks): Explain one strength and one weakness of this method of data presentation. (4) 8 Students interviewed tourists on Swanage seafront as part of an investigation i
- June 2022, AS Paper 2, Q9(a) (2 marks): Suggest why this method was chosen. (2) 9 Students interviewed local residents on Swanage seafront as part of an investigation into perceptions of the town. The
- June 2022, AS Paper 2, Q9(b)(i) (3 marks): Describe the findings shown in Figure 9. (3) 9 Students interviewed local residents on Swanage seafront as part of an investigation into perceptions of the town
- June 2022, AS Paper 2, Q9(b)(ii) (4 marks): Explain one strength and one weakness of this method of data presentation. (4) 9 Students interviewed local residents on Swanage seafront as part of an investig
- November 2021, Paper 2, Q3(a)(ii) (6 marks): Study Figure 2 in the Resource Booklet. Suggest why urban places in less successful regions may suffer from a spiral of decline. (6) SECTION B The following res
- October 2020, Paper 2, Q3(a)(ii) (6 marks): Suggest possible reasons why Hartlepool’s unemployment rates are likely to remain higher than those of England. (6) SECTION B The following resource relates to
- October 2020, AS Paper 2, Q2(a) (1 mark): Identify one way of comparing economic inequality between two places in the same country. (1) SECTION B The following resource relates to Question 2. Total dere
- October 2020, AS Paper 2, Q2(b)(i) (1 mark): Calculate the mean value for derelict land area for the local authorities shown. Give your answer to 1 decimal place. (1) SECTION B The following resource relat
- October 2020, AS Paper 2, Q2(b)(ii) (1 mark): Calculate the median value for derelict area for the local authorities shown. (1) SECTION B The following resource relates to Question 2. Total derelict land Lo
- October 2020, AS Paper 2, Q2(c) (4 marks): Describe two different viewpoints shown in media sources about the need for regeneration in your chosen local place. (4) SECTION B The following resource relate
- October 2020, AS Paper 2, Q3(a)(i) (2 marks): Describe the change in the level of multiple deprivation along the transect. (2) 3 Study Figure 4 in the Resource Booklet. A group of students travelled by mini
- October 2020, AS Paper 2, Q3(a)(ii) (2 marks): State one advantage and one disadvantage of displaying data using a choropleth map, as shown in Figure 4. (2) 3 Study Figure 4 in the Resource Booklet. A group
- October 2020, AS Paper 2, Q3(a)(iii) (1 mark): State a suitable null hypothesis the students could use to test the relationship between environmental quality and multiple deprivation. (1) 3 Study Figure 4 in
- October 2020, AS Paper 2, Q3(a)(iv) (2 marks): Complete the missing data in Figure 5 below. (2) Level of IMD Rank of EQS score (0–20) Rank of Difference Difference in ranks (1 = most deprived) IMD 0 = lowest
- October 2020, AS Paper 2, Q3(a)(v) (2 marks): Explain why they should accept or reject their null hypothesis. (2) 3 Study Figure 4 in the Resource Booklet. A group of students travelled by minibus along the
- October 2020, AS Paper 2, Q3(b) (9 marks): You have also carried out fieldwork about Regenerating Places. Assess the accuracy and reliability of the methods used to collect primary data for your own enqu
- June 2019, Paper 2, Q3(a)(i) (3 marks): Suggest one reason why economic regeneration is needed in some places more than others. (3) SECTION B The following resource relates to Question 3a. N Edinburgh
- June 2019, Paper 2, Q3(c) (20 marks): With reference to Figure 2a and 2b in the Resource Booklet and your own knowledge and understanding: Evaluate the reasons why some regions are more successful t
- June 2019, AS Paper 2, Q2(a) (1 mark): Define the term ‘lived experience of a place’. (1) SECTION B The following resources relate to Question 2. % Voted % Did not vote 18–19 57 43 59 41 20–24 25–29
- June 2019, AS Paper 2, Q2(b) (1 mark): Identify which one of the following statements is correct. (1) A The highest percentage who did not vote were aged 30–39 B Fewer aged over 70 years voted than t
- June 2019, AS Paper 2, Q2(c)(i) (1 mark): Calculate the percentage (%) of those who voted, with ‘Medium’ qualifications. (1) SECTION B The following resources relate to Question 2. % Voted % Did not vot
- June 2019, AS Paper 2, Q2(c)(ii) (3 marks): Suggest one reason why those with a ‘Low’ educational level were less likely to vote. (3) SECTION B The following resources relate to Question 2. % Voted % Did
- June 2019, AS Paper 2, Q3(a)(i) (3 marks): Describe the variation in average house prices from central to east London. (3) 3 A student used secondary data about average house prices along a transect in L
- June 2019, AS Paper 2, Q3(a)(ii) (2 marks): State one strength and one weakness of using average data to compare areas. (2) 3 A student used secondary data about average house prices along a transect in L
- June 2019, AS Paper 2, Q3(b) (4 marks): Explain how one qualitative and one quantitative technique could be used as part of the student’s primary data collection into regeneration. (4) 3 A student use
- June 2019, AS Paper 2, Q3(c) (9 marks): You have also carried out fieldwork and research into Regenerating Places. Assess the contribution of the secondary research data you used in investigating your
- June 2019, AS Paper 2, Q4 (16 marks): Study Figures 4a, 4b, 4c, and 4d in the Resource Booklet. Evaluate the extent to which Brighton could be described as a successful city. (16) The following reso
- June 2018, Paper 2, Q3(c) (20 marks): For your local place and your contrasting place, evaluate the view that low income is the most important factor leading to deprivation. (20) SECTION B The follo
- June 2018, AS Paper 2, Q2(d) (6 marks): Explain the factors that may lead residents to have a low level of engagement in their local community. (6) SECTION B The following resource relates to Question
- June 2017, AS Paper 2, Q2(b)(i) (1 mark): Plot the data for Hamburg on Figure 2. (1)
- June 2017, AS Paper 2, Q2(b)(ii) (1 mark): Calculate the interquartile range for the completed set of data. (1)
- June 2017, AS Paper 2, Q2(b)(iii) (3 marks): Suggest one reason why unemployment rates differ across developed countries such as Germany. (3)
- June 2017, AS Paper 2, Q2(c) (4 marks): Explain two reasons why different urban community groups may have contrasting views about regeneration. (4)
- June 2017, AS Paper 2, Q3(b) (4 marks): Explain one advantage and one disadvantage of using oral accounts in fieldwork. (4) 3 A student collected fieldwork data on how environmental quality varied wit
Questions, mark schemes and examiner’s reports are © Pearson Edexcel, from their published past papers. Plumi isn’t affiliated with any exam board. Want whole papers? Full past papers.
Rather write your answers by hand on iPad? Plumi marks them against the same mark schemes.