 plumi
Why are some locations more at risk from tectonic hazards?: Edexcel A‑Level Geography questions
Every Edexcel A-Level Geography exam question on Why are some locations more at risk from tectonic hazards? (specification points 1.1–1.3), 2017–2025, with its mark scheme and examiner’s report.
Find questions868
Calculations
Q1(a)(i)
The whole paper ↗
Q1(a)(ii)
The whole paper ↗
Q1(a)(iii)
The whole paper ↗
Q1(b)(i)
The whole paper ↗
Q1(b)(ii)
The whole paper ↗
Q1(c)
The whole paper ↗
Q1(d)
The whole paper ↗
Q1(e)
The whole paper ↗
Q1(a)
The whole paper ↗
Q1(d)
The whole paper ↗
Q1(c)
The whole paper ↗
Q1(a)(i)
The whole paper ↗
Q1(a)(ii)
The whole paper ↗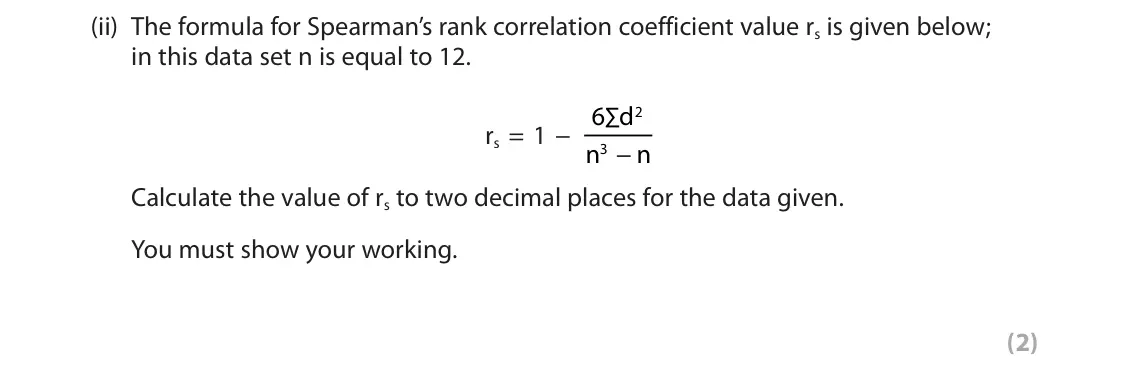
Q1(a)(iii)
The whole paper ↗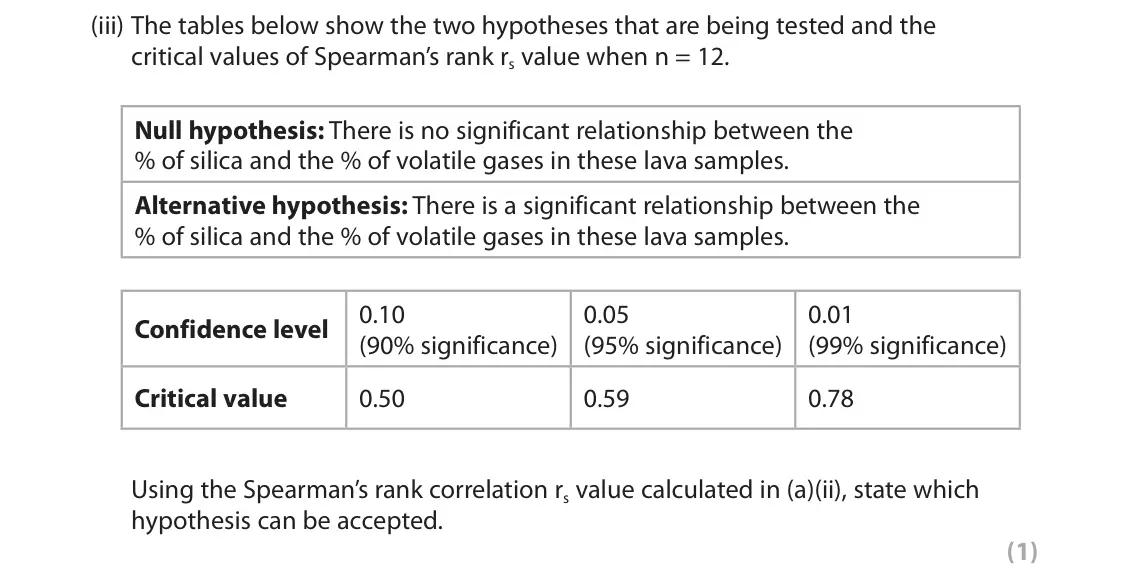
Q1(a)
The whole paper ↗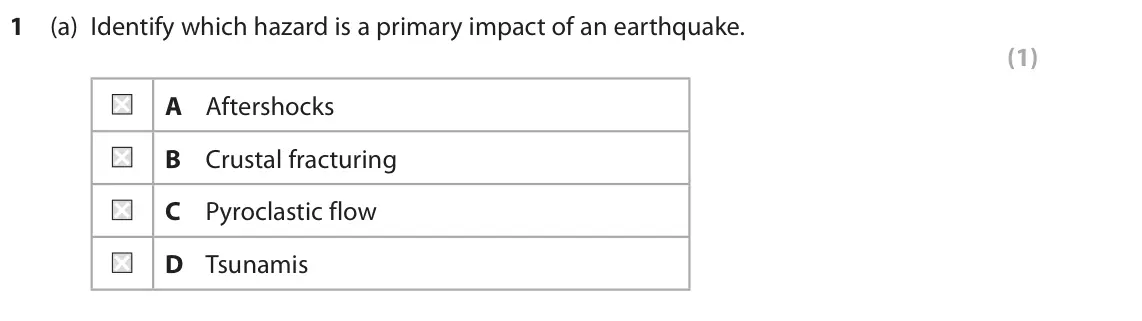
Q1(b)(i)
The whole paper ↗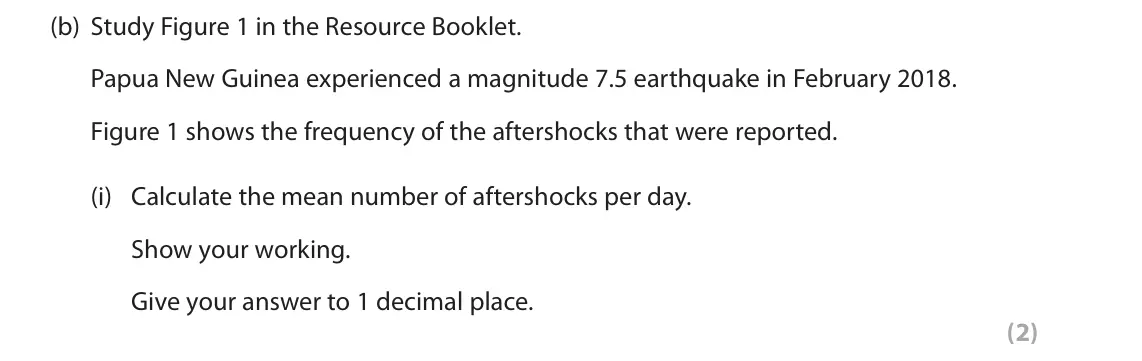
Q1(b)(ii)
The whole paper ↗
Q1(d)
The whole paper ↗

Q1(a)
The whole paper ↗
All 32 questions on Why are some locations more at risk from tectonic hazards?, as a list
- June 2025, AS Paper 1, Q1(a)(i) (1 mark): Identify the type of plate margin shown at Y in Figure 1a. (1) SECTION A The following resource relates to Question 1. 30°E 60°E 90°E INDIA Indo-Eurasian Plate
- June 2025, AS Paper 1, Q1(a)(ii) (2 marks): Describe the plate movement shown in Figure 1a and Figure 1b. (2) SECTION A The following resource relates to Question 1. 30°E 60°E 90°E INDIA Indo-Eurasian Pla
- June 2025, AS Paper 1, Q1(a)(iii) (3 marks): Suggest one way plate tectonic theory helps explain the changing position of the plates shown in Figure 1a and Figure 1b. (3) SECTION A The following resource r
- June 2024, AS Paper 1, Q1(b)(i) (2 marks): Compare the distribution of aftershocks between the two earthquakes. (2) SECTION A The following resource relates to Question 1. N Caribbean Sea Port-au-Prince
- June 2024, AS Paper 1, Q1(b)(ii) (3 marks): Suggest one reason for the different pattern of aftershocks shown in 2021. (3) SECTION A The following resource relates to Question 1. N Caribbean Sea Port-au-P
- June 2024, AS Paper 1, Q1(c) (4 marks): Explain two hazards caused by volcanoes. (4) SECTION A The following resource relates to Question 1. N Caribbean Sea Port-au-Prince Jeremie 20km Earthquake epic
- June 2024, AS Paper 1, Q1(d) (6 marks): Explain the global distribution of earthquake hazards. (6) SECTION A The following resource relates to Question 1. N Caribbean Sea Port-au-Prince Jeremie 20km E
- June 2024, AS Paper 1, Q1(e) (12 marks): Assess the view that the most severe volcanic disasters occur on destructive plate boundaries. (12) SECTION A The following resource relates to Question 1. N Ca
- June 2023, AS Paper 1, Q1(a) (1 mark): State one hazard caused by an earthquake. (1) SECTION A The following resources relate to Question 1. 7.5 7.0 Earthquake 6.5 magnitude (MMS) 6.0 5.5 5.0 1995 20
- June 2023, AS Paper 1, Q1(d) (6 marks): Explain the global distribution of volcanic eruptions. (6) SECTION A The following resources relate to Question 1. 7.5 7.0 Earthquake 6.5 magnitude (MMS) 6.0 5.
- June 2022, AS Paper 1, Q1(c) (4 marks): Explain two tectonic processes that occur at a convergent plate margin. (4) SECTION A The following resources relate to Question 1. N 15 km Box A 5 km Figure 1a
- October 2020, Paper 1, Q1(a)(i) (1 mark): Complete Figure 1 by calculating ∑d2. (1) 1 Study Figure 1 below. This data in Figure 1 was collected to investigate whether there was a significant relationshi
- October 2020, Paper 1, Q1(a)(ii) (2 marks): The formula for Spearman’s rank correlation coefficient value rs is given below; in this data set n is equal to 12. 6∑d 2 rs = 1 − n − n 3 Calculate the value o
- October 2020, Paper 1, Q1(a)(iii) (1 mark): The tables below show the two hypotheses that are being tested and the critical values of Spearman’s rank rs value when n = 12. Null hypothesis: There is no sig
- October 2020, AS Paper 1, Q1(a) (1 mark): Identify which hazard is a primary impact of an earthquake. (1) A Aftershocks B Crustal fracturing C Pyroclastic flow D Tsunamis SECTION A The following resourc
- October 2020, AS Paper 1, Q1(b)(i) (2 marks): Calculate the mean number of aftershocks per day. Show your working. Give your answer to 1 decimal place. (2) SECTION A The following resource relates to Questi
- October 2020, AS Paper 1, Q1(b)(ii) (3 marks): Suggest one reason for the changing number of aftershocks each day. (3) SECTION A The following resource relates to Question 1. 60 50 40 30 20 10 0 Day 1 Day 2
- October 2020, AS Paper 1, Q1(d) (6 marks): Explain why some tectonic hazards occur away from plate boundaries. (6) SECTION A The following resource relates to Question 1. 60 50 40 30 20 10 0 Day 1 Day 2
- June 2019, Paper 3, Q3 (8 marks): Study Figure 1 and Figure 2 in Section A of the Resource Booklet. Analyse the pattern of earthquakes in Japan and its surrounding region. (8) SECTION A Japan –
- June 2019, AS Paper 1, Q1(a) (1 mark): State which type of earthquake wave travels fastest. (1) SECTION A The following resources relate to Question 1. 6 February 2016 13 November 2016 Magnitude 6.4
- June 2019, AS Paper 1, Q1(b)(i) (2 marks): Compare the distribution of reported ground shaking between the February and November earthquakes. (2) SECTION A The following resources relate to Question 1. 6
- June 2019, AS Paper 1, Q1(b)(ii) (3 marks): Suggest one reason for the pattern of reported ground shaking in the February earthquake. (3) SECTION A The following resources relate to Question 1. 6 February
- June 2019, AS Paper 1, Q1(d) (6 marks): Explain how plate tectonic theory is used to explain plate movements. (6) SECTION A The following resources relate to Question 1. 6 February 2016 13 November 20
- June 2018, Paper 1, Q1(a)(i) (2 marks): Calculate the average monthly frequency of earthquakes at the two plate boundaries. You must show your working. (2) SECTION A The following resource relates to
- June 2018, Paper 1, Q1(a)(ii) (1 mark): A Student’s t-test was used to determine whether there was a statistical difference in the mean focal depth of the earthquakes at the two plate boundaries. Two
- June 2018, Paper 1, Q1(a)(iii) (1 mark): Study Figure 1c below. 0.10 (90% 0.05 (95% 0.01 (99% Confidence level significance) significance) significance) Critical value of 1.6 2.0 2.6 Student’s t-test F
- June 2018, AS Paper 1, Q1(a) (1 mark): State one tectonic hazard that can cause coastal flooding. (1) SECTION A The following resource relates to Question 1. 250 200 150 100 50 0 1996 1998 2000 2002
- June 2018, AS Paper 1, Q1(c) (4 marks): Explain two characteristics of volcanic hotspots. (4) SECTION A The following resource relates to Question 1. 250 200 150 100 50 0 1996 1998 2000 2002 2004 2006
- June 2018, AS Paper 1, Q1(d) (6 marks): Explain why volcanic eruptions vary in their magnitude. (6) SECTION A The following resource relates to Question 1. 250 200 150 100 50 0 1996 1998 2000 2002 200
- June 2017, AS Paper 1, Q1(a) (1 mark): Plate movement can be explained by several processes. Identify one process that occurs only at destructive plate boundaries. (1) A Mantle convection B Sea floor
- June 2017, AS Paper 1, Q1(c) (4 marks): Explain two secondary hazards caused by earthquakes. (4) SECTION A The following resource relates to Question 1. Japan Ecuador • Magnitude 7.0 • Magnitude 7.8 •
- June 2017, AS Paper 1, Q1(d) (6 marks): Explain the tectonic hazards that may result from volcanic activity. (6) SECTION A The following resource relates to Question 1. Japan Ecuador • Magnitude 7.0 •
Questions, mark schemes and examiner’s reports are © Pearson Edexcel, from their published past papers. Plumi isn’t affiliated with any exam board. Want whole papers? Full past papers.
Rather write your answers by hand on iPad? Plumi marks them against the same mark schemes.