 plumi
How do population structures vary?: Edexcel A‑Level Geography questions
Every Edexcel A-Level Geography exam question on How do population structures vary? (specification points 4B.1–4B.3), 2017–2025, with its mark scheme and examiner’s report.
Find questions868
Calculations
Q5(a)
The whole paper ↗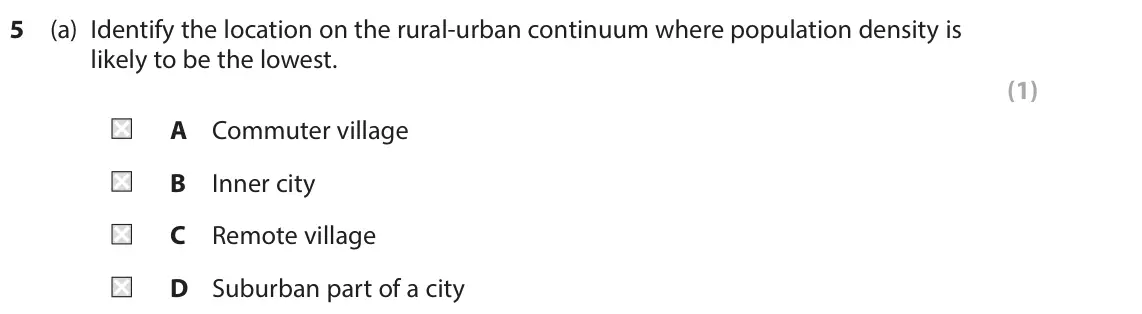
Q5(b)(i)
The whole paper ↗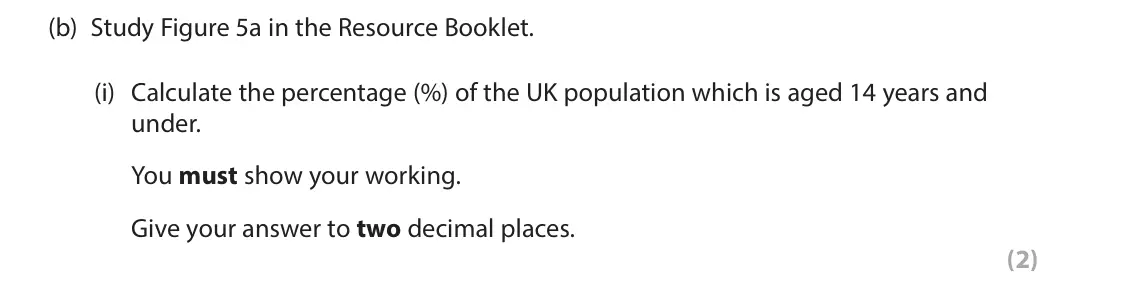
Q5(b)(ii)
The whole paper ↗
Q5(c)
The whole paper ↗
Q5(d)
The whole paper ↗
Q4(a)(i)
The whole paper ↗
Q4(c)
The whole paper ↗
Q5(a)
The whole paper ↗
Q4(b)
The whole paper ↗
Q4(a)(i)
The whole paper ↗
Q4(a)(ii)
The whole paper ↗
Q4(c)
The whole paper ↗
Q4(e)
The whole paper ↗
Q4(a)(i)
The whole paper ↗
Q4(a)(ii)
The whole paper ↗
Q4(b)
The whole paper ↗
Q4(a)(i)
The whole paper ↗
Q4(a)(ii)
The whole paper ↗
Q4(b)
The whole paper ↗
All 33 questions on How do population structures vary?, as a list
- June 2025, AS Paper 2, Q5(a) (1 mark): Identify the location on the rural-urban continuum where population density is likely to be the lowest. (1) A Commuter village B Inner city C Remote village D S
- June 2025, AS Paper 2, Q5(b)(i) (2 marks): Calculate the percentage (%) of the UK population which is aged 14 years and under. You must show your working. Give your answer to two decimal places. (2) SECT
- June 2025, AS Paper 2, Q5(b)(ii) (3 marks): Suggest one way the accessibility of rural places in the UK affects their population structure. (3) SECTION C The following resources relate to Question 5. Tota
- June 2025, AS Paper 2, Q5(c) (4 marks): Explain two ways physical factors influence cultural diversity in one of your chosen places. (4) SECTION C The following resources relate to Question 5. Total U
- June 2025, AS Paper 2, Q5(d) (6 marks): Explain how international influences have shaped the characteristics of one of your chosen places. (6) SECTION C The following resources relate to Question 5. T
- June 2024, Paper 2, Q4(a)(i) (3 marks): Suggest one way the photographs show that population change has taken place in Brick Lane, London. (3) The following resources relate to Question 4. Figure 2a B
- June 2024, Paper 2, Q4(c) (20 marks): Evaluate the extent to which past and present connections shape the demographic and cultural characteristics of your chosen place. (20) The following resources
- June 2024, AS Paper 2, Q5(a) (1 mark): State one reason for different levels of cultural diversity in places. (1) SECTION C The following resources relate to Question 5. Total number of shops 209 Tot
- June 2023, Paper 2, Q4(b) (6 marks): Explain why your two chosen places have contrasting levels of cultural diversity. (6) The following resources relate to Question 4. Town (region) Lewes Middlesb
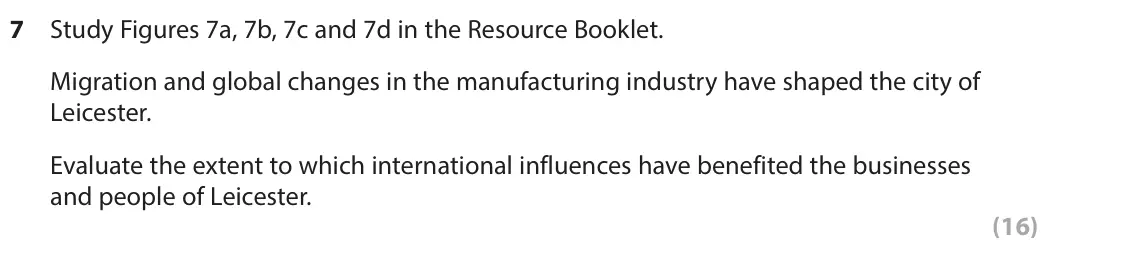
- June 2023, AS Paper 2, Q7 (16 marks): Study Figures 7a, 7b, 7c and 7d in the Resource Booklet. Migration and global changes in the manufacturing industry have shaped the city of Leicester. Evaluate
- June 2022, Paper 2, Q4(a)(i) (3 marks): Suggest one reason for the difference in birth rates in these areas. (3) The following resource relates to Question 4. Broomhill Bedminster % aged 65 and over 1
- June 2022, Paper 2, Q4(a)(ii) (6 marks): Explain why there may be changes over time in the population characteristics of these areas. (6) The following resource relates to Question 4. Broomhill Bedmins
- June 2022, Paper 2, Q4(c) (20 marks): Evaluate the impact of government decisions on the demographic and cultural characteristics of either urban or rural places. (20) The following resource relates
- June 2022, AS Paper 2, Q4(e) (12 marks): Assess the extent to which national influences have benefited your chosen places. (12) SECTION C The following resource relates to Question 4. Bus Bus Bus Bus B
- November 2021, Paper 2, Q4(a)(i) (3 marks): Suggest one reason the percentage of foreign-born people differs between urban places. (3) The following resource relates to Question 4. Urban area (region) Cov
- November 2021, Paper 2, Q4(a)(ii) (6 marks): Study Figure 3 in the Resource Booklet. Suggest why urban places have different population growth rates. (6) The following resource relates to Question 4. Urban
- November 2021, Paper 2, Q4(b) (6 marks): You have studied your local place and a contrasting place. Explain the changes in the cultural characteristics of one of these places. (6) The following resourc
- October 2020, Paper 2, Q4(a)(i) (3 marks): Suggest one reason why the population structures of Newcastle‑upon‑Tyne and Northumberland differ. (3) 4 Study Figures 4a and 4b in the Resource Booklet. The fo
- October 2020, Paper 2, Q4(a)(ii) (6 marks): Suggest reasons for the different levels of cultural diversity between Newcastle‑upon‑Tyne and Northumberland. (6) 4 Study Figures 4a and 4b in the Resource Boo
- October 2020, Paper 2, Q4(b) (6 marks): Explain how regional and national influences have shaped the demographic characteristics of your local place. (6) 4 Study Figures 4a and 4b in the Resource Book
- June 2019, AS Paper 2, Q5(b) (1 mark): Calculate the percentage (%) of those who were aged 15–64 in Manchester. (1) SECTION C The following resources relate to Question 5. 100 90 80 70 Age group (yea
- June 2018, Paper 2, Q4(c) (20 marks): For your local place and your contrasting place, evaluate the view that international migration has an important impact on their population characteristics. (20
- June 2018, AS Paper 2, Q5(a) (1 mark): Which of the following is likely to increase population density? (1) A Higher fertility rate than death rate B Lower birth rate than death rate C Higher death r
- June 2018, AS Paper 2, Q5(e) (12 marks): Assess whether the cultural characteristics of your local place and contrasting place are the result of global influences. (12) SECTION C The following resource
- June 2017, AS Paper 2, Q5(a) (1 mark): Define the term industrialisation. (1)
- June 2017, AS Paper 2, Q5(b)(i) (1 mark): Plot the data for Hungary on Figure 5. (1)
- June 2017, AS Paper 2, Q5(b)(ii) (1 mark): Calculate the interquartile range for the completed set of data. (1)
- June 2017, AS Paper 2, Q5(b)(iii) (3 marks): Suggest one reason why fertility rates differ across Europe. (3)
- June 2017, AS Paper 2, Q5(d) (6 marks): For a local place that you have studied, explain why people’s sense of identity has been affected by the demographic and cultural change it has experienced. (6)
- June 2017, AS Paper 2, Q6(a)(i) (2 marks): Complete the statistical test by filling in the table below. (2) Distance from Rank distance Index of Rank ethnic Difference d² Birmingham ethnic diversity betw
- June 2017, AS Paper 2, Q6(a)(ii) (1 mark): The student determined that there was a strong negative correlation between ethnic diversity and distance from the centre of Birmingham. Explain what is meant b
- June 2017, AS Paper 2, Q6(a)(iii) (2 marks): Give two possible reasons for the relationship between ethnic diversity and distance from the centre of Birmingham. (2) 6 A student collected fieldwork data usi
- June 2017, AS Paper 2, Q6(c) (9 marks): You have also carried out fieldwork into Diverse Places. Assess how the sampling procedures and sample sizes affected your results. (9) 6 A student collected fi
Questions, mark schemes and examiner’s reports are © Pearson Edexcel, from their published past papers. Plumi isn’t affiliated with any exam board. Want whole papers? Full past papers.
Rather write your answers by hand on iPad? Plumi marks them against the same mark schemes.