 plumi
Output gaps: Edexcel A‑Level Economics A questions
Every Edexcel A-Level Economics A exam question on 2.5.2 Output gaps, 2016–2025, with its mark scheme and examiner’s report.
Find questions784
Calculations
Q3(a)
The whole paper ↗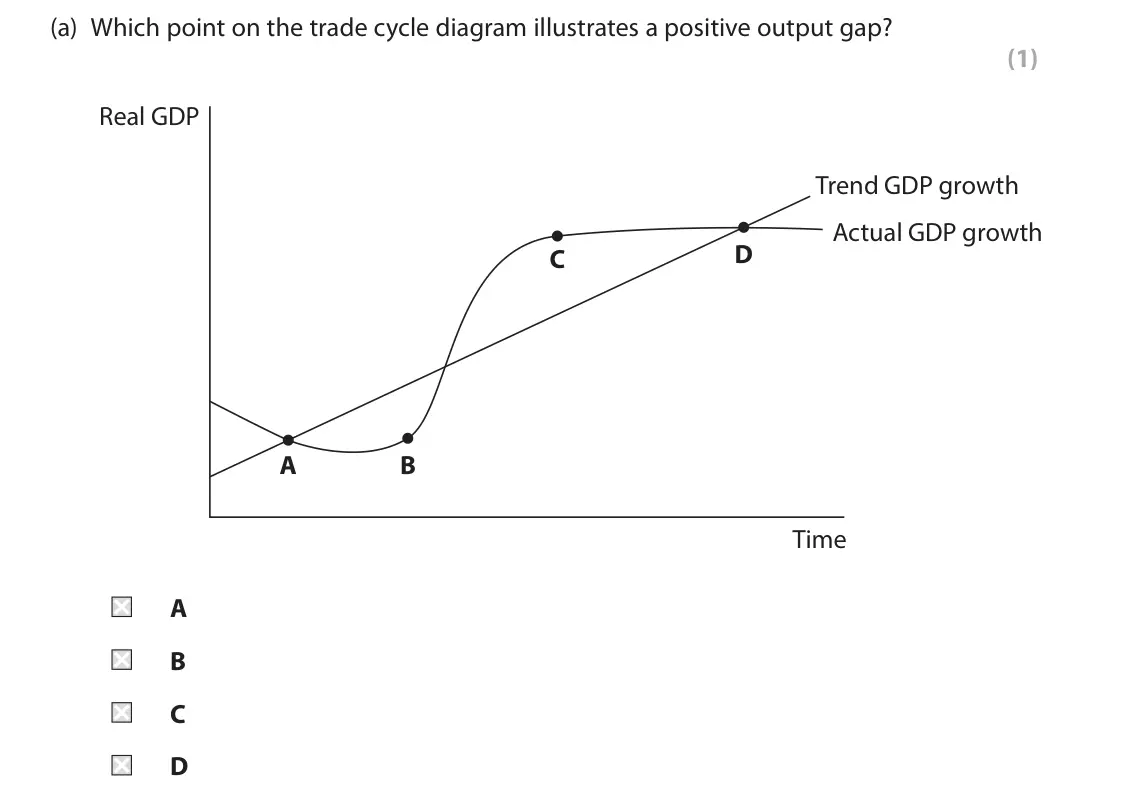
Q3(b)
The whole paper ↗
Q4(a)
The whole paper ↗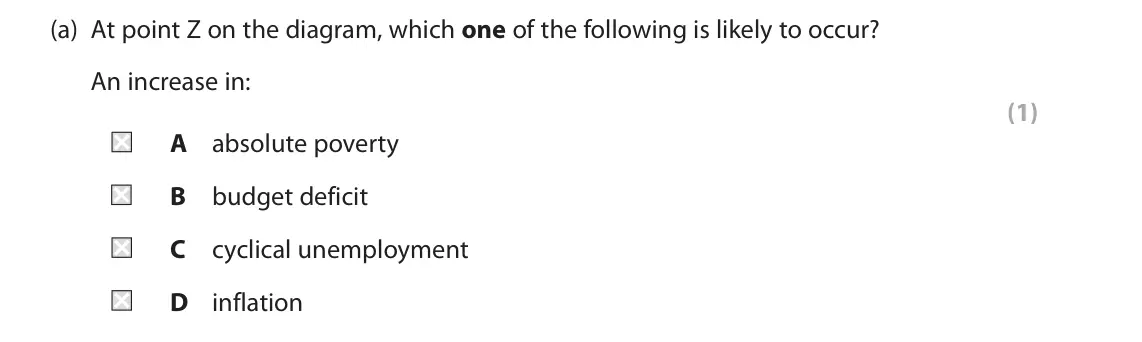
Q5(b)
The whole paper ↗
Q6(e)
The whole paper ↗
Q2(b)
The whole paper ↗
Q2(c)
The whole paper ↗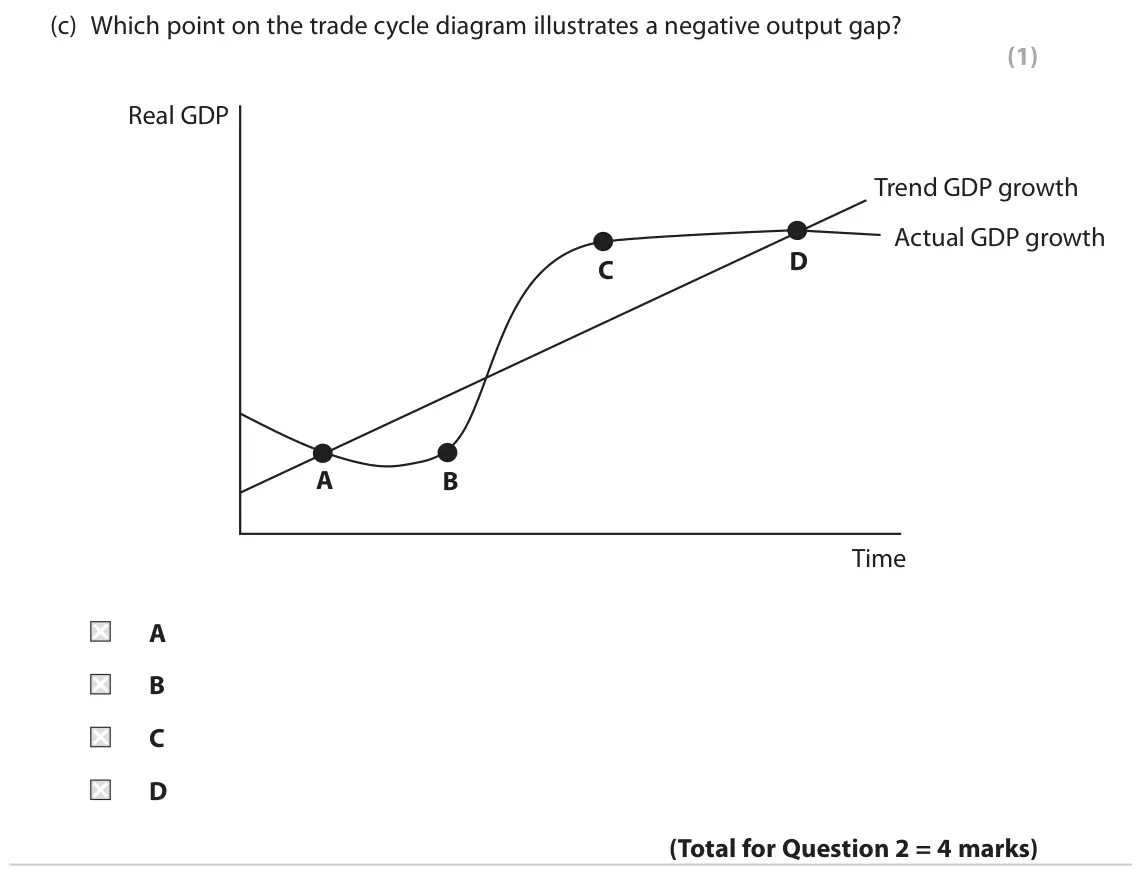
Q2(a)
The whole paper ↗
Q3(c)
The whole paper ↗
All 9 questions on Output gaps, as a list
- June 2025, AS Paper 2, Q3(a) (1 mark): Which point on the trade cycle diagram illustrates a positive output gap? (1) Real GDP Trend GDP growth Actual GDP growth D C A B Time A B C D 3 It was forecast
- June 2025, AS Paper 2, Q3(b) (2 marks): Explain one reason why it is difficult to measure the size of an output gap in an economy. (2) 3 It was forecast that the UK will experience a positive output g
- June 2022, Paper 2, Q4(a) (1 mark): At point Z on the diagram, which one of the following is likely to occur? An increase in: (1) A absolute poverty B budget deficit C cyclical unemployment D infl
- October 2020, Paper 2, Q5(b) (1 mark): Which one of the following would be most likely to solve a negative output gap problem in a domestic economy? An increase in (1) A government funding to the Wor
- October 2020, AS Paper 2, Q6(e) (15 marks): Discuss the factors that might explain why ‘the UK’s forecast long-term trend rate of growth was reduced’ (Extract B lines 9–10). (15) Read Figures 1 and 2 and
- June 2019, AS Paper 2, Q2(b) (2 marks): Explain what is meant by spare capacity in an economy. (2)
- June 2018, AS Paper 2, Q2(c) (1 mark): Which point on the trade cycle diagram illustrates a negative output gap? (1) Real GDP Trend GDP growth Actual GDP growth D C A B Time A B C D
- June 2017, Paper 3, Q2(a) (5 marks): With reference to Extract D (line 18), explain the meaning of the term ‘output gap’. Use an aggregate demand and aggregate supply diagram in your answer. (5) Re
- June 2017, AS Paper 2, Q3(c) (1 mark): Illustrate a negative output gap on the diagram below. (1) 3 Real GDP in selected economies (the base year 2008=100) 110 108 106 104 102 Index 100 98 96 94 92 0
Questions, mark schemes and examiner’s reports are © Pearson Edexcel, from their published past papers. Plumi isn’t affiliated with any exam board. Want whole papers? Full past papers.
Rather write your answers by hand on iPad? Plumi marks them against the same mark schemes.