 plumi
Scatter graphs and correlation: AQA GCSE Maths questions
Every AQA GCSE Maths exam question on S6 Scatter graphs and correlation, 2017–2025, with its mark scheme and examiner’s report.
Find questions1,304
Exam
All years
Calculator
All 5 questions on Scatter graphs and correlation, as a list
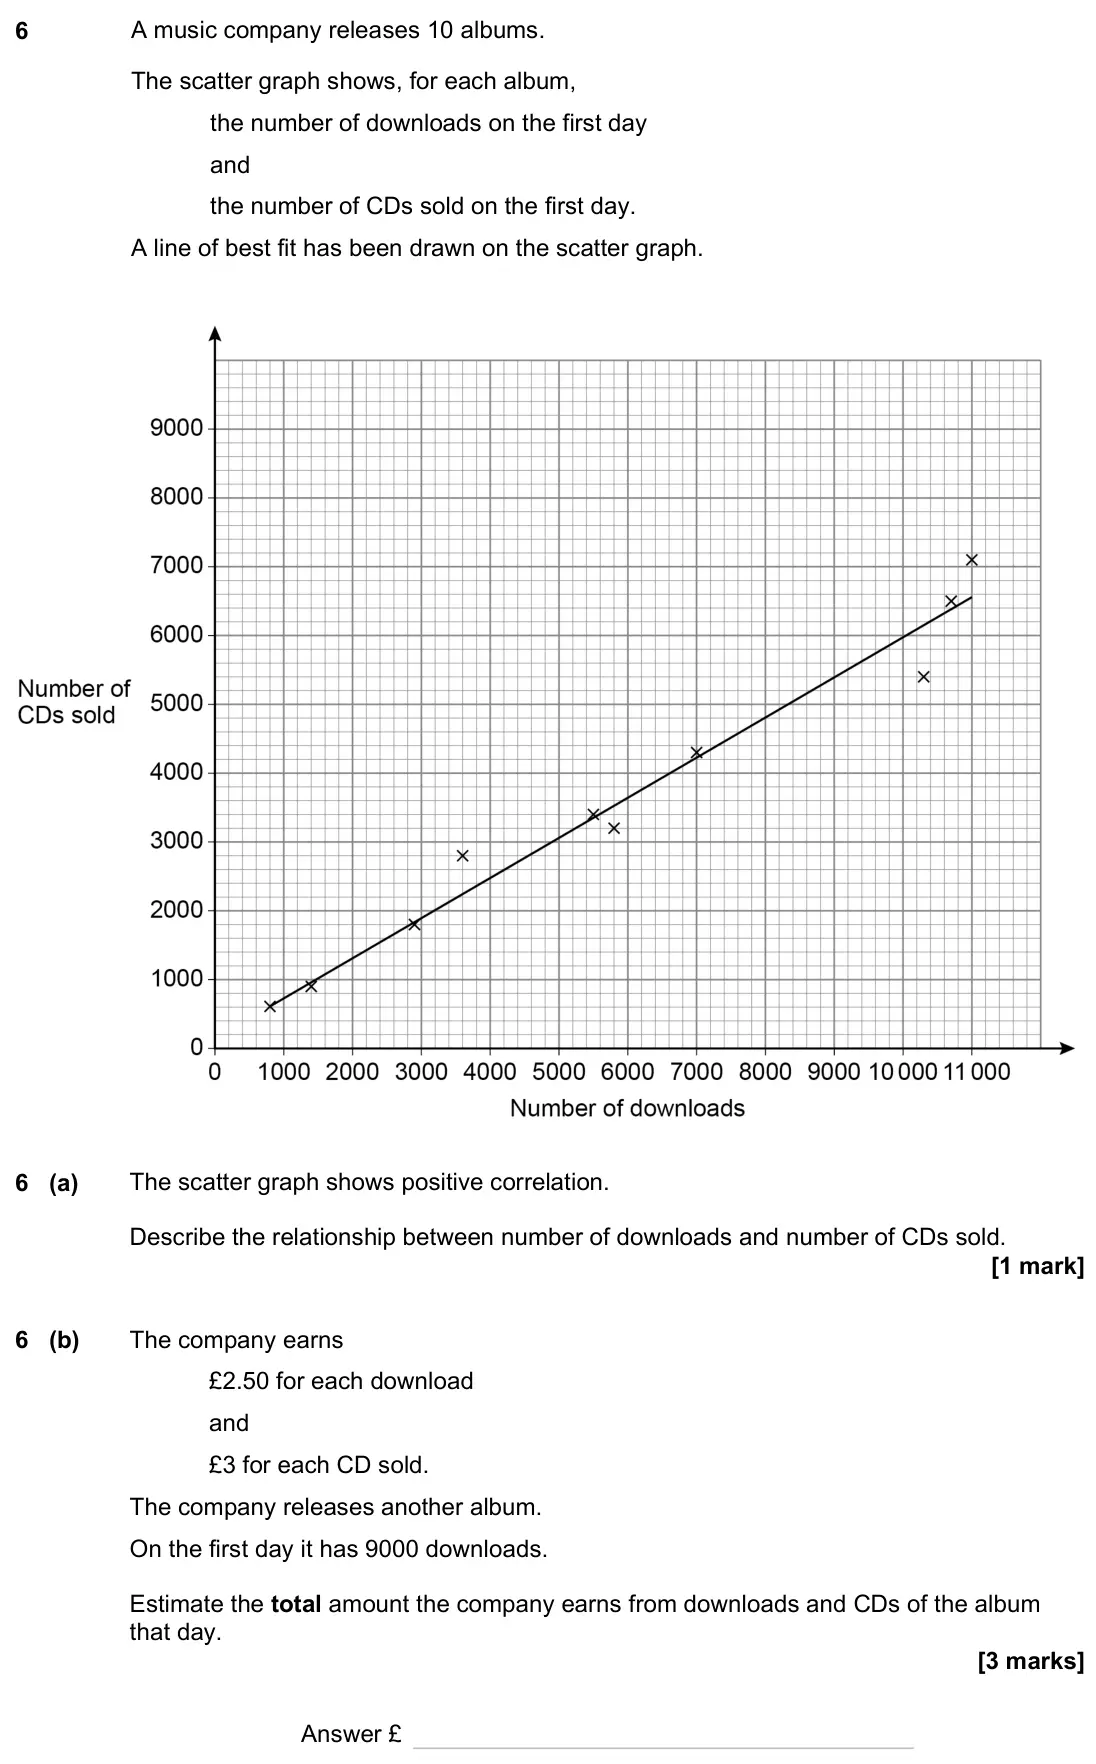
- November 2023, Paper 1H, Q6 (4 marks): A music company releases 10 albums. The scatter graph shows, for each album, the number of downloads on the first day and the number of CDs sold on the first da
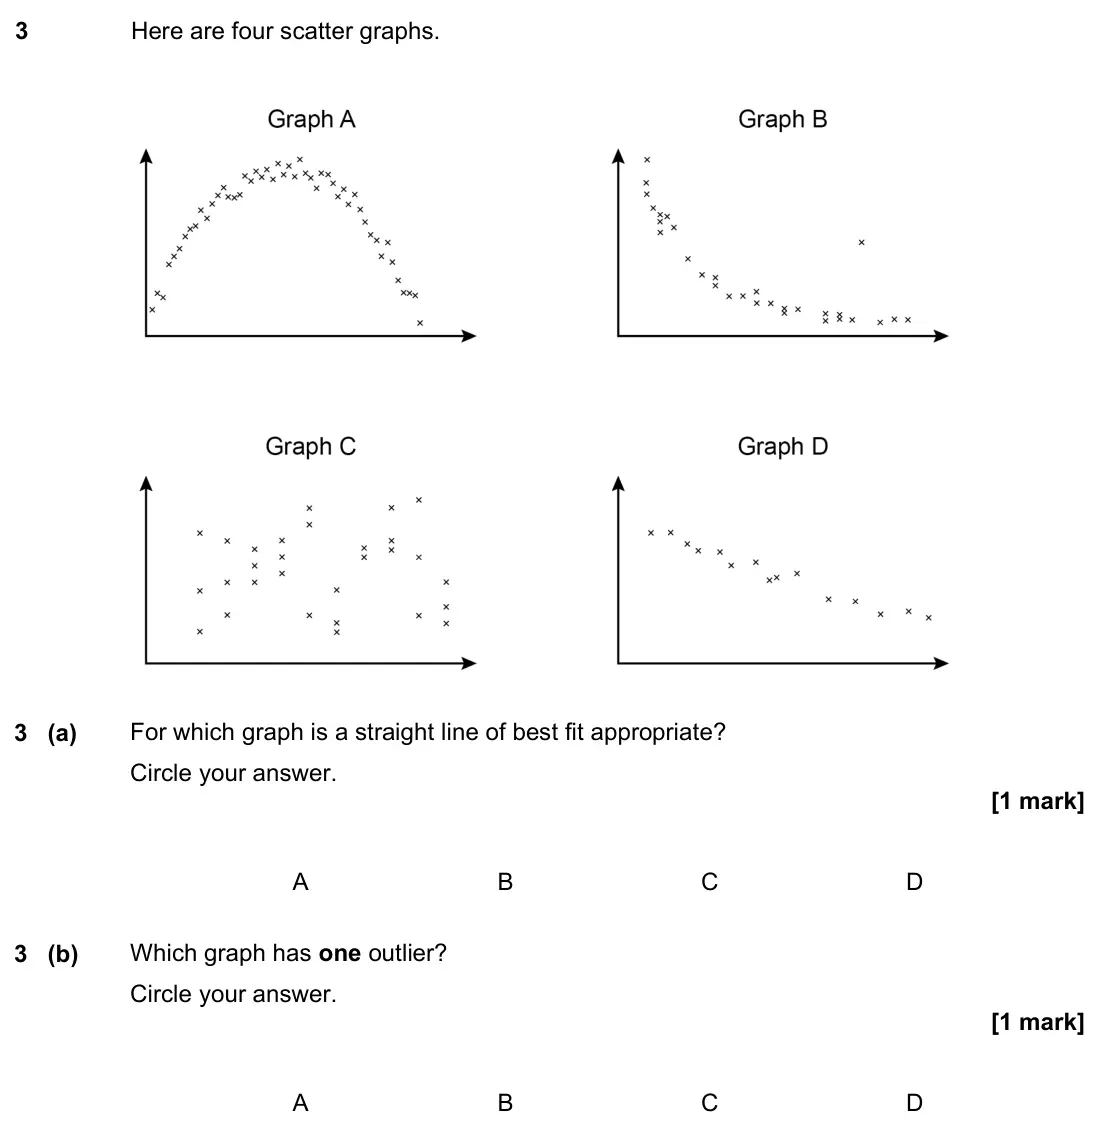
- June 2022, Paper 3H, Q3 (2 marks): Here are four scatter graphs. 3 (a) For which graph is a straight line of best fit appropriate? Circle your answer. A B C D 3 (b) Which graph has one outlier? C
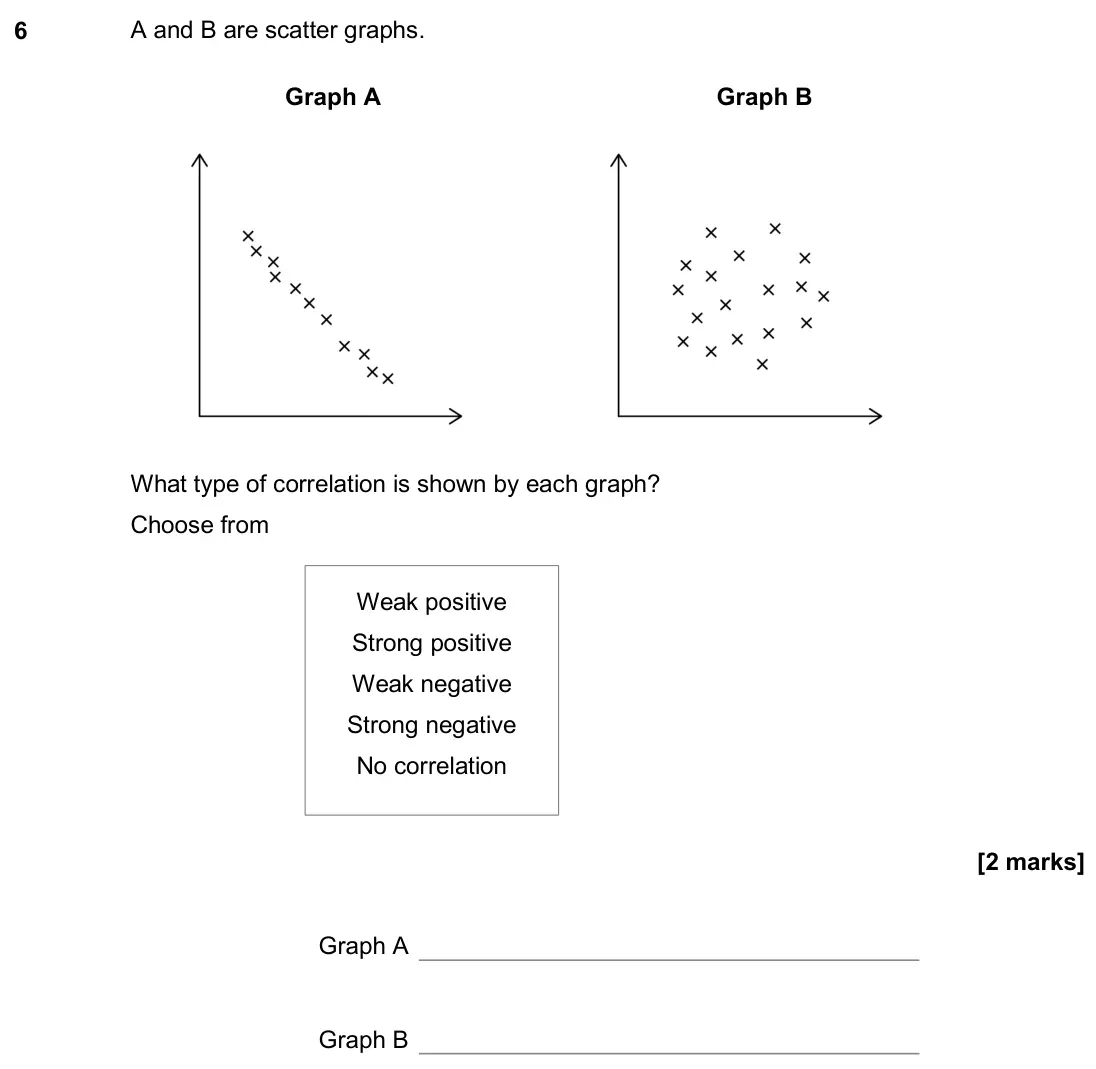
- November 2020, Paper 1H, Q6 (2 marks): A and B are scatter graphs. Graph A Graph B What type of correlation is shown by each graph? Choose from Graph A Graph B Weak positive Strong positive Weak nega
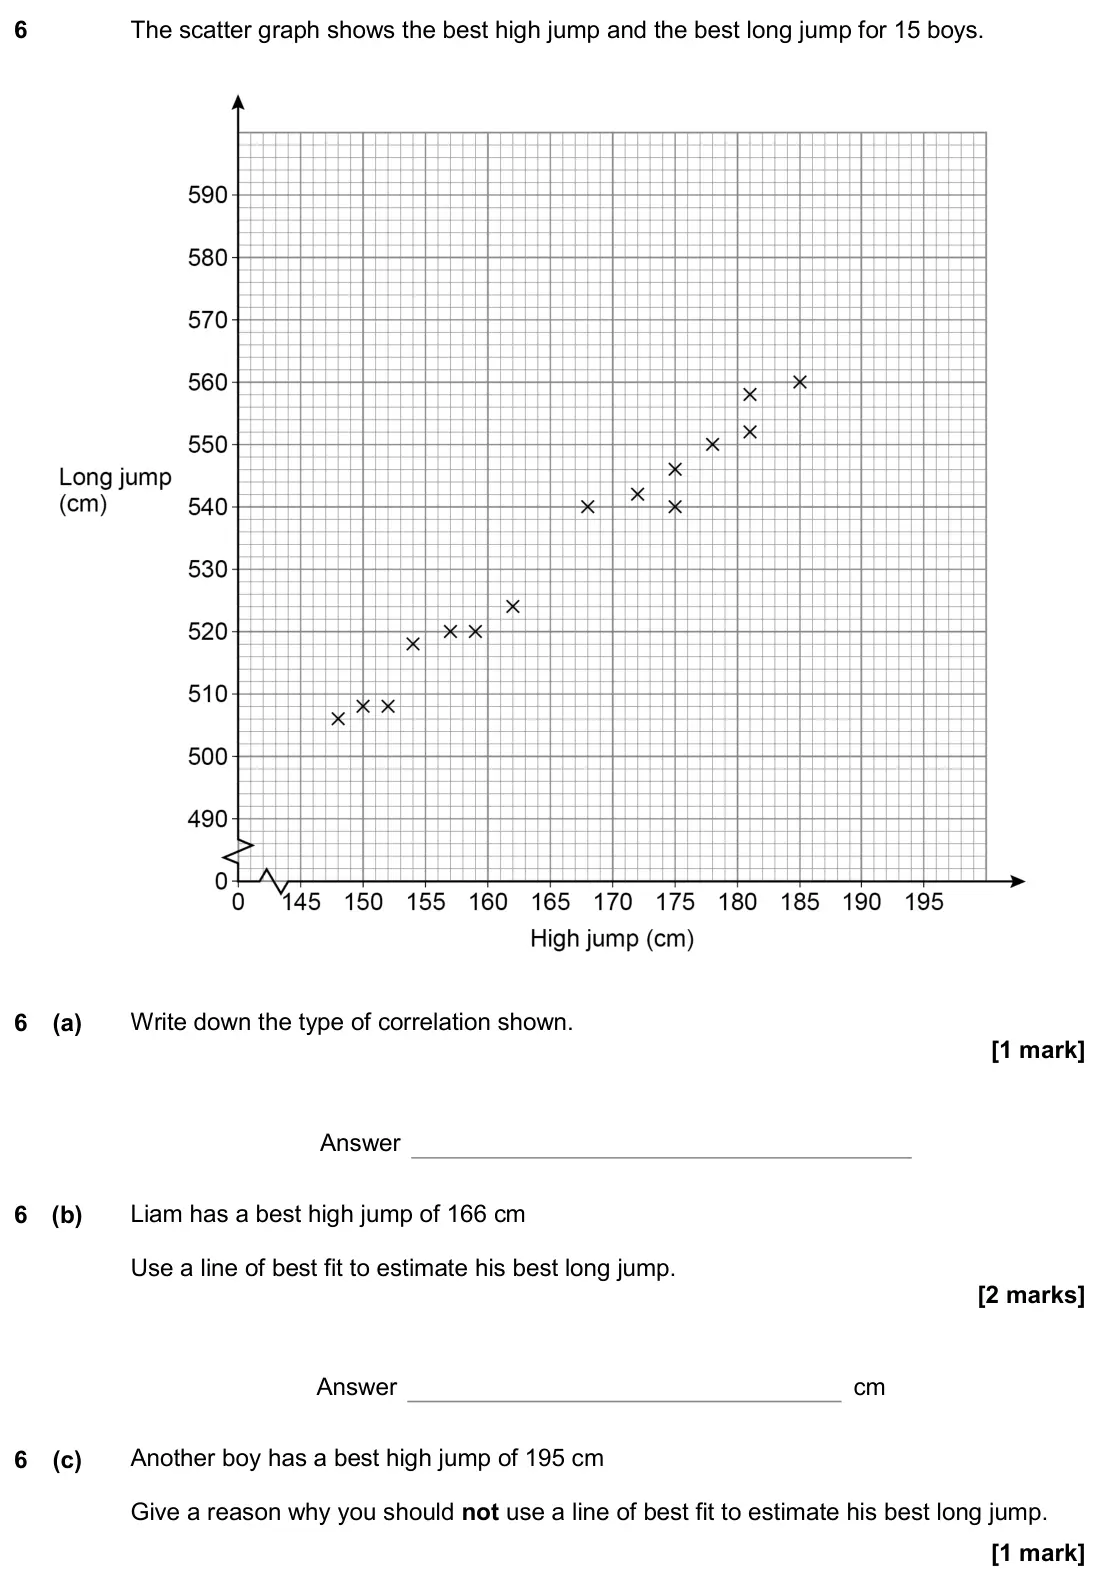
- November 2019, Paper 2H, Q6 (4 marks): The scatter graph shows the best high jump and the best long jump for 15 boys. 6 (a) Write down the type of correlation shown. Answer 6 (b) Liam has a best high
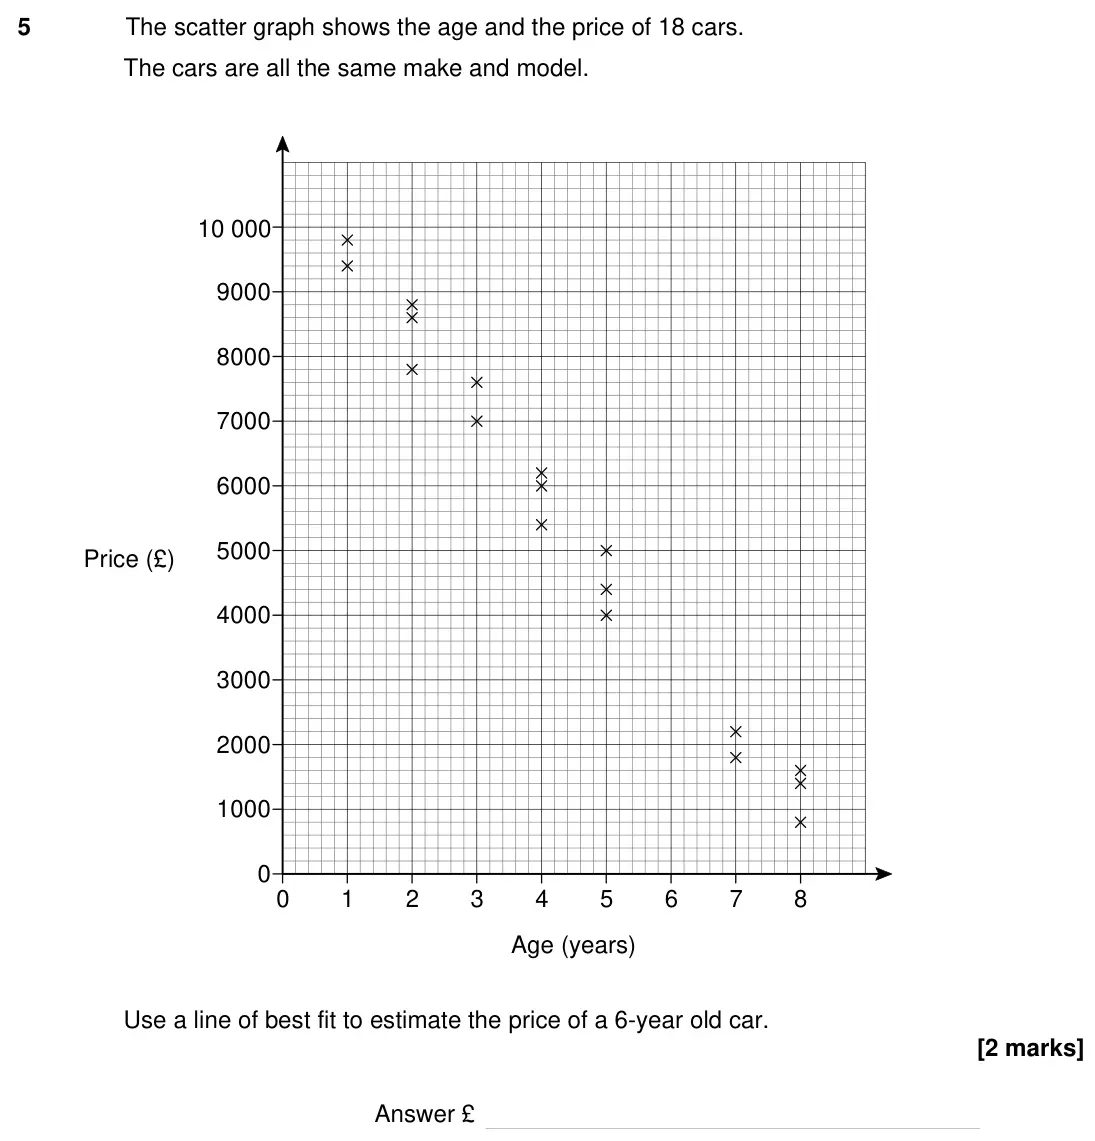
- Specimen, Paper 1H, Q5 (2 marks): The scatter graph shows the age and the price of 18 cars. The cars are all the same make and model. Use a line of best fit to estimate the price of a 6-year old
Questions, mark schemes and examiner’s reports are © AQA, from their published past papers. Plumi isn’t affiliated with any exam board. Want whole papers? Every AQA GCSE Maths paper.
Rather write your answers by hand on iPad? Plumi marks them against the same mark schemes.