 plumi
Histograms and cumulative frequency: AQA GCSE Maths questions
Every AQA GCSE Maths exam question on S3 Histograms and cumulative frequency, 2017–2025, with its mark scheme and examiner’s report.
Find questions1,304
Exam
All years
Calculator
All 28 questions on Histograms and cumulative frequency, as a list
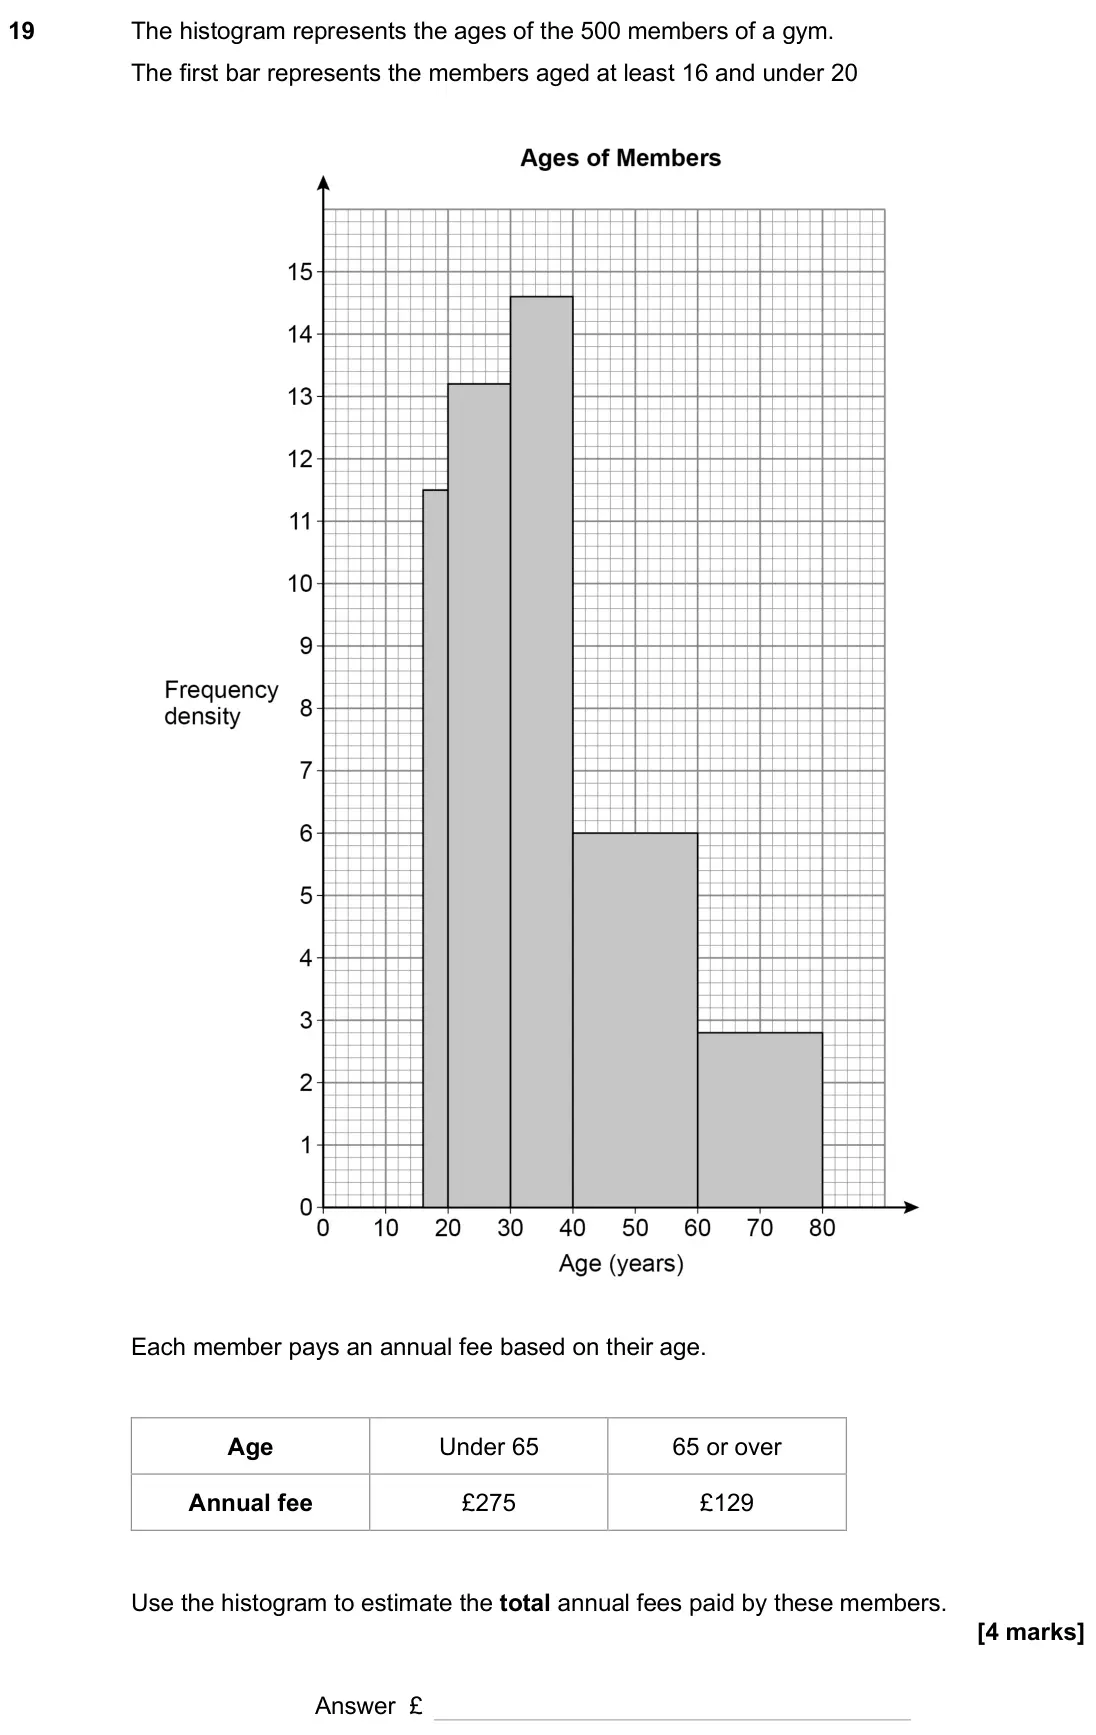
- June 2025, Paper 2H, Q19 (4 marks): The histogram represents the ages of the 500 members of a gym. The first bar represents the members aged at least 16 and under 20 Each member pays an annual fee
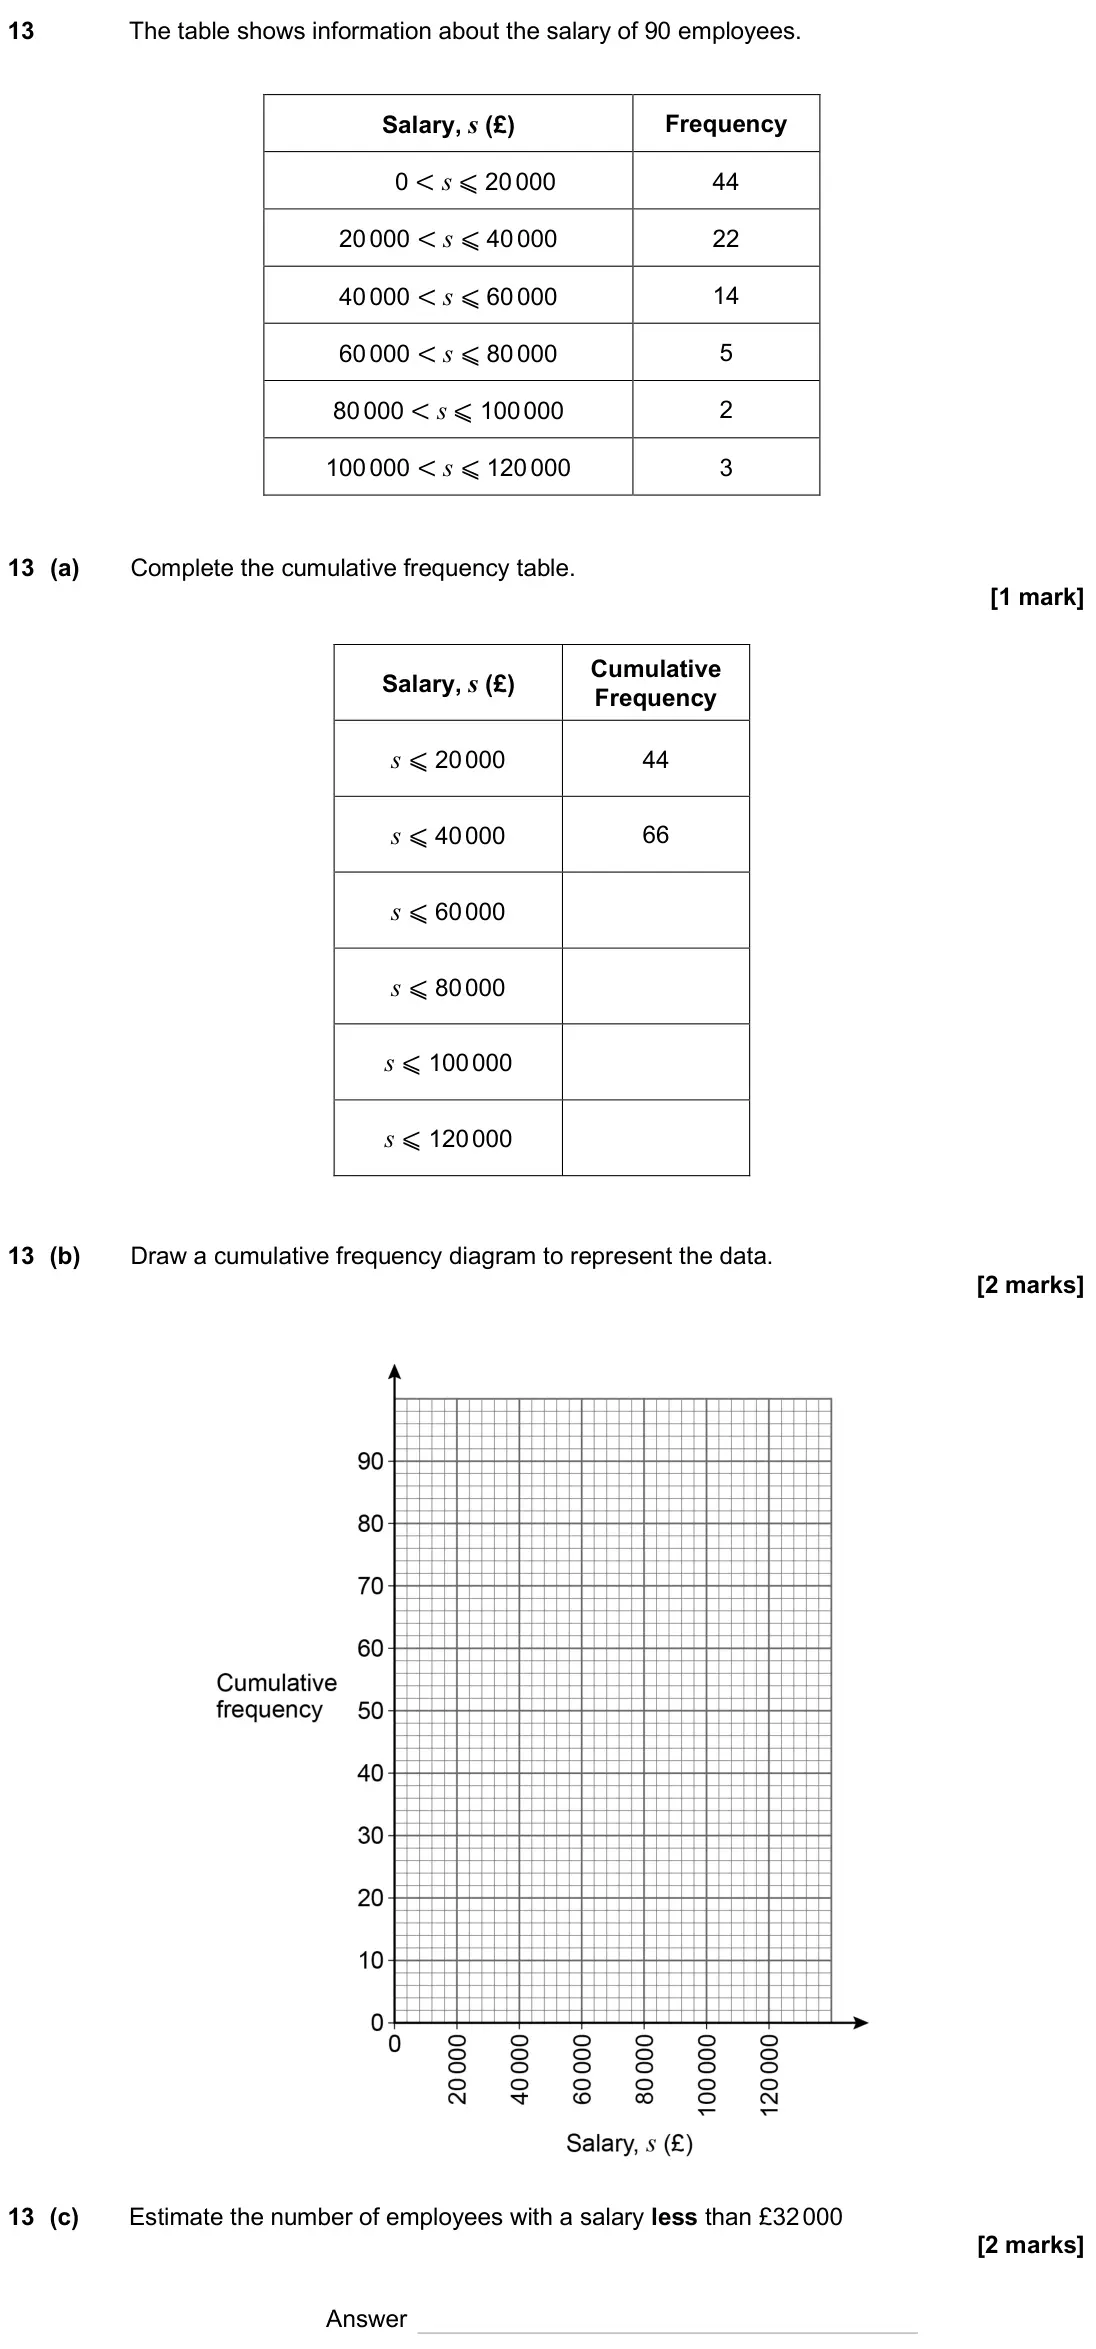
- June 2025, Paper 3H, Q13 (5 marks): The table shows information about the salary of 90 employees. Salary, s (£) Frequency 0 < s ⩽ 20 000 44 20 000 < s ⩽ 40 000 22 40 000 < s ⩽ 60 000 14 60 000 < s
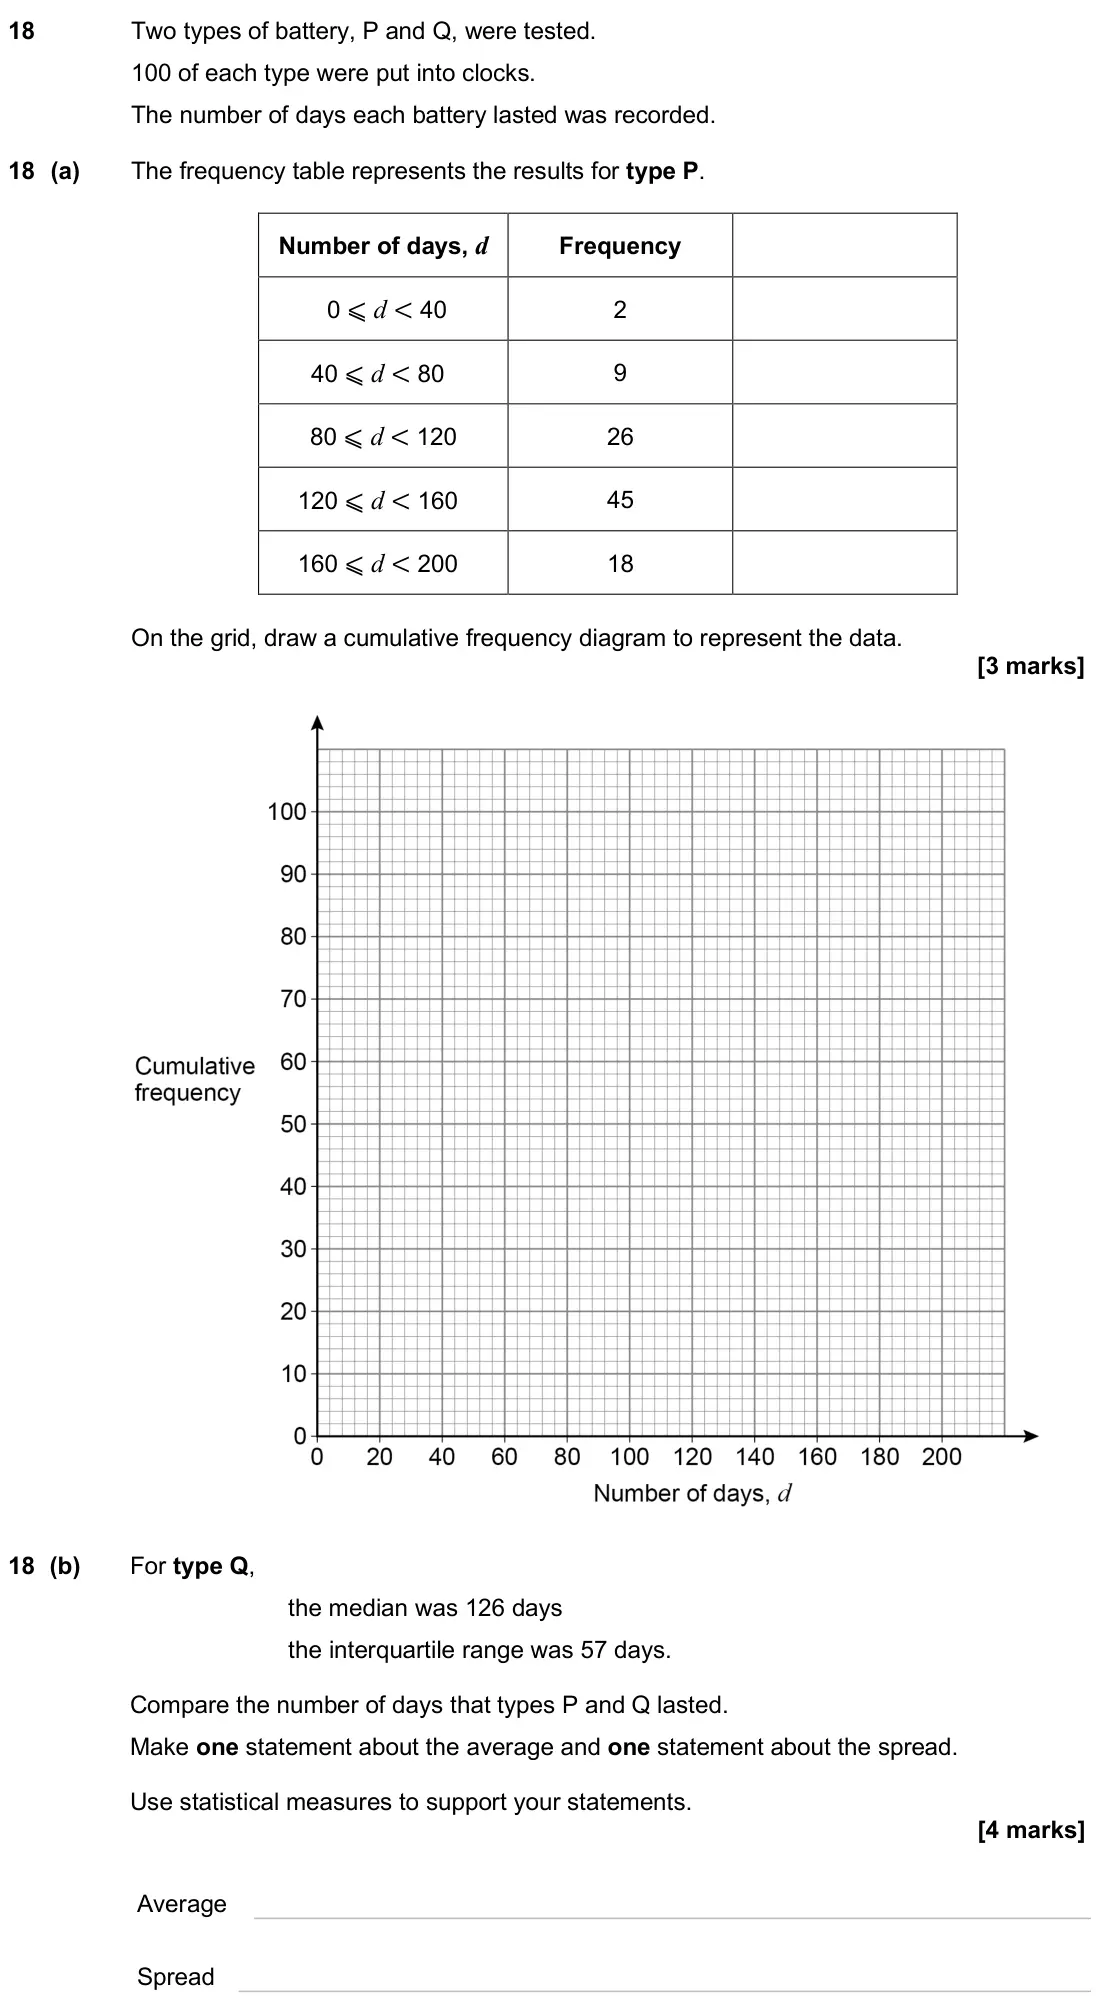
- November 2024, Paper 2H, Q18 (7 marks): Two types of battery, P and Q, were tested. 100 of each type were put into clocks. The number of days each battery lasted was recorded. 18 (a) The frequency tab
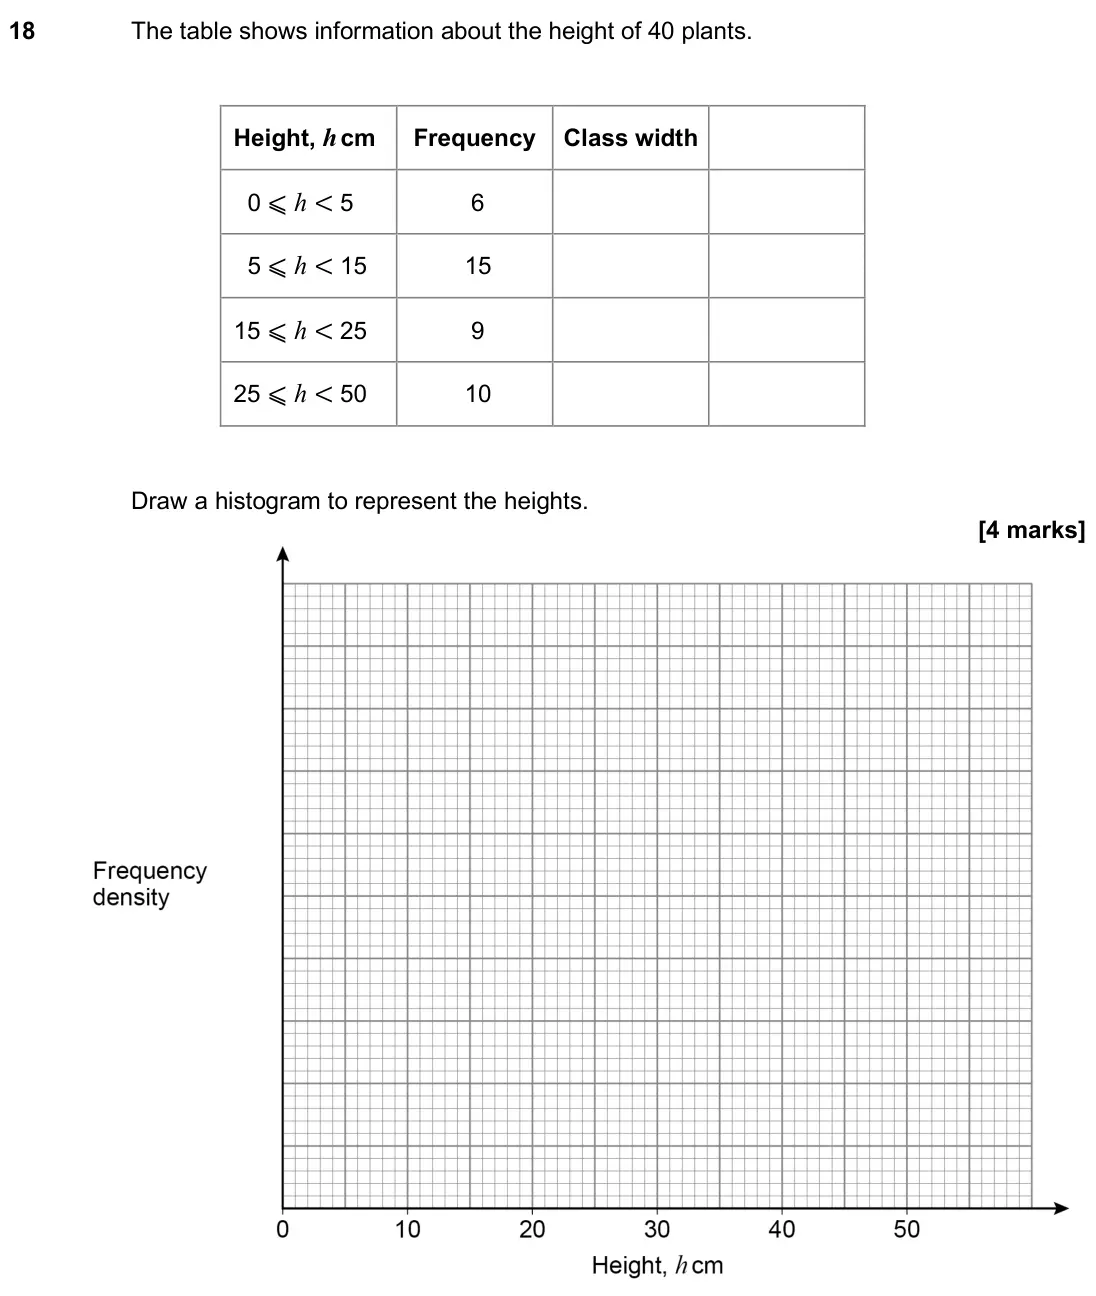
- November 2024, Paper 3H, Q18 (4 marks): The table shows information about the height of 40 plants. Height, h cm Frequency Class width 0 ⩽ h < 5 6 5 ⩽ h < 15 15 15 ⩽ h < 25 9 25 ⩽ h < 50 10 Draw a hist
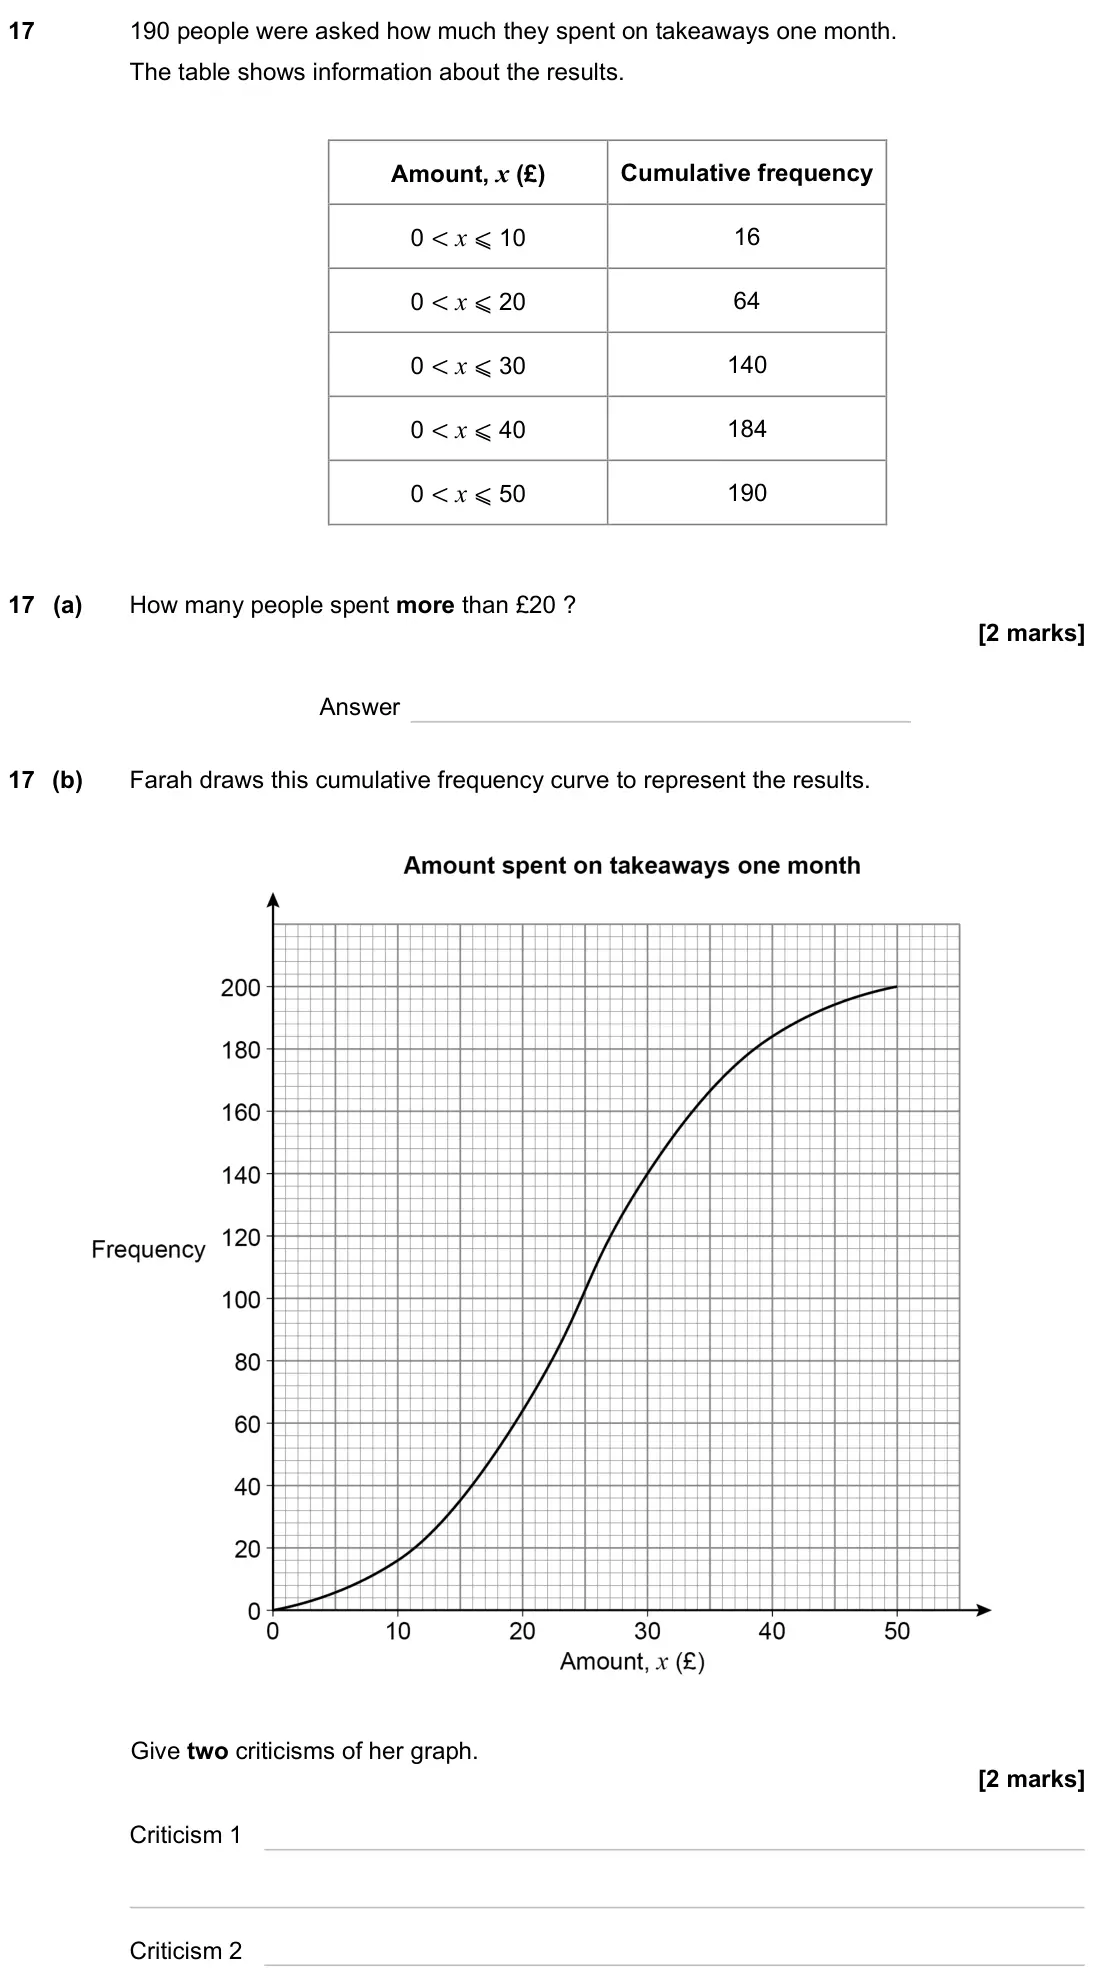
- November 2023, Paper 2H, Q17 (4 marks): 190 people were asked how much they spent on takeaways one month. The table shows information about the results. Amount, x (£) Cumulative frequency 0 < x ⩽ 10 1
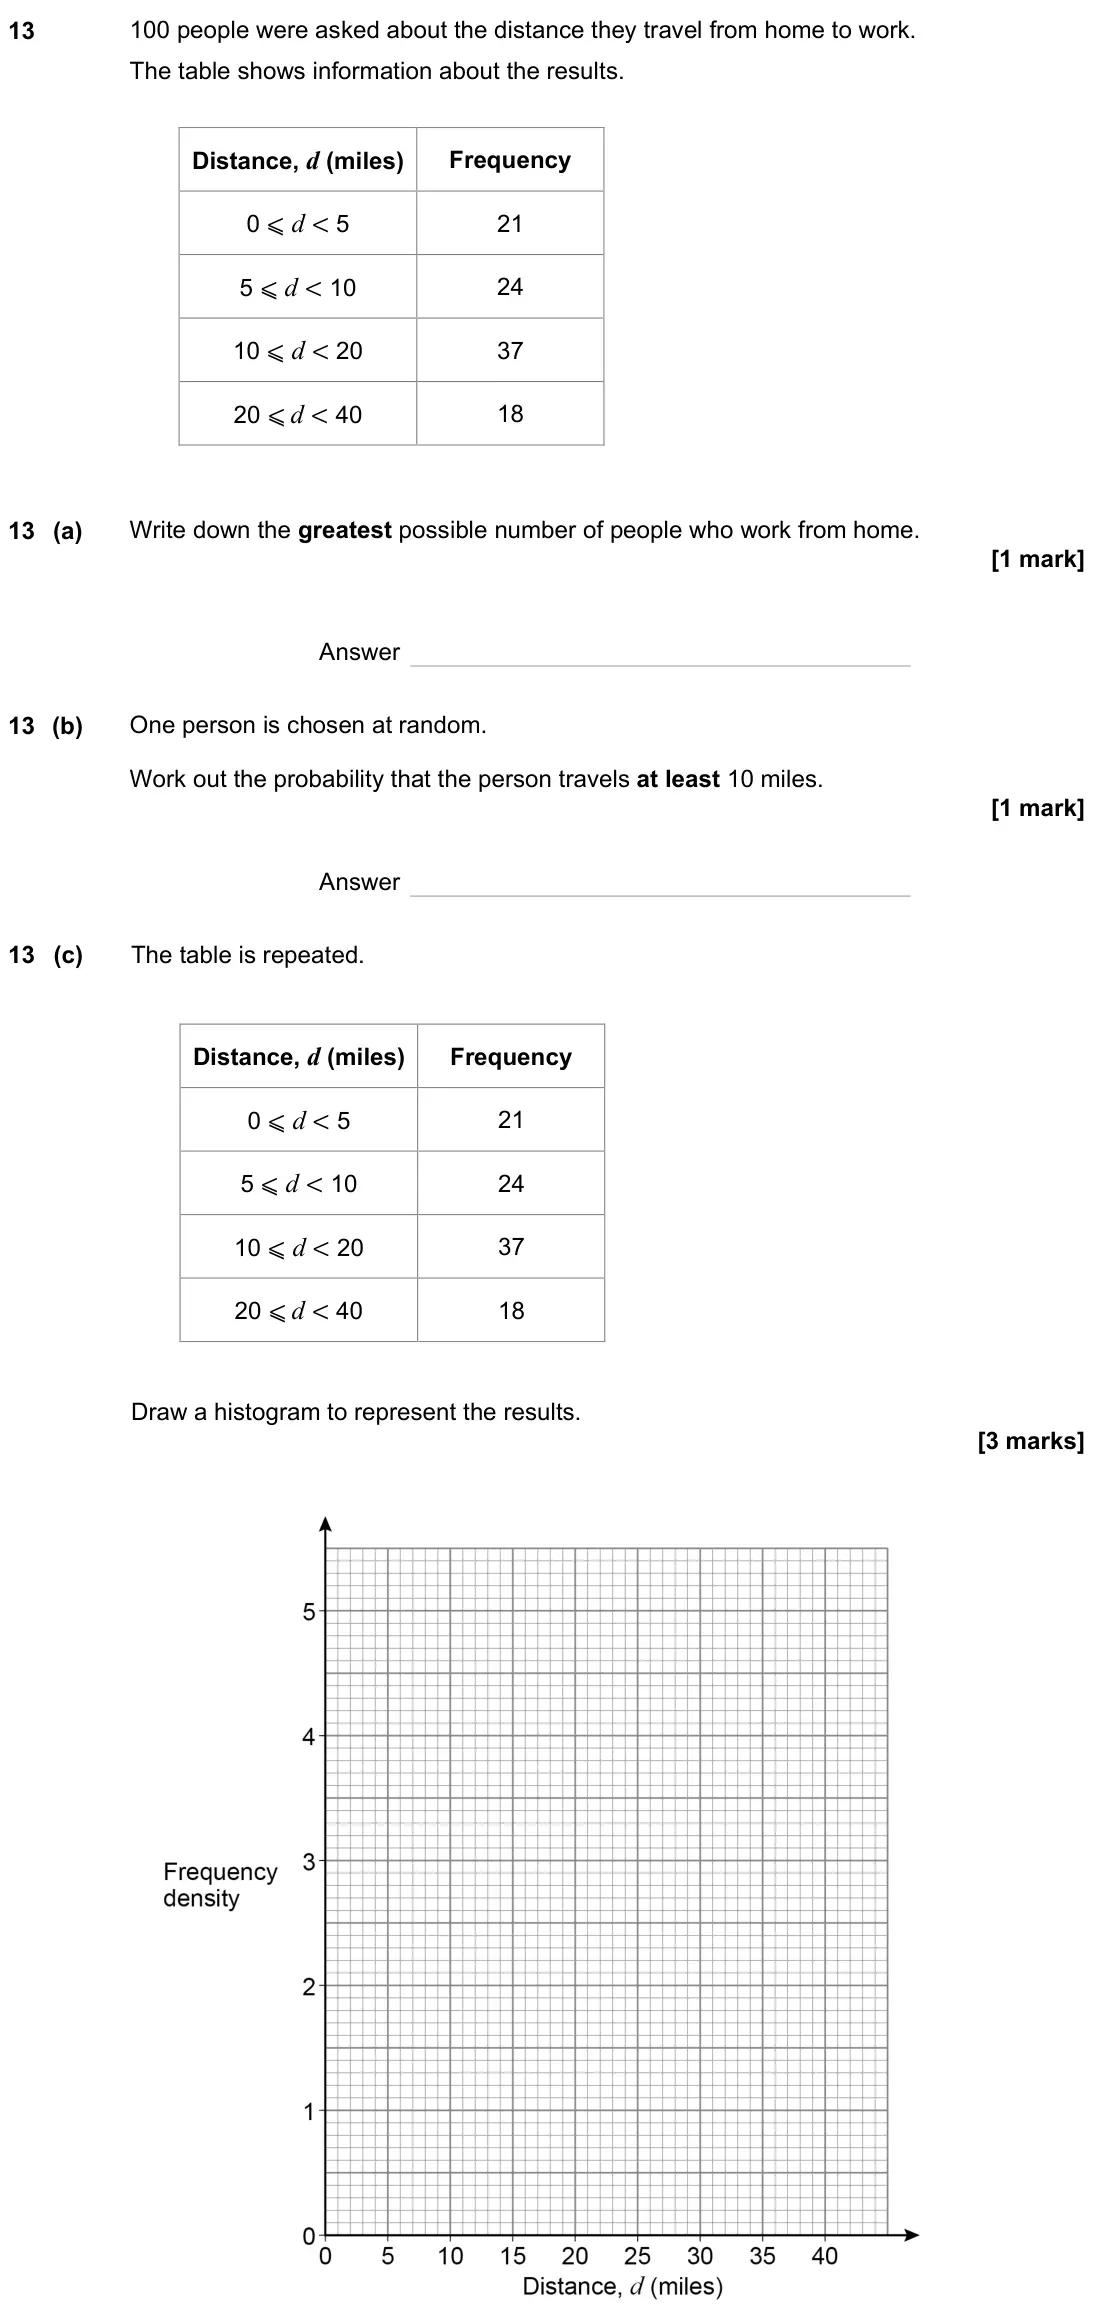
- November 2023, Paper 3H, Q13 (5 marks): 100 people were asked about the distance they travel from home to work. The table shows information about the results. Distance, d (miles) Frequency 0 ⩽ d < 5 2
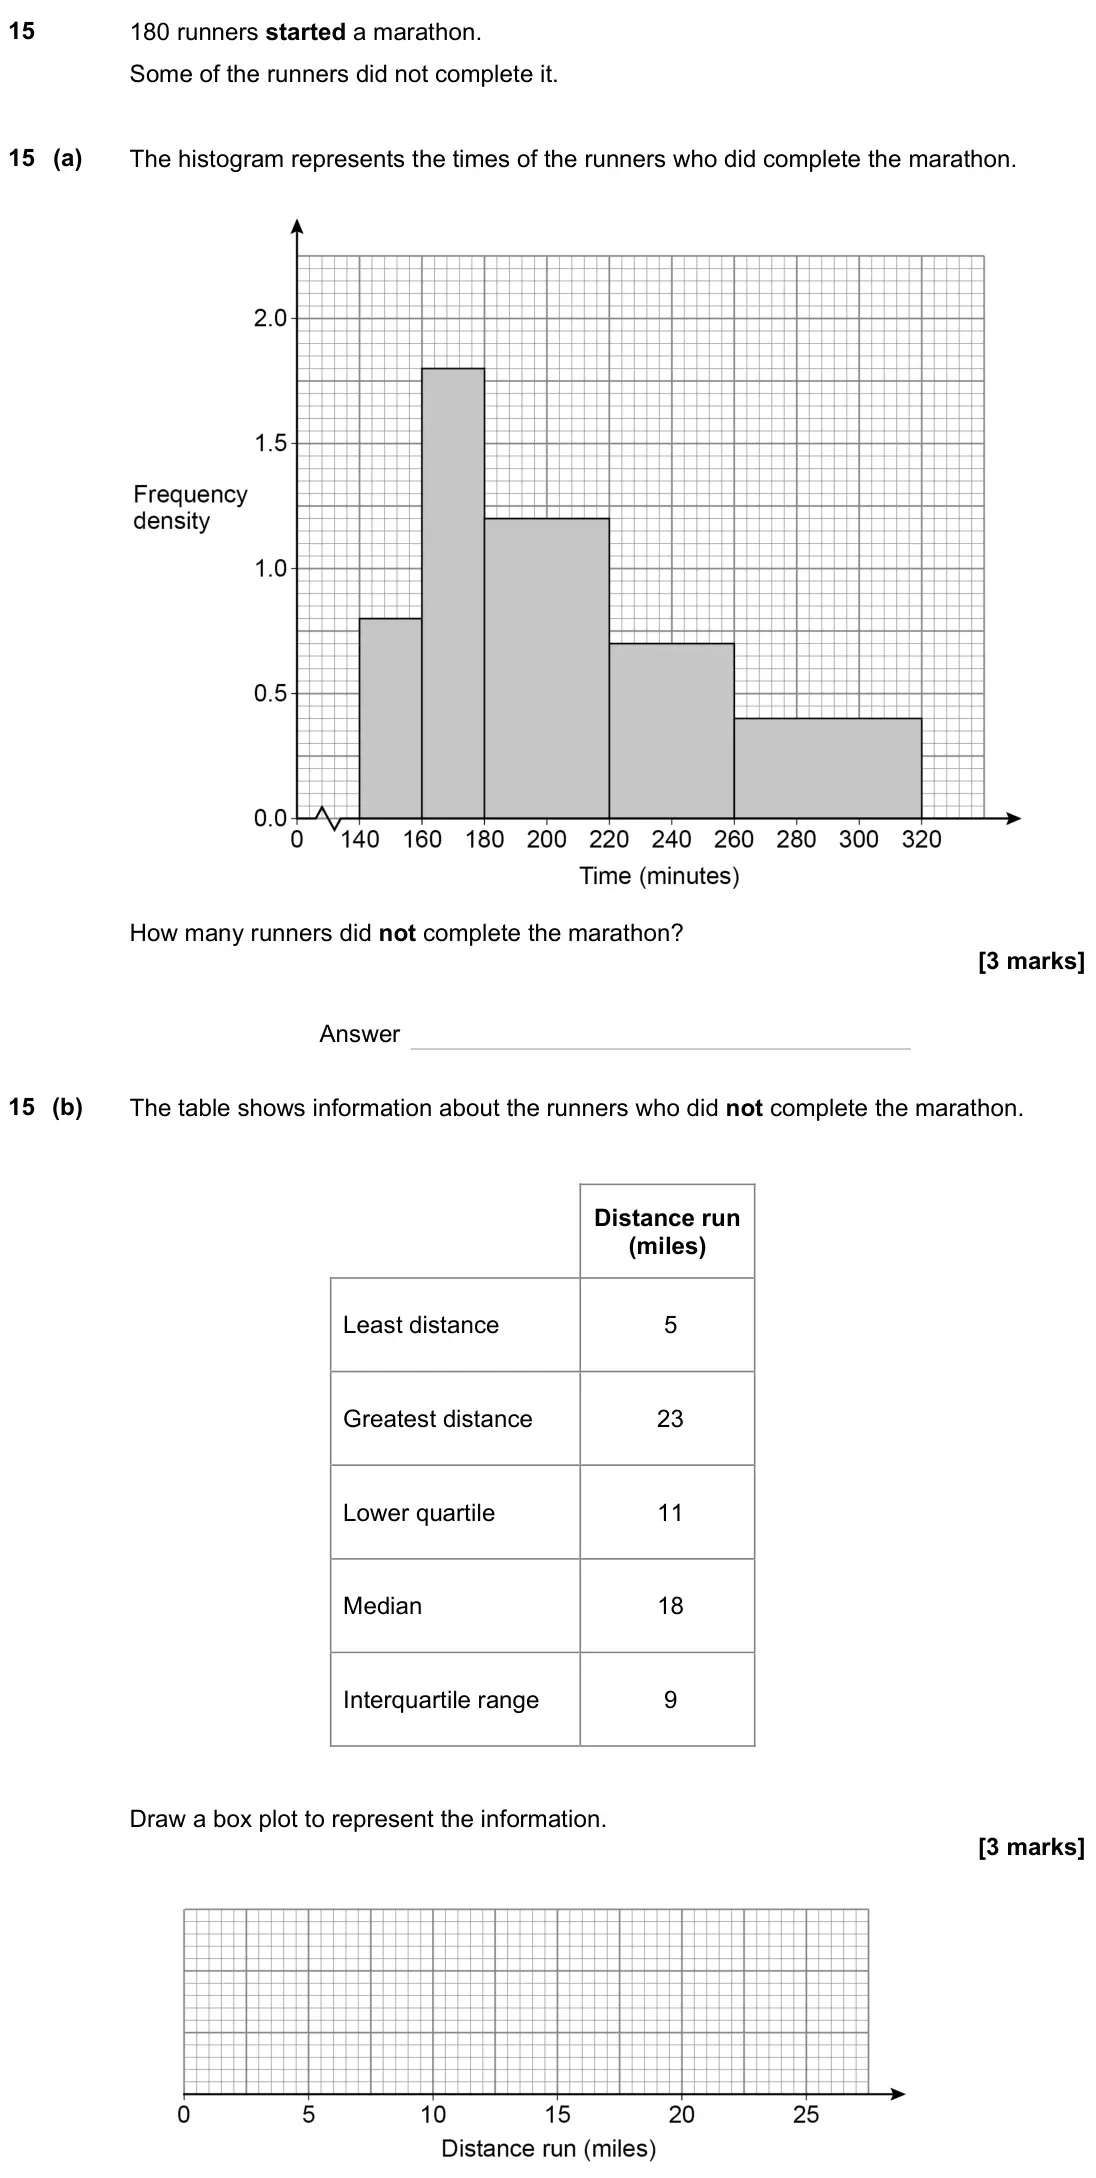
- June 2023, Paper 3H, Q15 (6 marks): 180 runners started a marathon. Some of the runners did not complete it. 15 (a) The histogram represents the times of the runners who did complete the marathon.
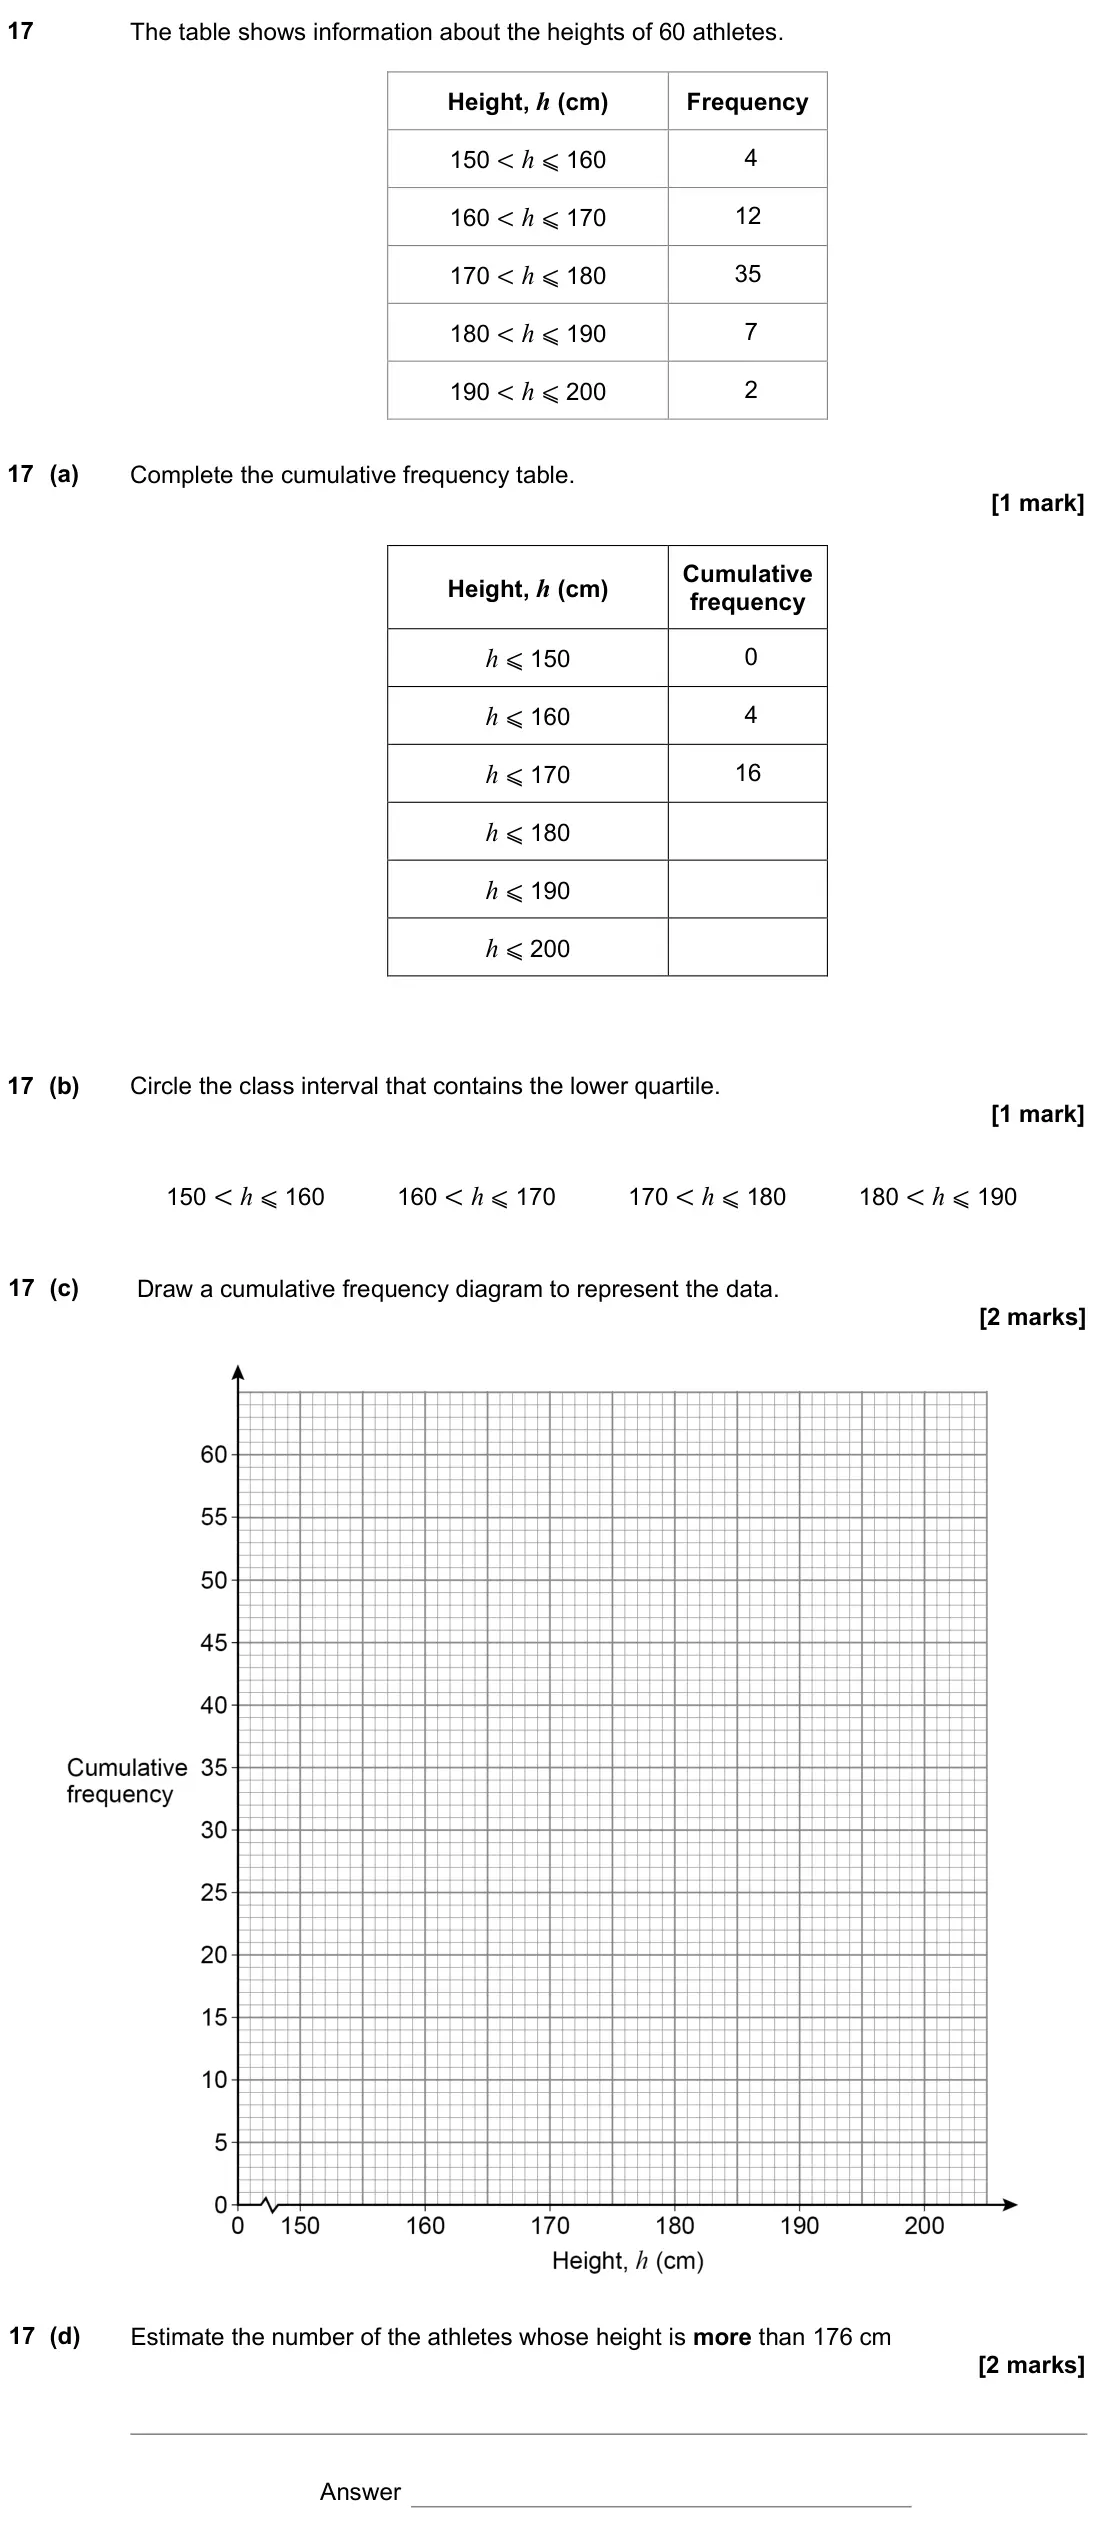
- November 2022, Paper 1H, Q17 (6 marks): The table shows information about the heights of 60 athletes. Height, h (cm) Frequency 150 < h ⩽ 160 4 160 < h ⩽ 170 12 170 < h ⩽ 180 35 180 < h ⩽ 190 7 190 < h
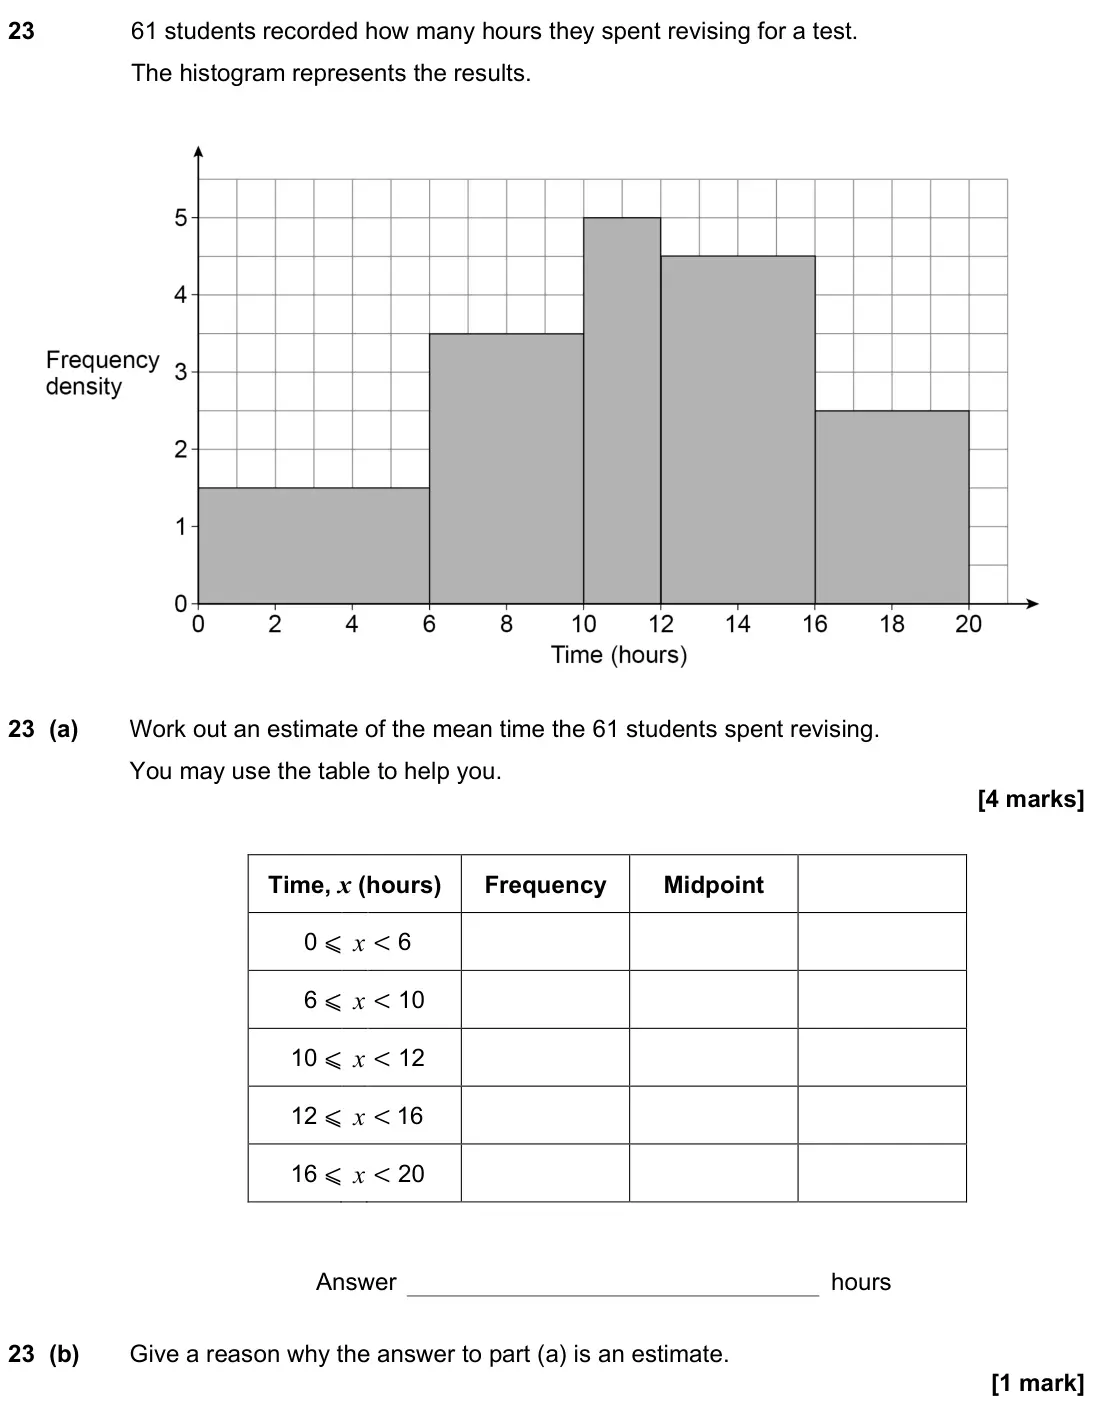
- November 2022, Paper 2H, Q23 (5 marks): 61 students recorded how many hours they spent revising for a test. The histogram represents the results. 23 (a) Work out an estimate of the mean time the 61 st
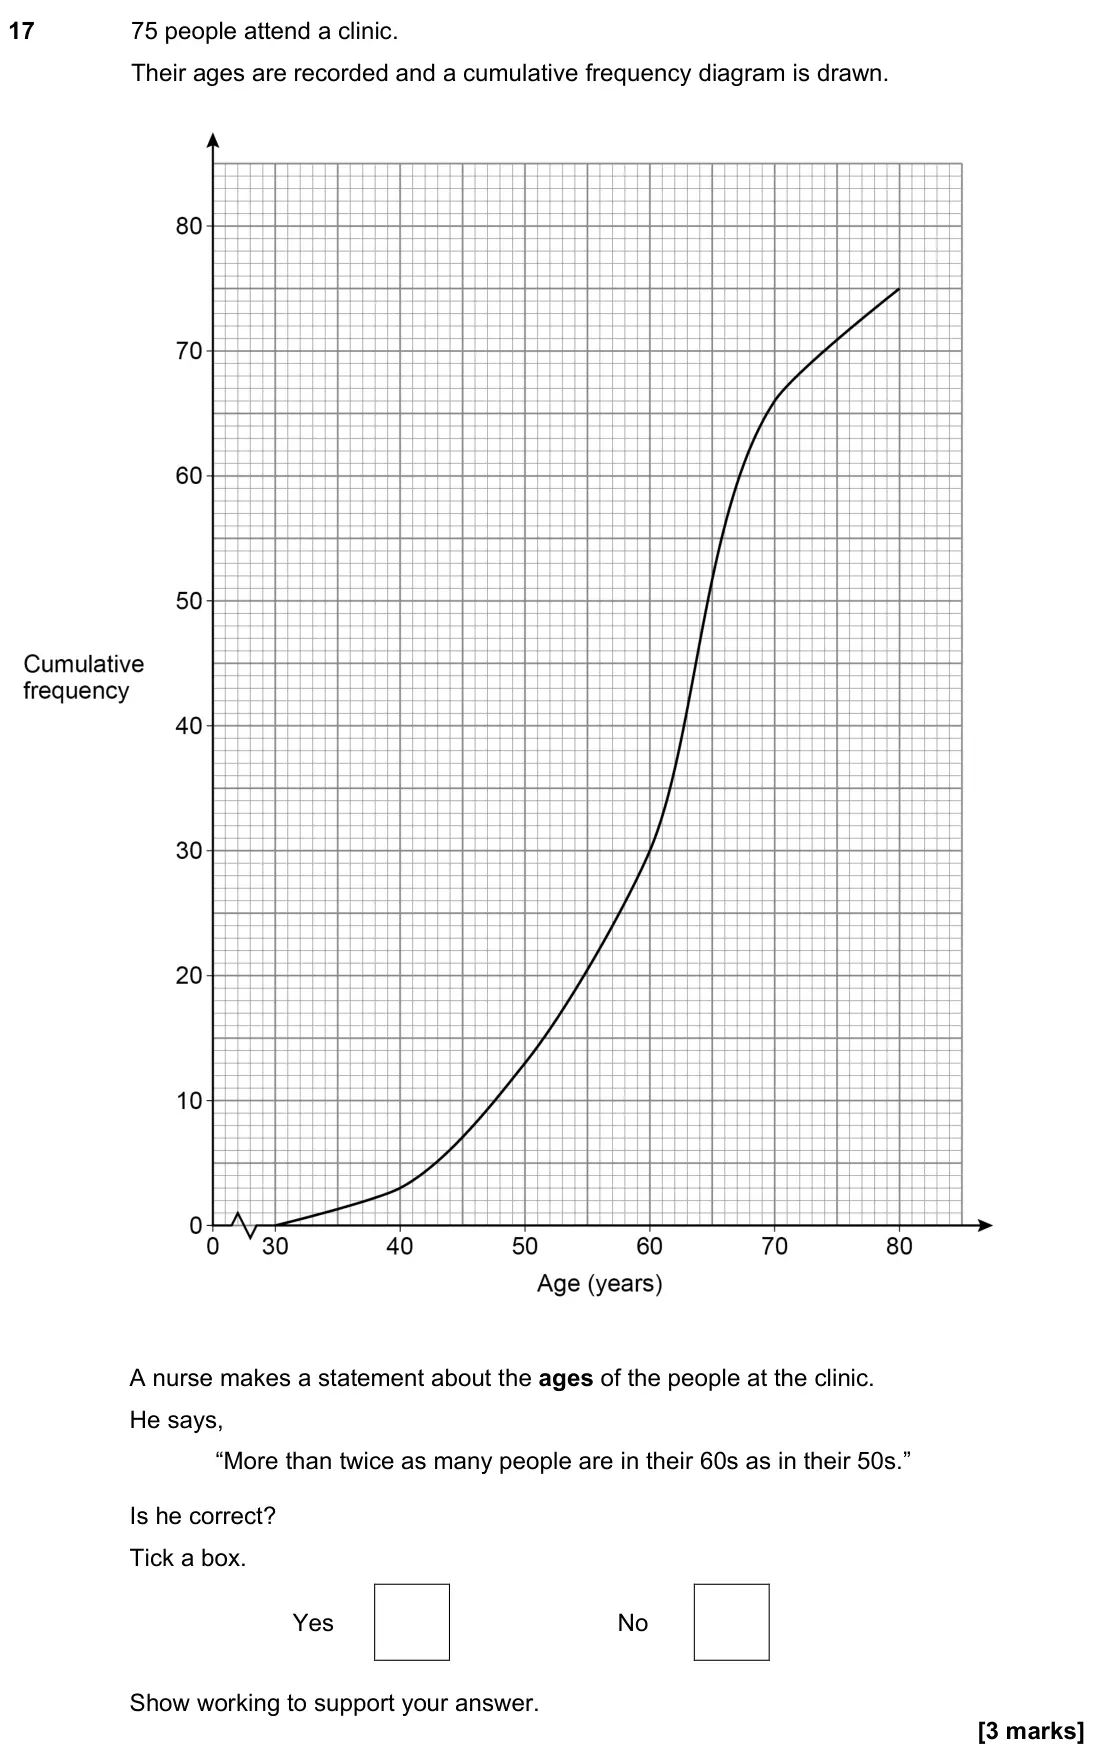
- June 2022, Paper 1H, Q17 (3 marks): 75 people attend a clinic. Their ages are recorded and a cumulative frequency diagram is drawn. A nurse makes a statement about the ages of the people at the cl
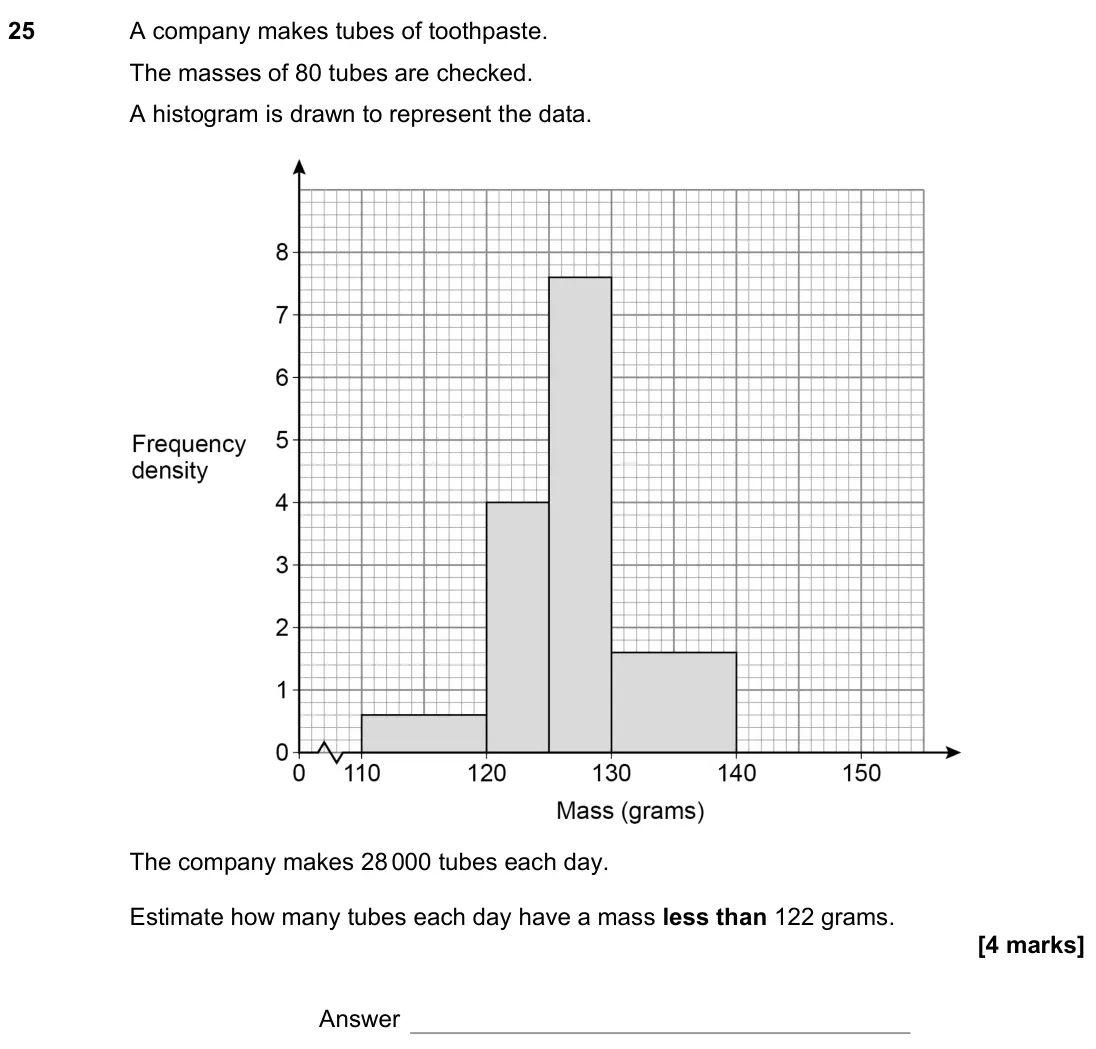
- June 2022, Paper 3H, Q25 (4 marks): A company makes tubes of toothpaste. The masses of 80 tubes are checked. A histogram is drawn to represent the data. The company makes 28 000 tubes each day. Es
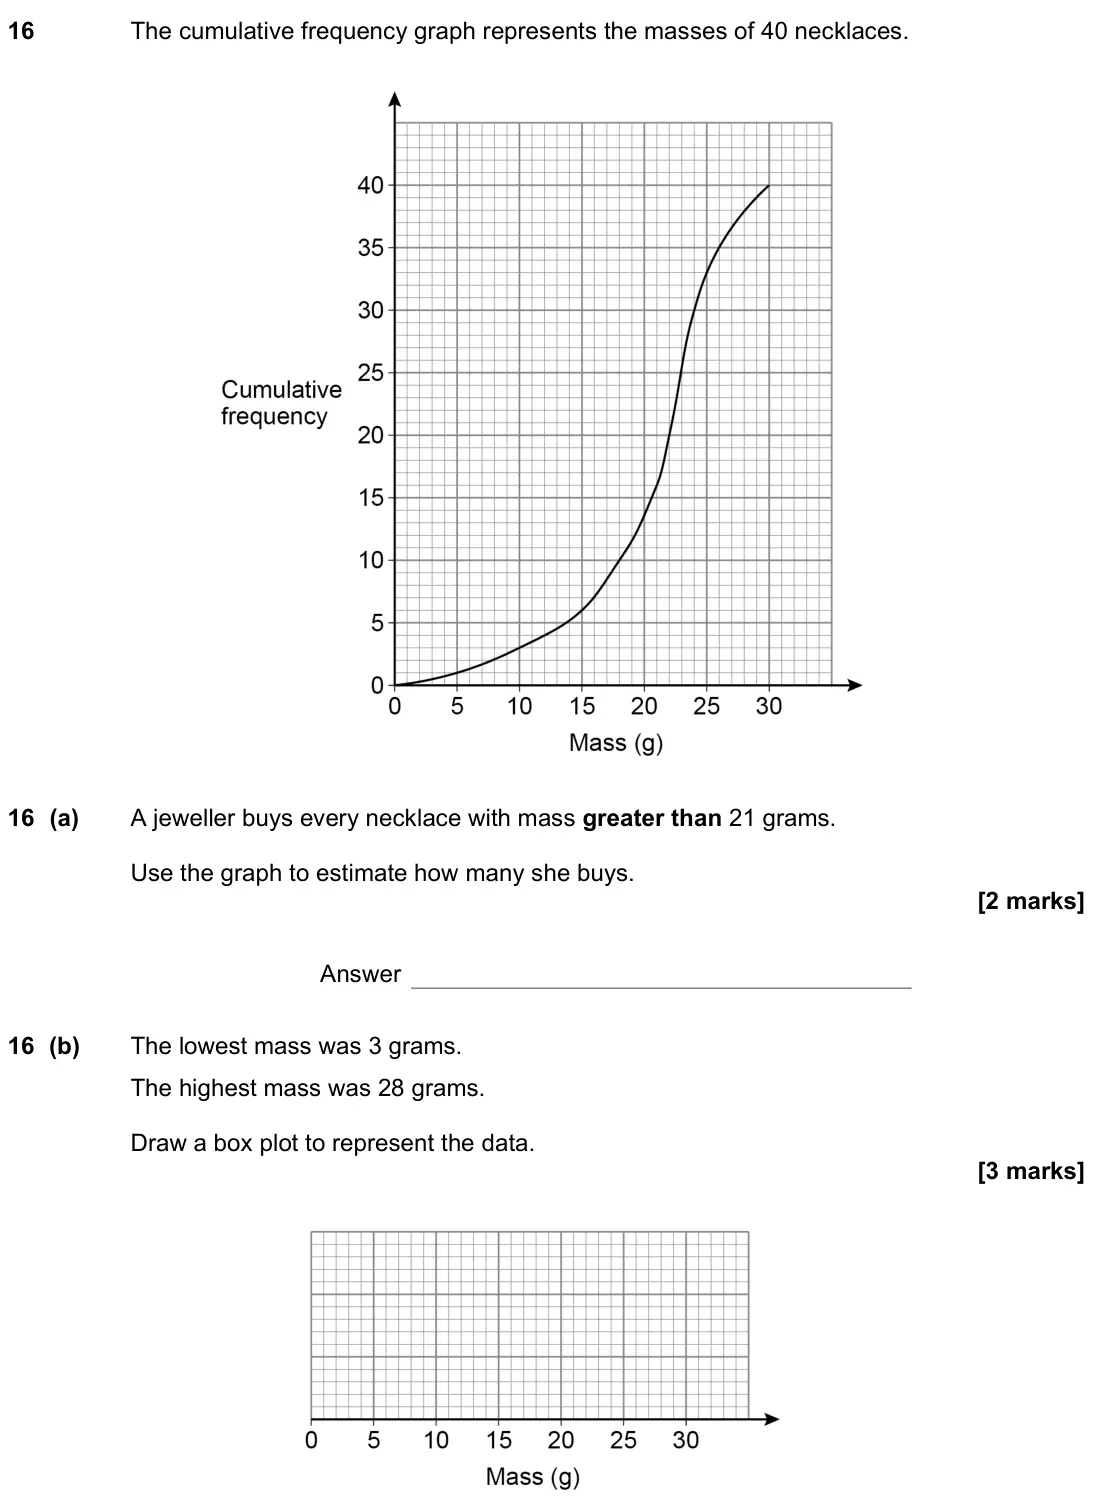
- November 2021, Paper 1H, Q16 (5 marks): The cumulative frequency graph represents the masses of 40 necklaces. 16 (a) A jeweller buys every necklace with mass greater than 21 grams. Use the graph to es
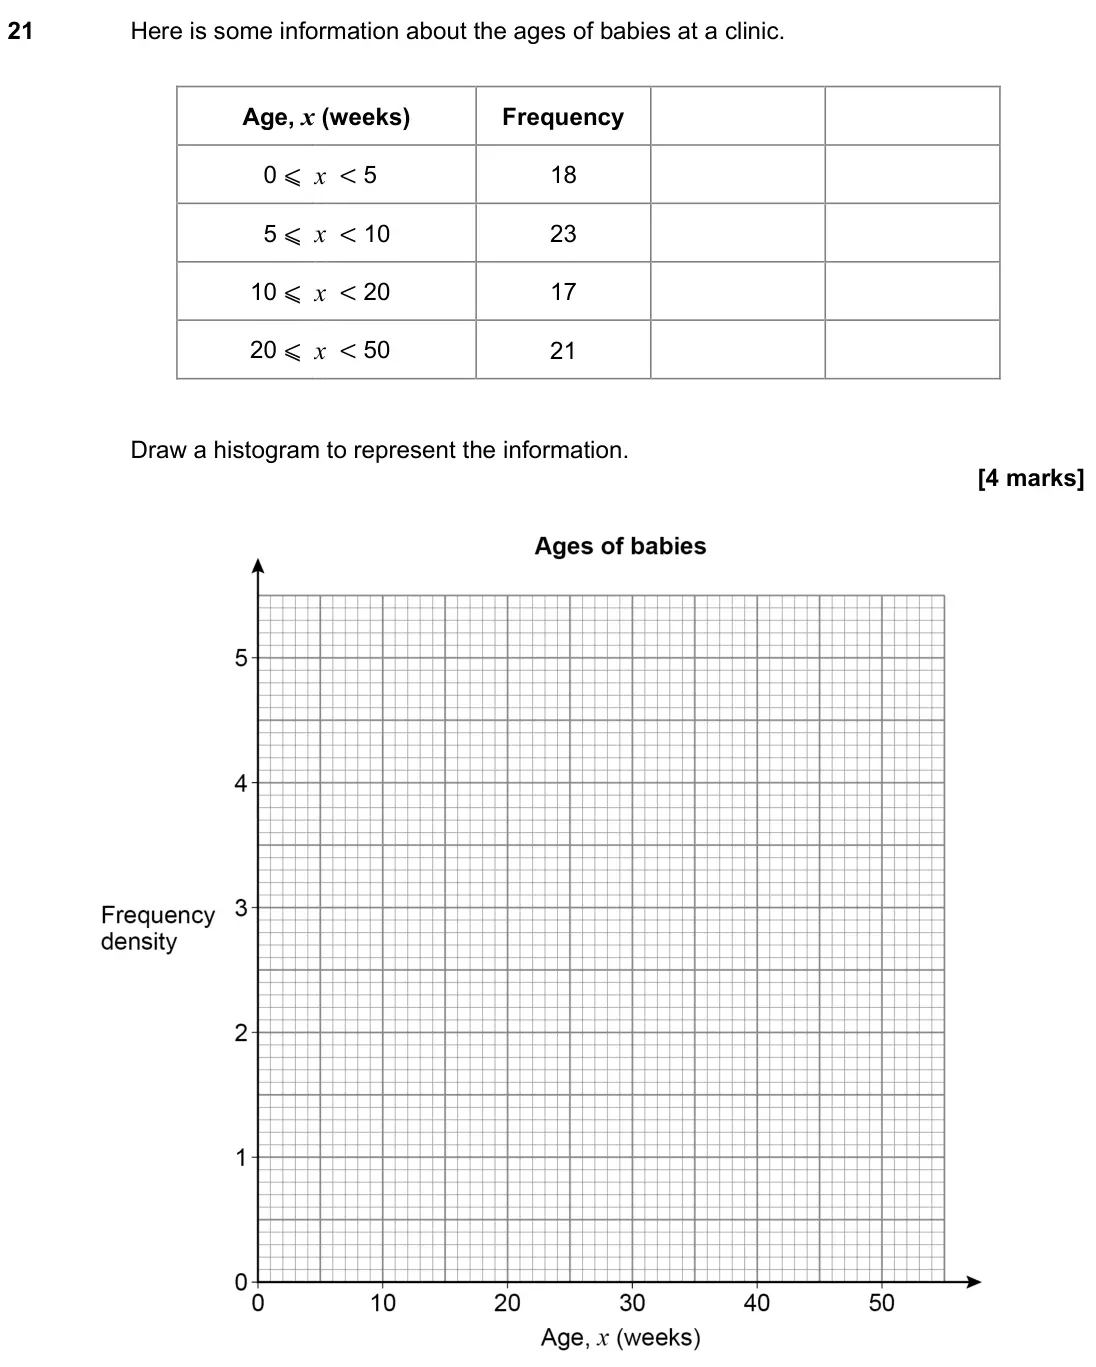
- November 2021, Paper 3H, Q21 (4 marks): Here is some information about the ages of babies at a clinic. Age, x (weeks) Frequency 0 ⩽ x < 5 18 5 ⩽ x < 10 23 10 ⩽ x < 20 17 20 ⩽ x < 50 21 Draw a histogra
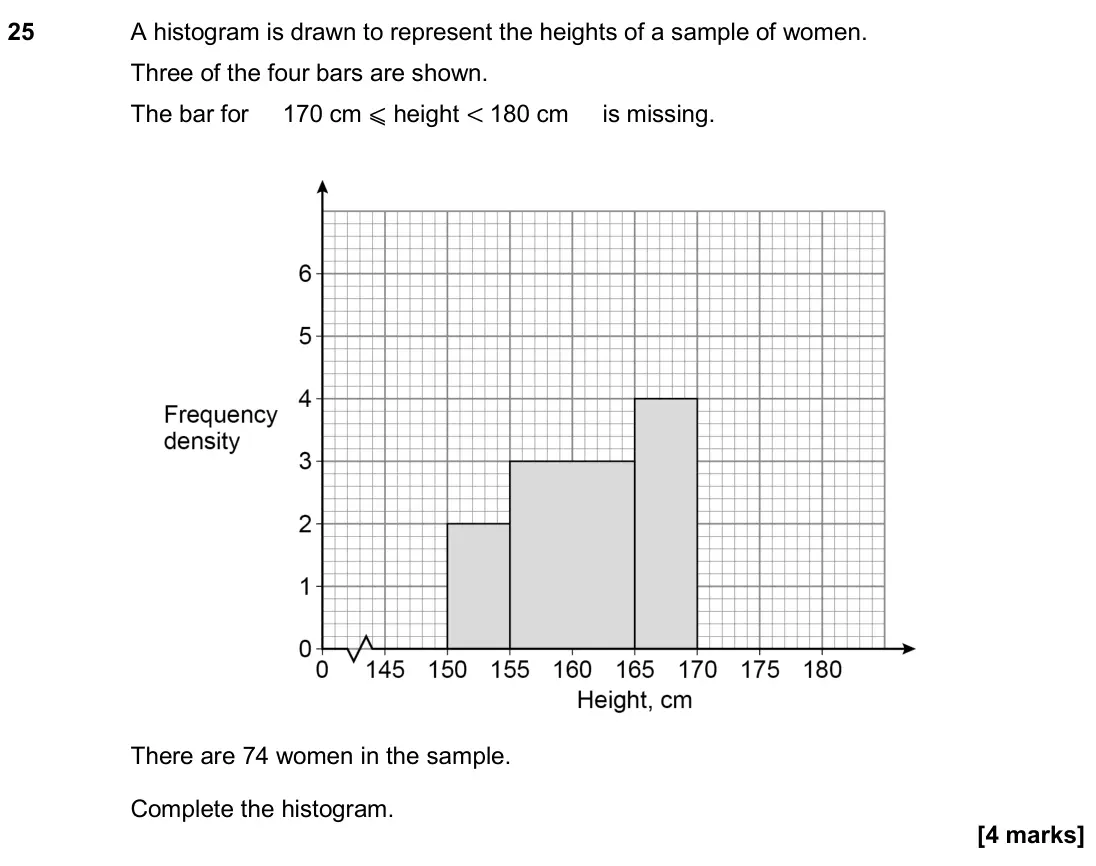
- November 2020, Paper 1H, Q25 (4 marks): A histogram is drawn to represent the heights of a sample of women. Three of the four bars are shown. The bar for 170 cm ⩽ height < 180 cm is missing. There are
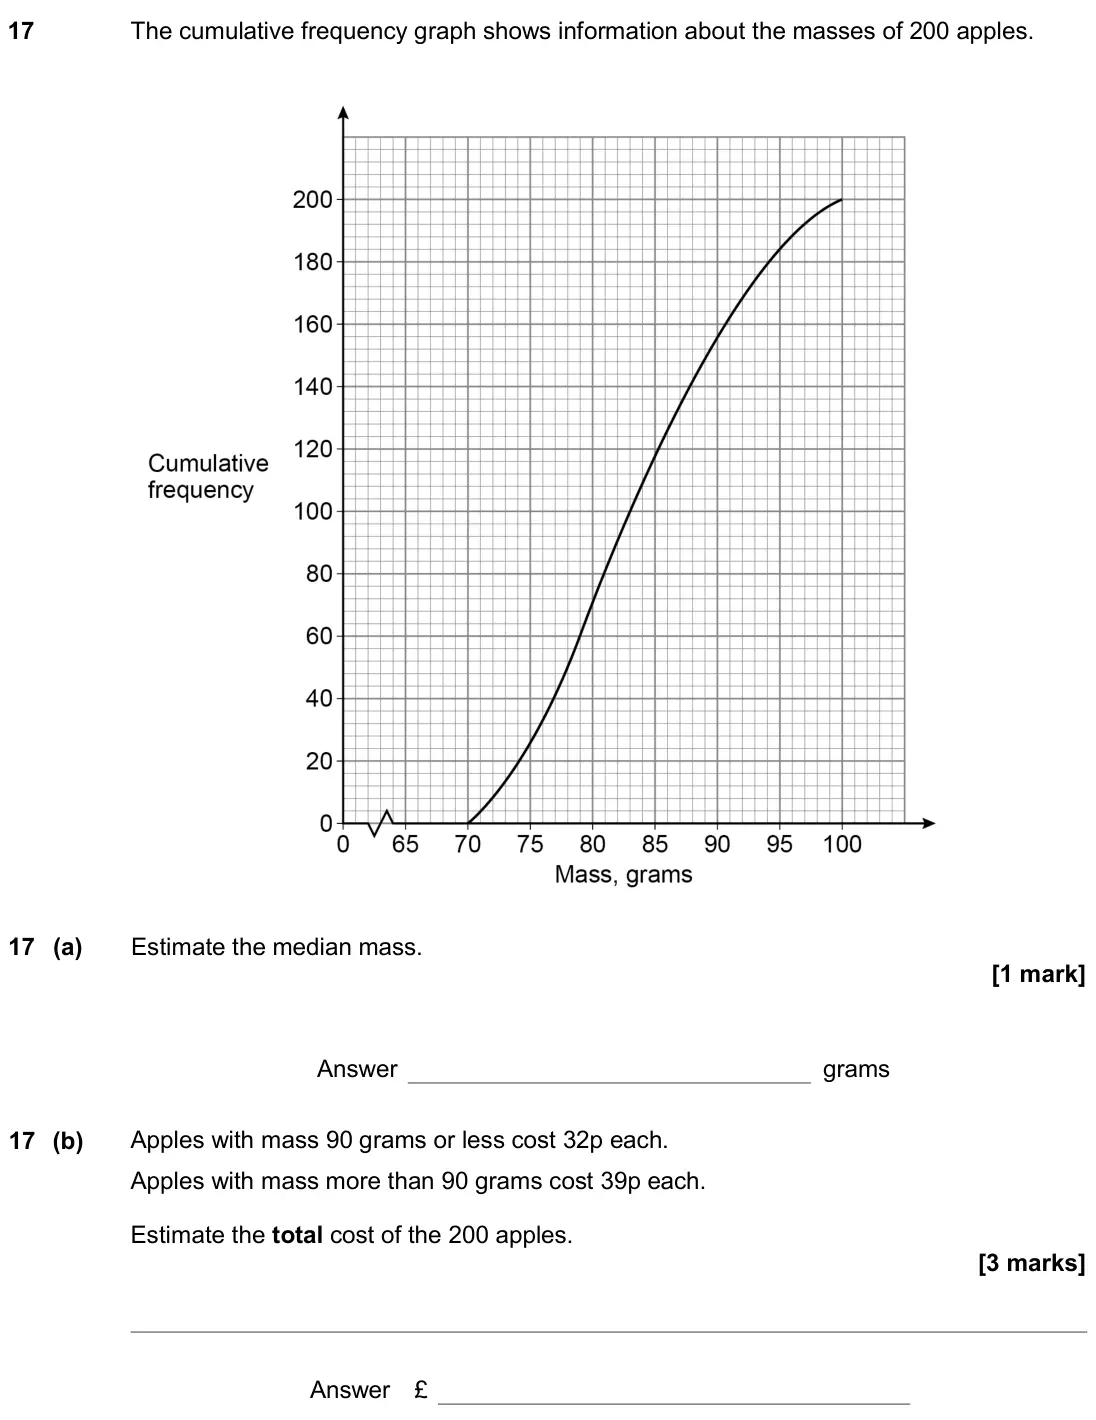
- November 2020, Paper 2H, Q17 (4 marks): The cumulative frequency graph shows information about the masses of 200 apples. 17 (a) Estimate the median mass. Answer grams 17 (b) Apples with mass 90 grams
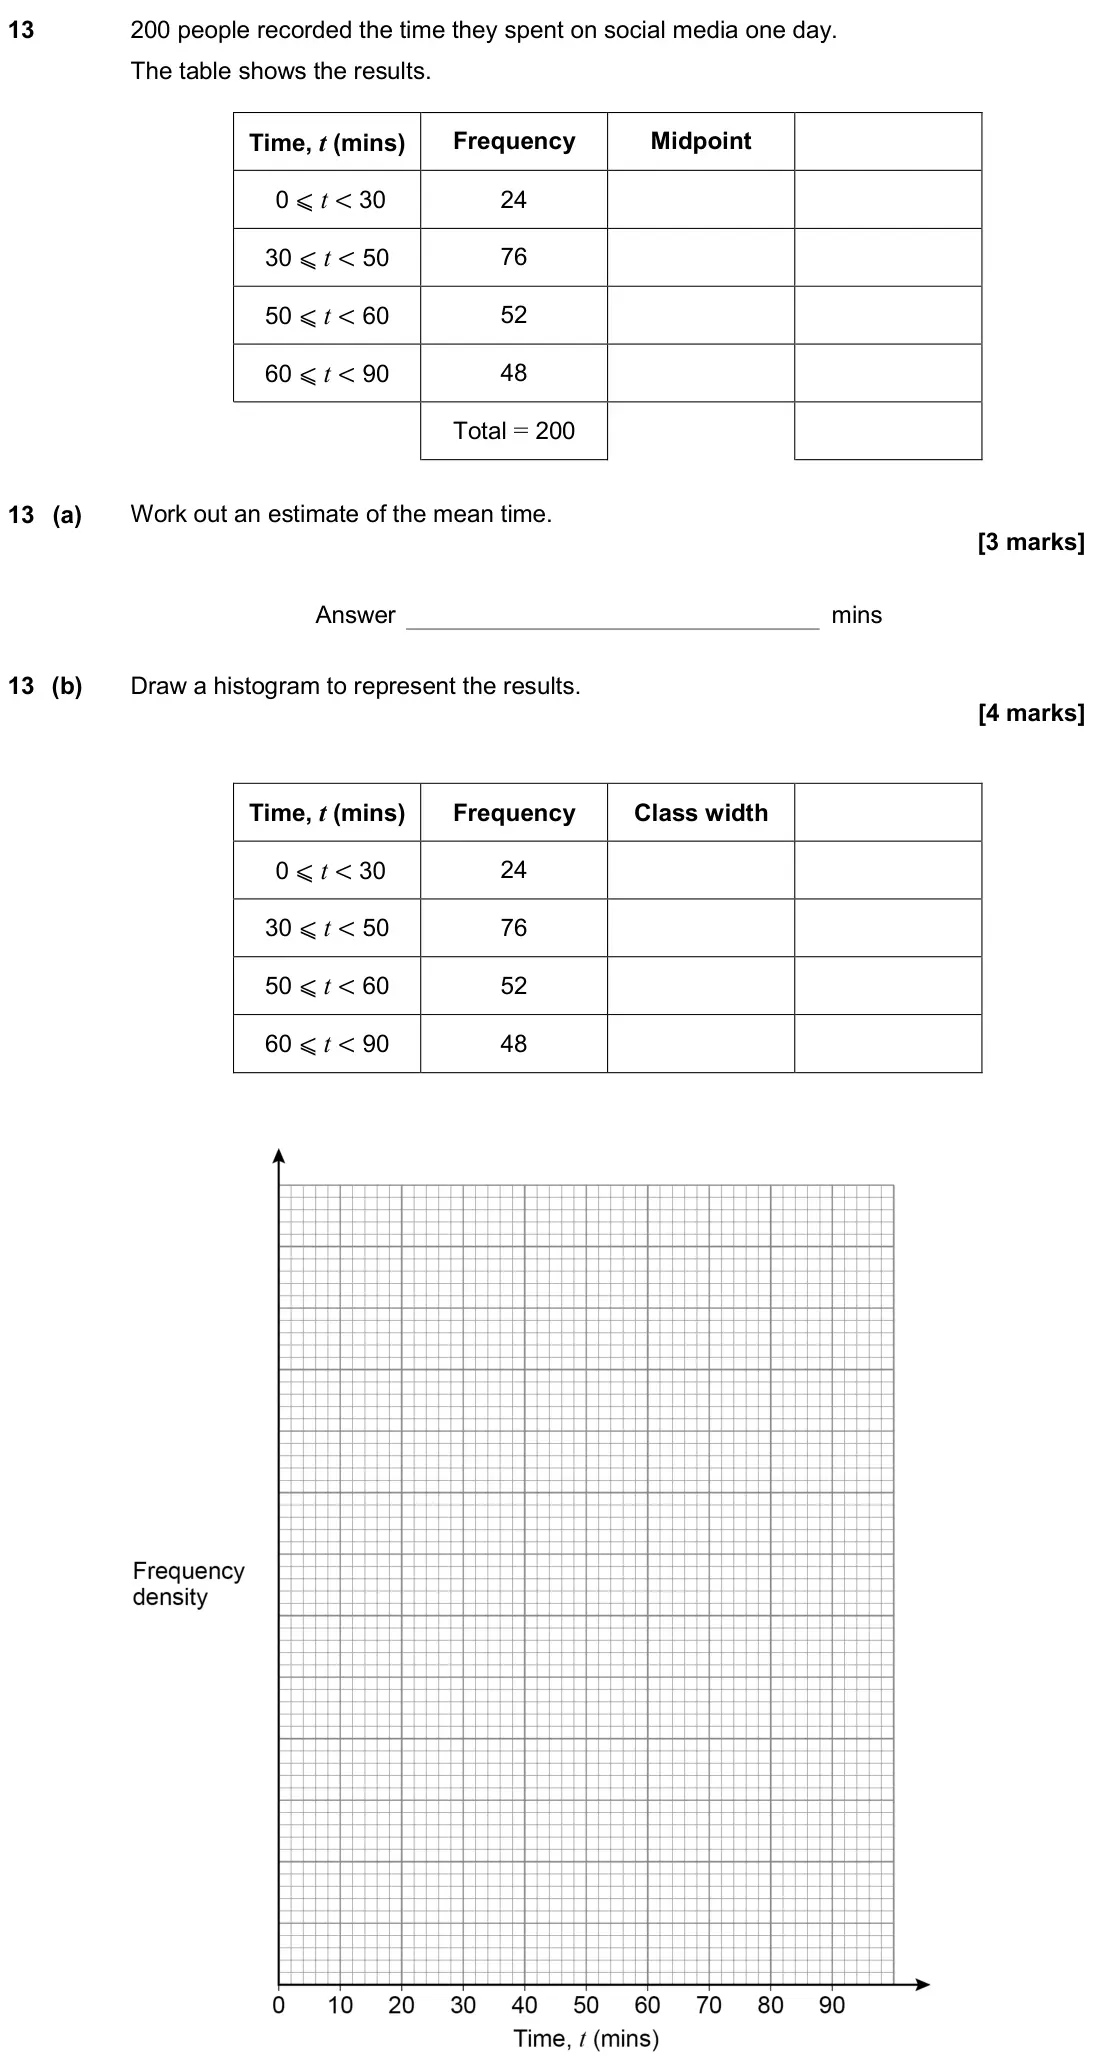
- November 2019, Paper 2H, Q13 (7 marks): 200 people recorded the time they spent on social media one day. The table shows the results. Time, t (mins) Frequency Midpoint 0 ⩽ t < 30 24 30 ⩽ t < 50 76 50
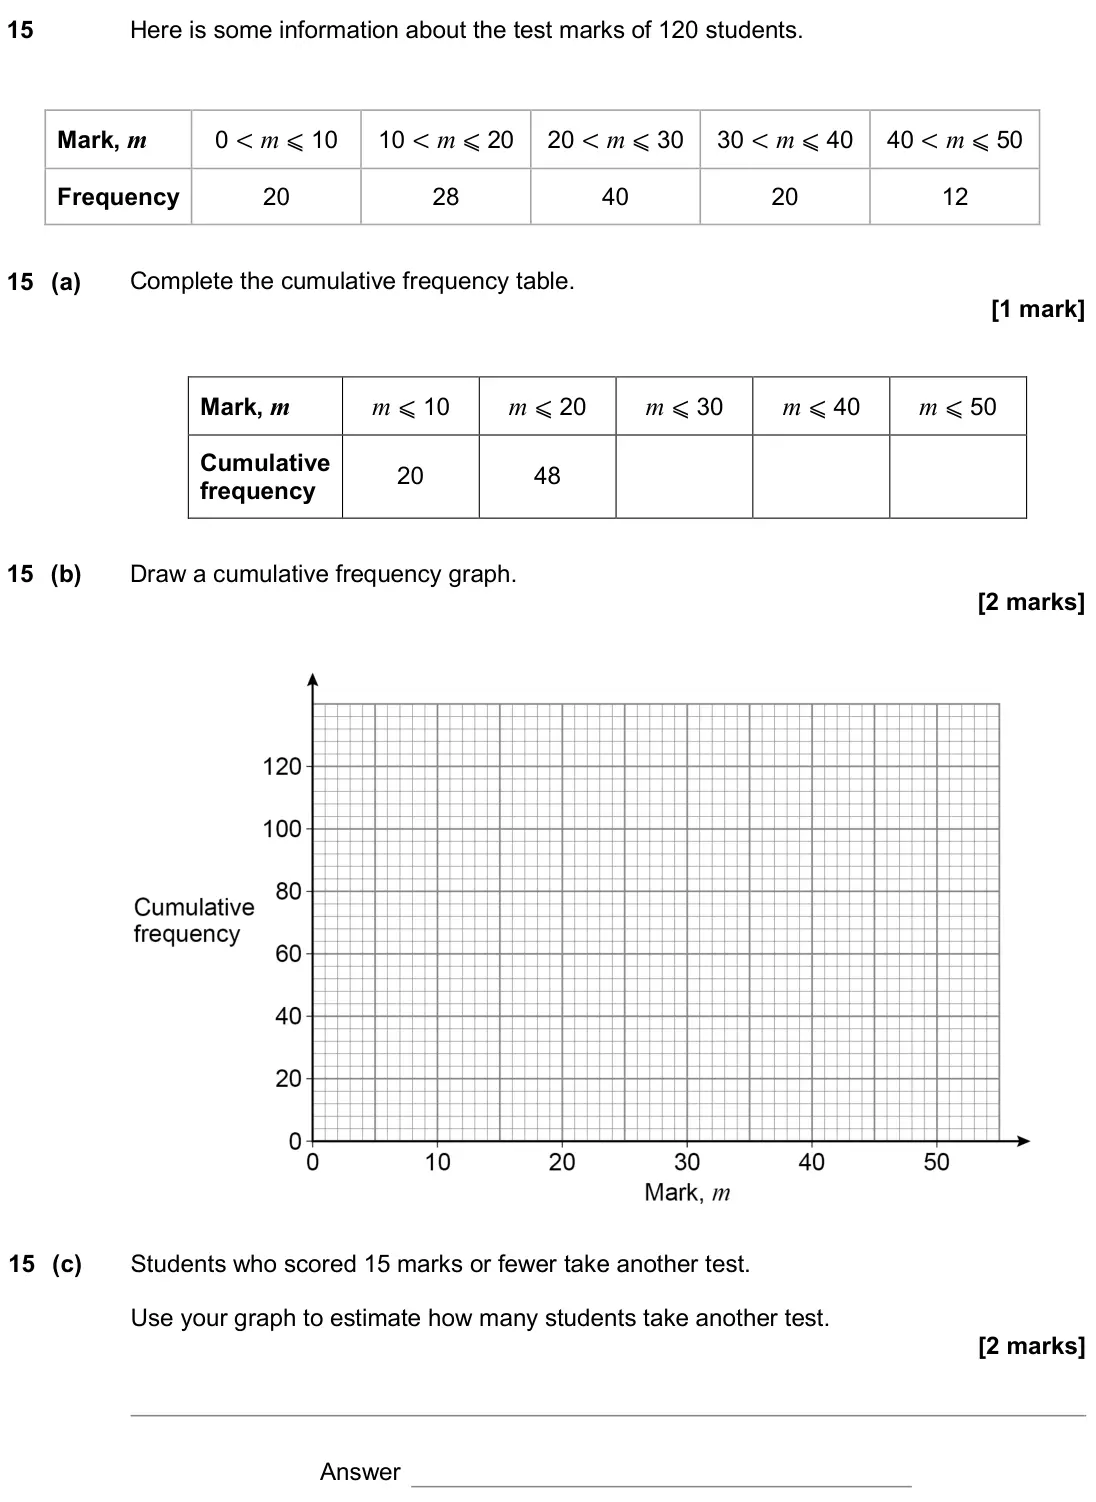
- June 2019, Paper 1H, Q15 (5 marks): Here is some information about the test marks of 120 students. Mark, m 0 < m ⩽ 10 10 < m ⩽ 20 20 < m ⩽ 30 30 < m ⩽ 40 40 < m ⩽ 50 Frequency 20 28 40 20 12 15 (a
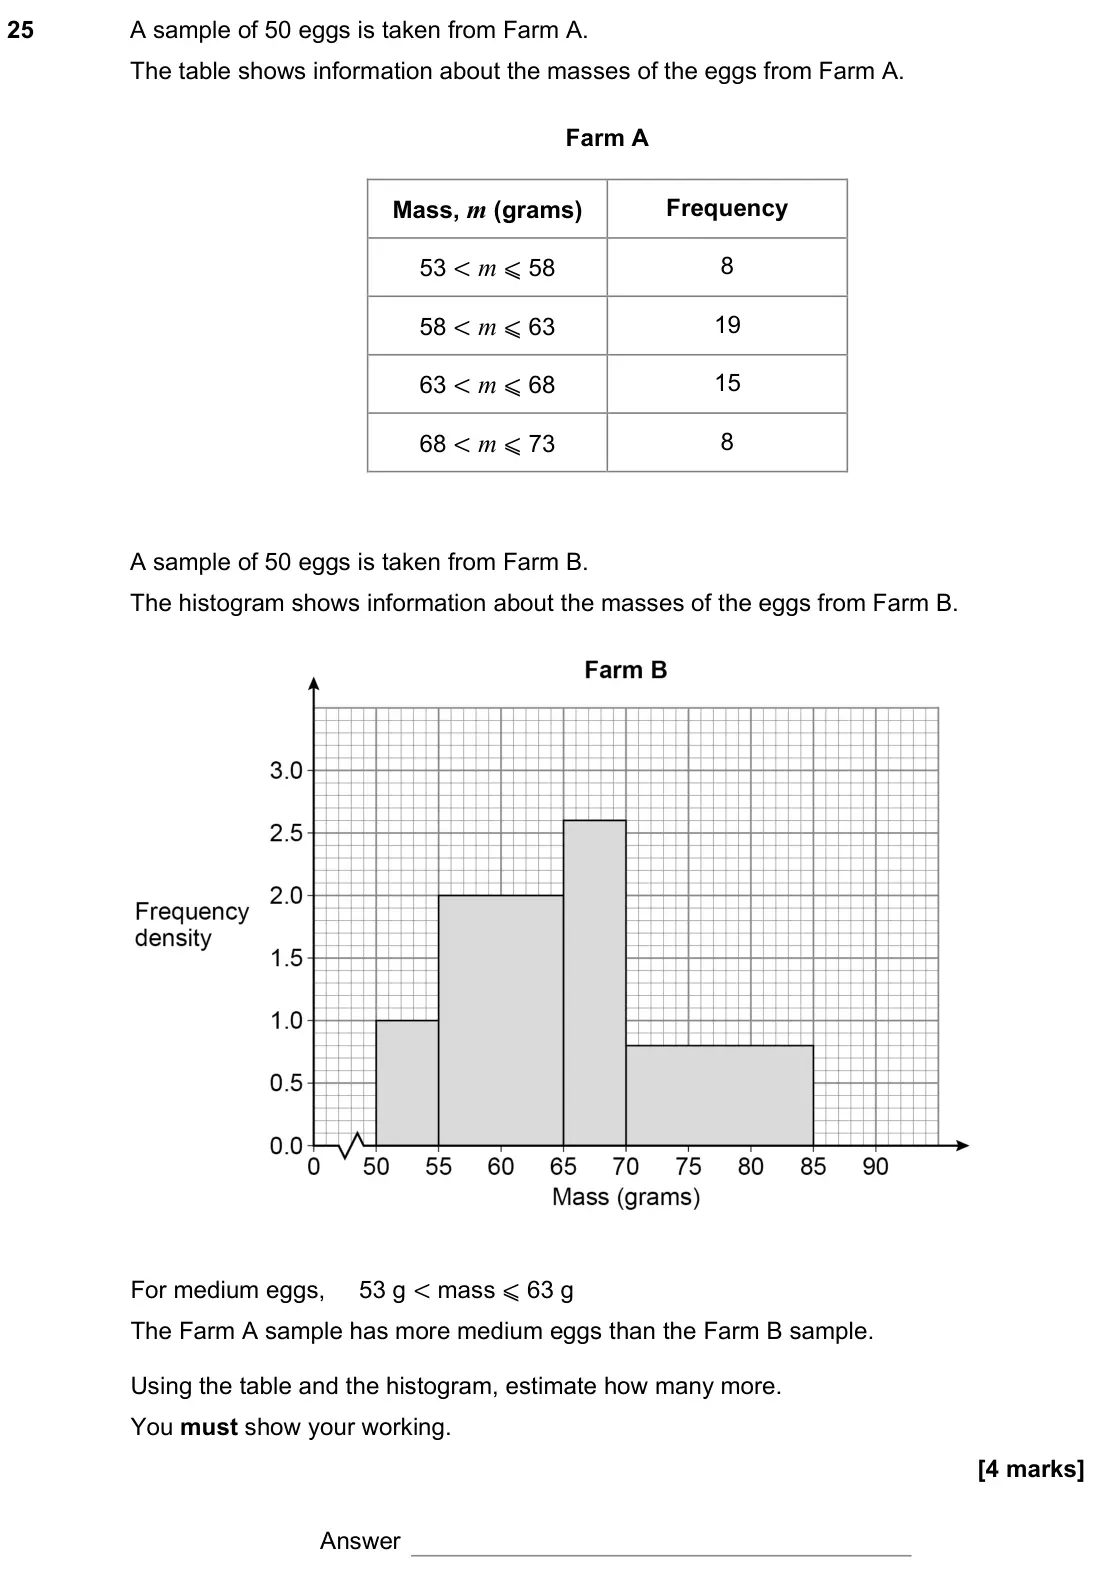
- June 2019, Paper 2H, Q25 (4 marks): A sample of 50 eggs is taken from Farm A. The table shows information about the masses of the eggs from Farm A. Farm A A sample of 50 eggs is taken from Farm B.
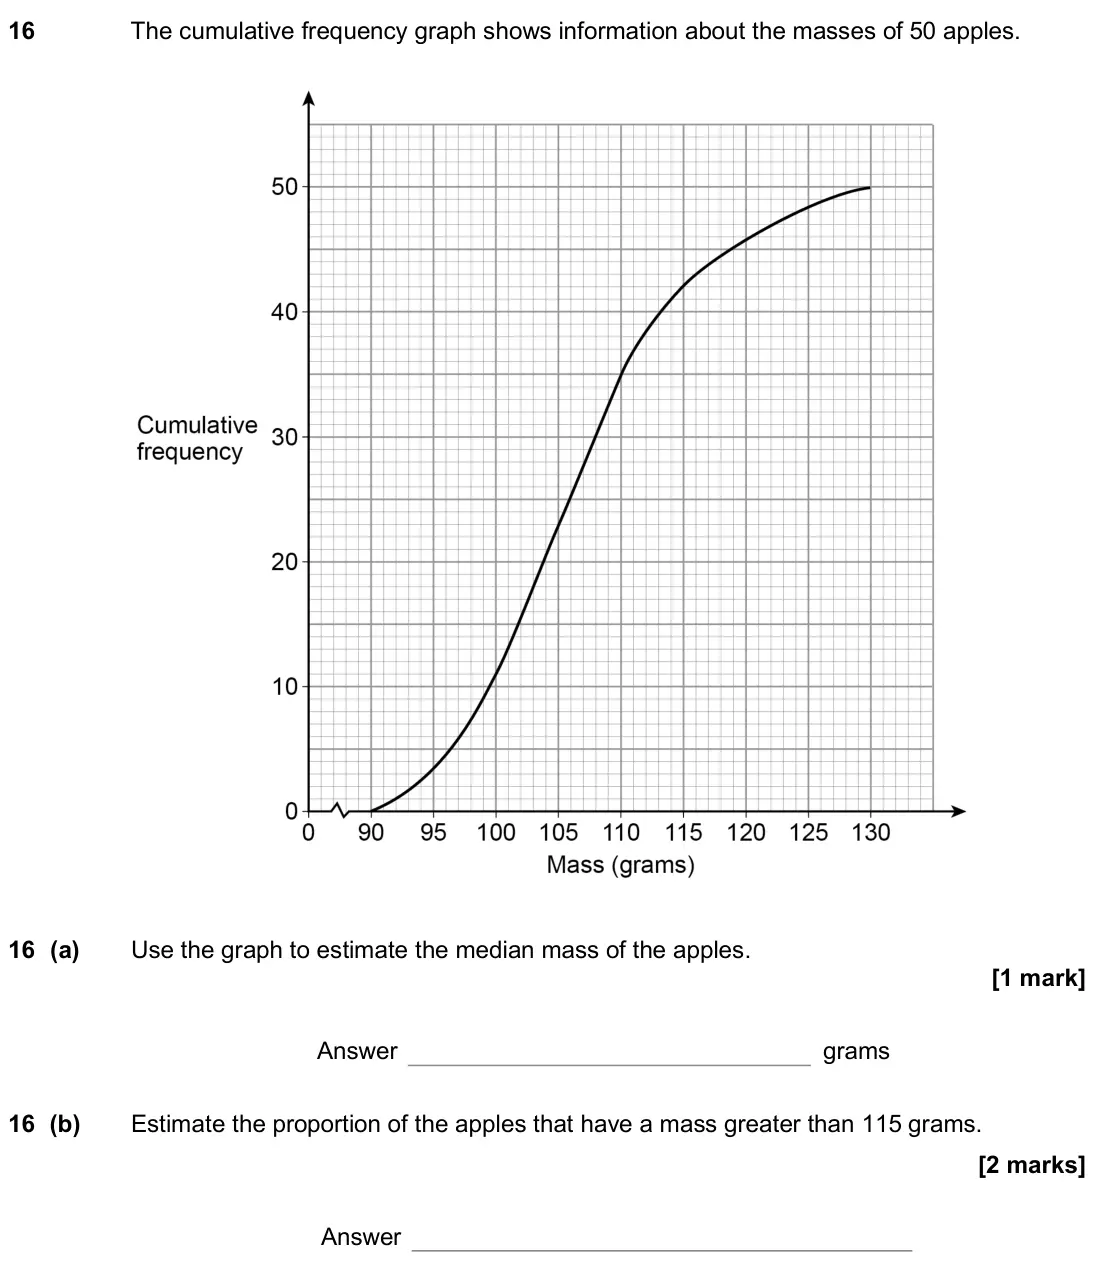
- November 2018, Paper 2H, Q16 (3 marks): The cumulative frequency graph shows information about the masses of 50 apples. 16 (a) Use the graph to estimate the median mass of the apples. Answer grams 16
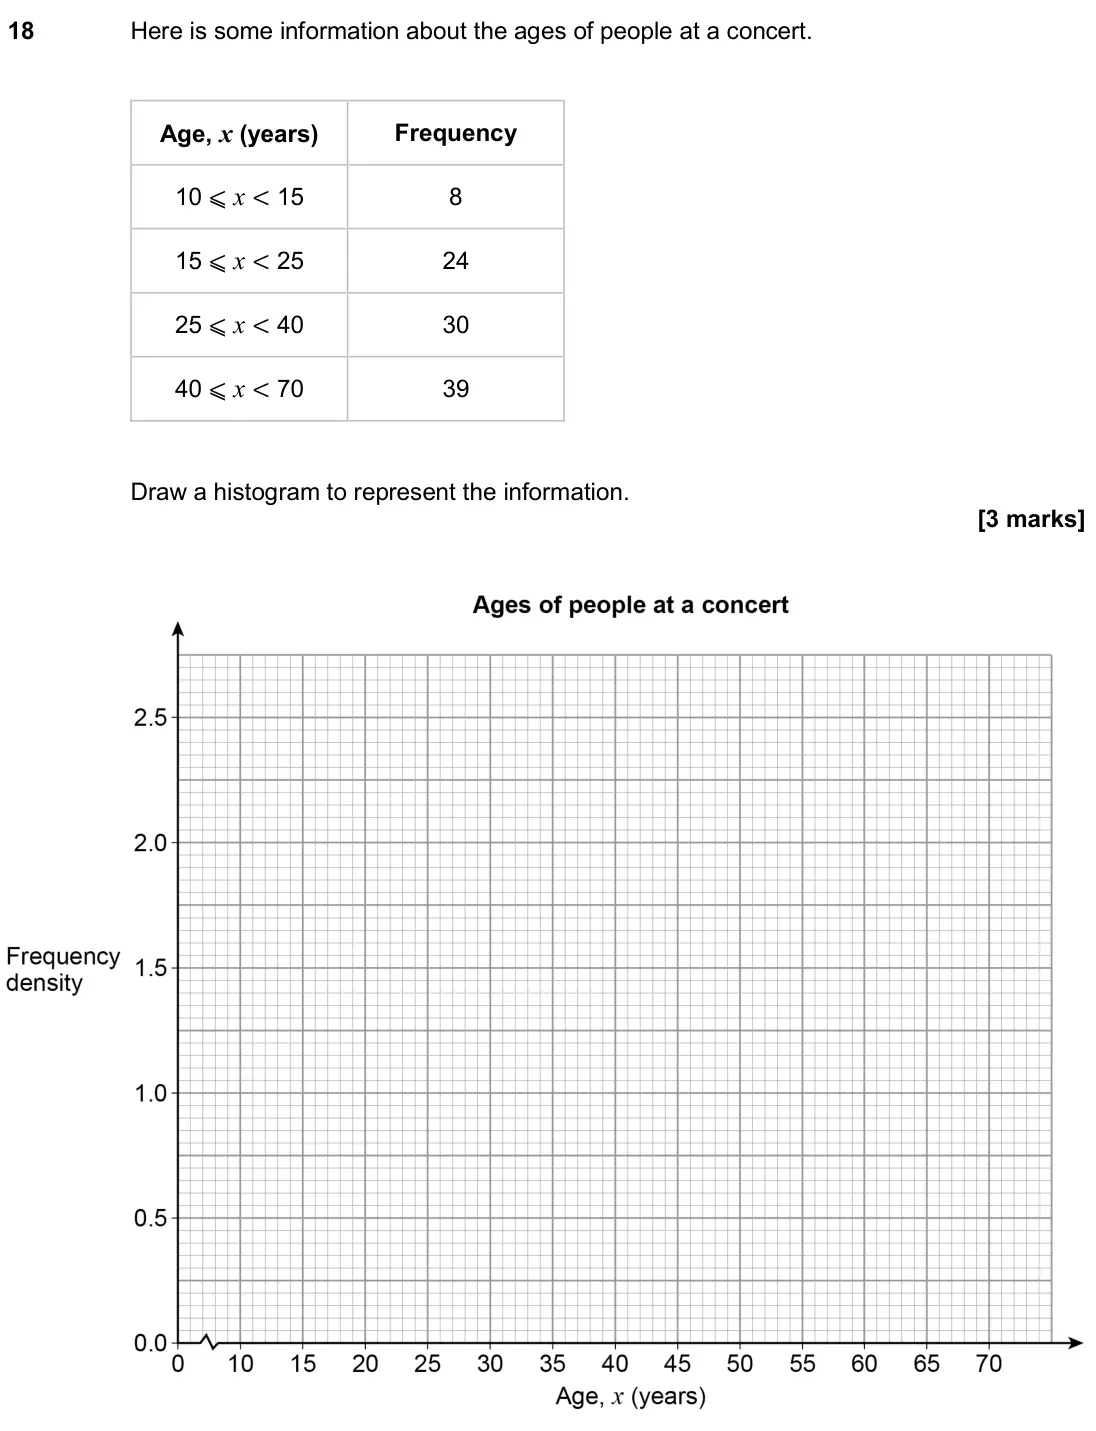
- November 2018, Paper 3H, Q18 (3 marks): Here is some information about the ages of people at a concert. Age, x (years) Frequency 10 ⩽ x < 15 8 15 ⩽ x < 25 24 25 ⩽ x < 40 30 40 ⩽ x < 70 39 Draw a histo
- June 2018, Paper 1H, Q19 (5 marks): Type A batteries and type B batteries were tested. The cumulative frequency diagram shows information about the battery life of type A. 19 (a) Estimate the inte
- June 2018, Paper 3H, Q26 (6 marks): The histogram shows information about the speed of cars as they pass a checkpoint. The scale on the frequency density axis is missing. The histogram shows infor
- November 2017, Paper 1H, Q22 (5 marks): Here is some information about the miles per gallon of 60 cars. Miles per gallon, x Frequency 40 < x ⩽ 50 6 50 < x ⩽ 60 16 60 < x ⩽ 70 28 70 < x ⩽ 80 10 22 (a)
- November 2017, Paper 2H, Q23 (5 marks): Here is some information about a tennis club. Members of a tennis club There are 30 members with A < 20 There are 12 members with 65 ⩽ A < 80 There are no membe
- June 2017, Paper 1H, Q19 (5 marks): Here is some information about the marks of 60 students in a test. Mark, m Frequency 40 < m ⩽ 50 9 50 < m ⩽ 60 16 60 < m ⩽ 70 20 70 < m ⩽ 80 8 80 < m ⩽ 90 7 19
- June 2017, Paper 2H, Q24 (4 marks): 48 students completed some homework. This histogram shows information about the times taken. Work out an estimate of the interquartile range. You must show your
- Specimen, Paper 2H, Q22 (4 marks): The histogram shows the ages, in years, of members of a chess club. 0 5 10 15 20 25 30 35 40 45 50 55 60 65 Age (years) Frequency density There are 22 members w
- Specimen, Paper 3H, Q13 (2 marks): Here are the examination marks for 60 pupils. Mark, m (%) Frequency 0 ⩽ m < 20 8 20 ⩽ m < 40 9 40 ⩽ m < 60 21 60 ⩽ m < 80 10 80 ⩽ m < 100 12 Molly drew this cum
Questions, mark schemes and examiner’s reports are © AQA, from their published past papers. Plumi isn’t affiliated with any exam board. Want whole papers? Every AQA GCSE Maths paper.
Rather write your answers by hand on iPad? Plumi marks them against the same mark schemes.