Skip to content

Charts and tables: AQA GCSE Maths questions

Every AQA GCSE Maths exam question on S2 Charts and tables, 2017–2025, with its mark scheme and examiner’s report.

Find questions1,304
Exam
All years
Calculator
1,304 questions

  1. Q3

    June 2025 · Paper 2H

    The whole paper ↗
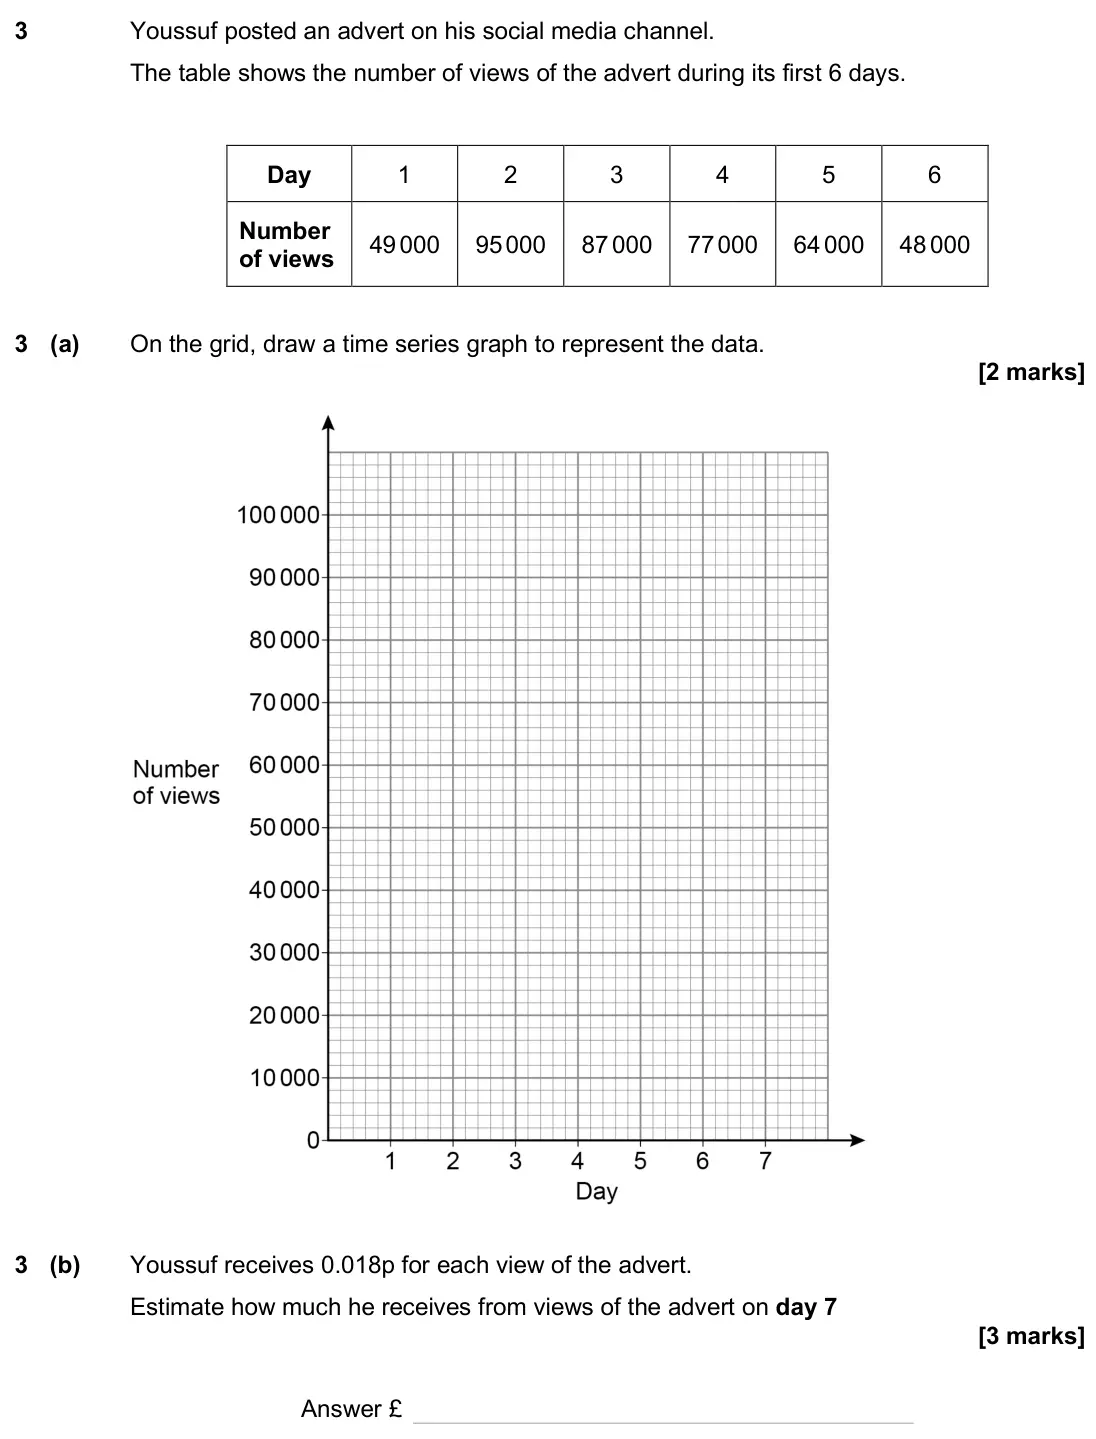
    June 2025 Paper 2H, question 3: Youssuf posted an advert on his social media channel. The table shows the number of views of the advert during its first 6 days. Day 1 2 3 4 5 6 Number of views
  2. Q5

    June 2025 · Paper 3H

    The whole paper ↗
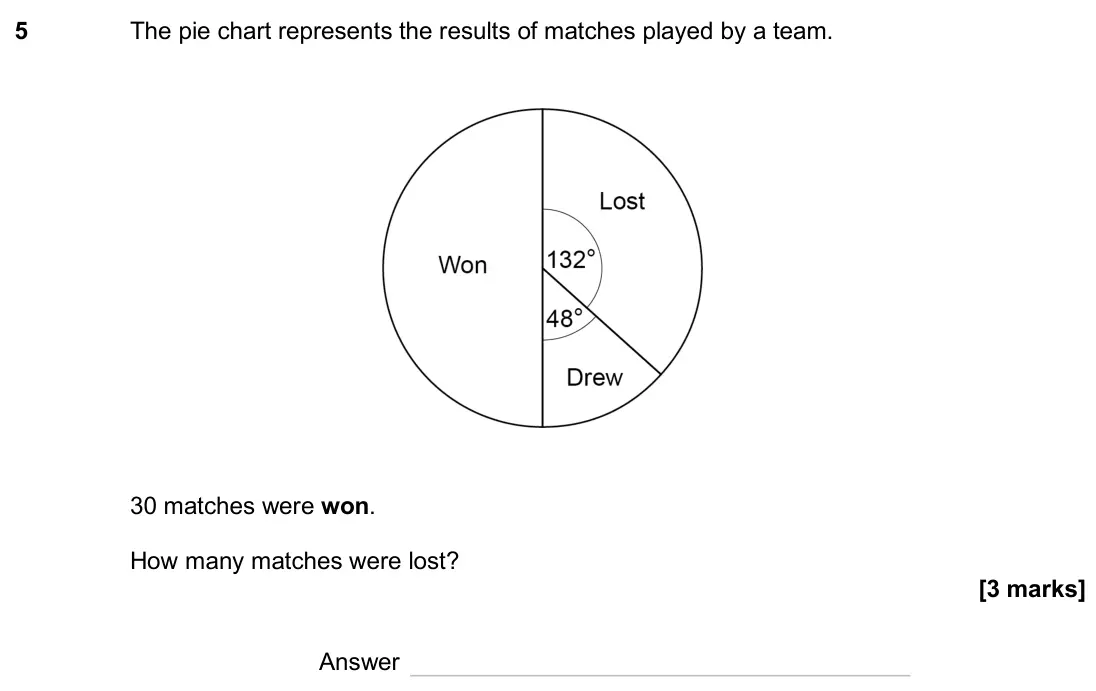
    June 2025 Paper 3H, question 5: The pie chart represents the results of matches played by a team. 30 matches were won. How many matches were lost? Answer
  3. Q2

    November 2024 · Paper 3H

    The whole paper ↗
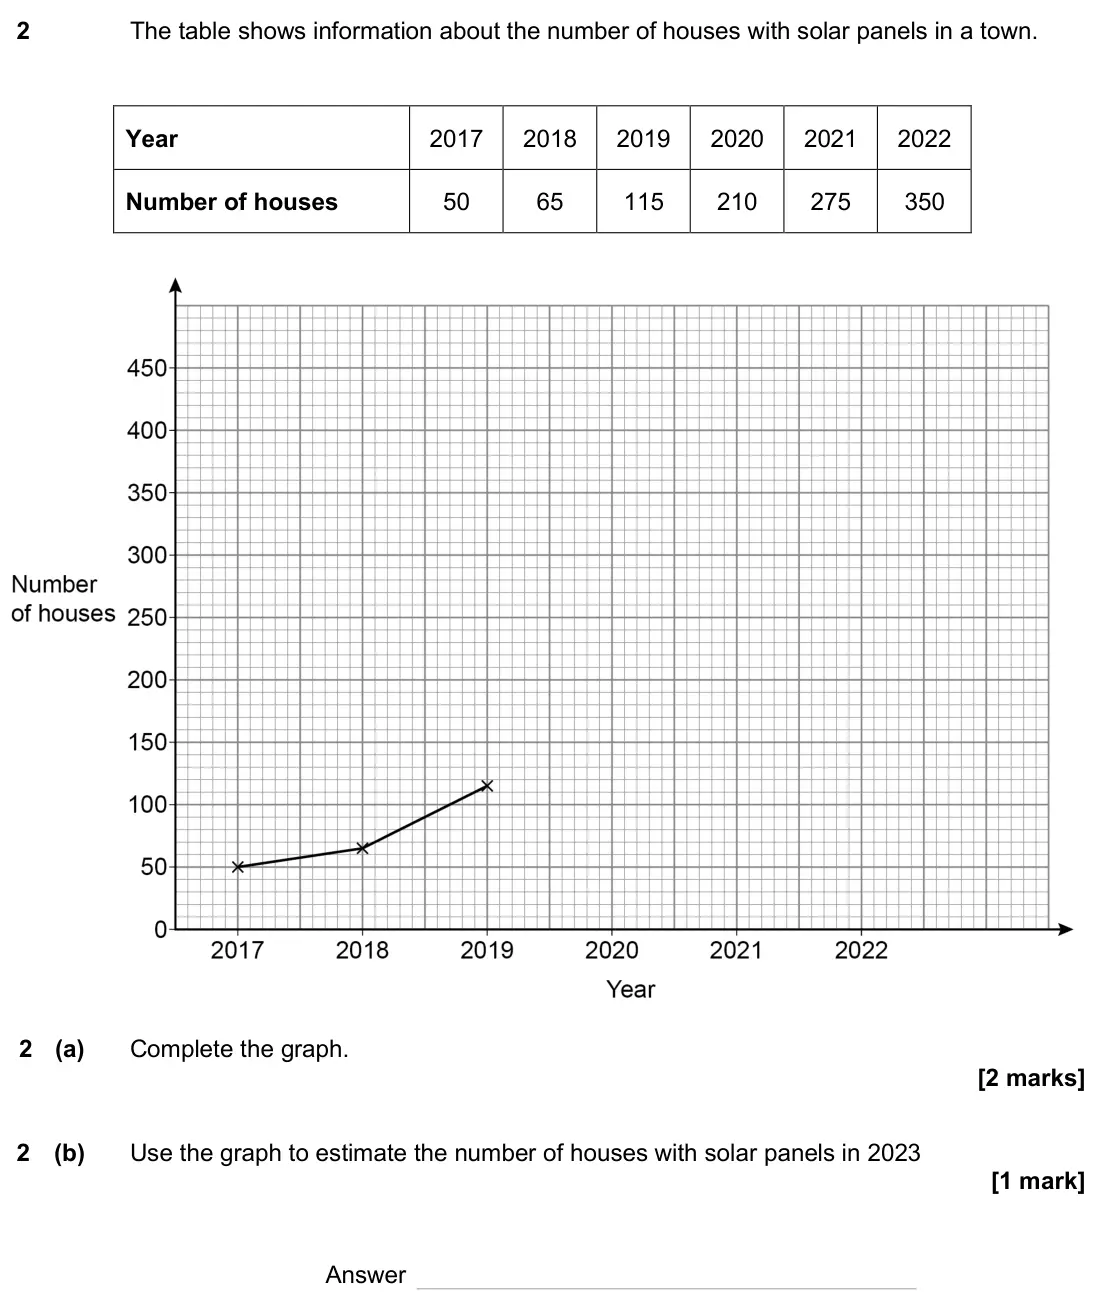
    November 2024 Paper 3H, question 2: The table shows information about the number of houses with solar panels in a town. Year 2017 2018 2019 2020 2021 2022 Number of houses 50 65 115 210 275 350 2
  4. Q6

    June 2024 · Paper 1H

    The whole paper ↗
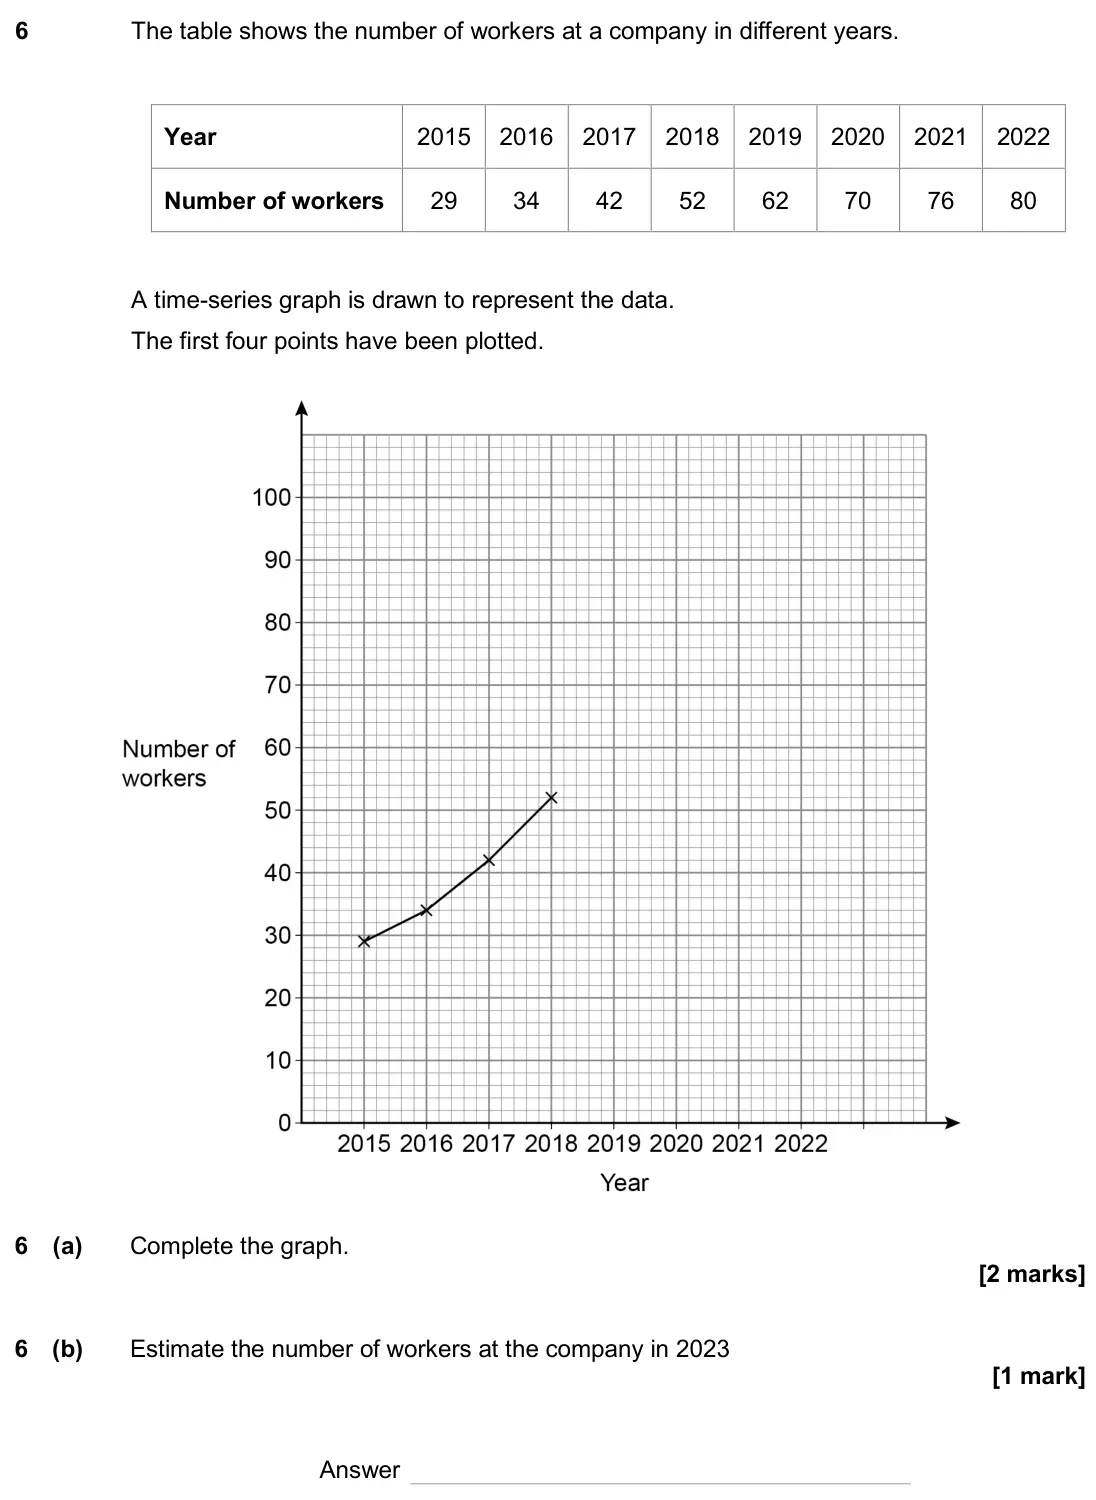
    June 2024 Paper 1H, question 6: The table shows the number of workers at a company in different years. Year 2015 2016 2017 2018 2019 2020 2021 2022 Number of workers 29 34 42 52 62 70 76 80 A
  5. Q8

    June 2024 · Paper 3H

    The whole paper ↗
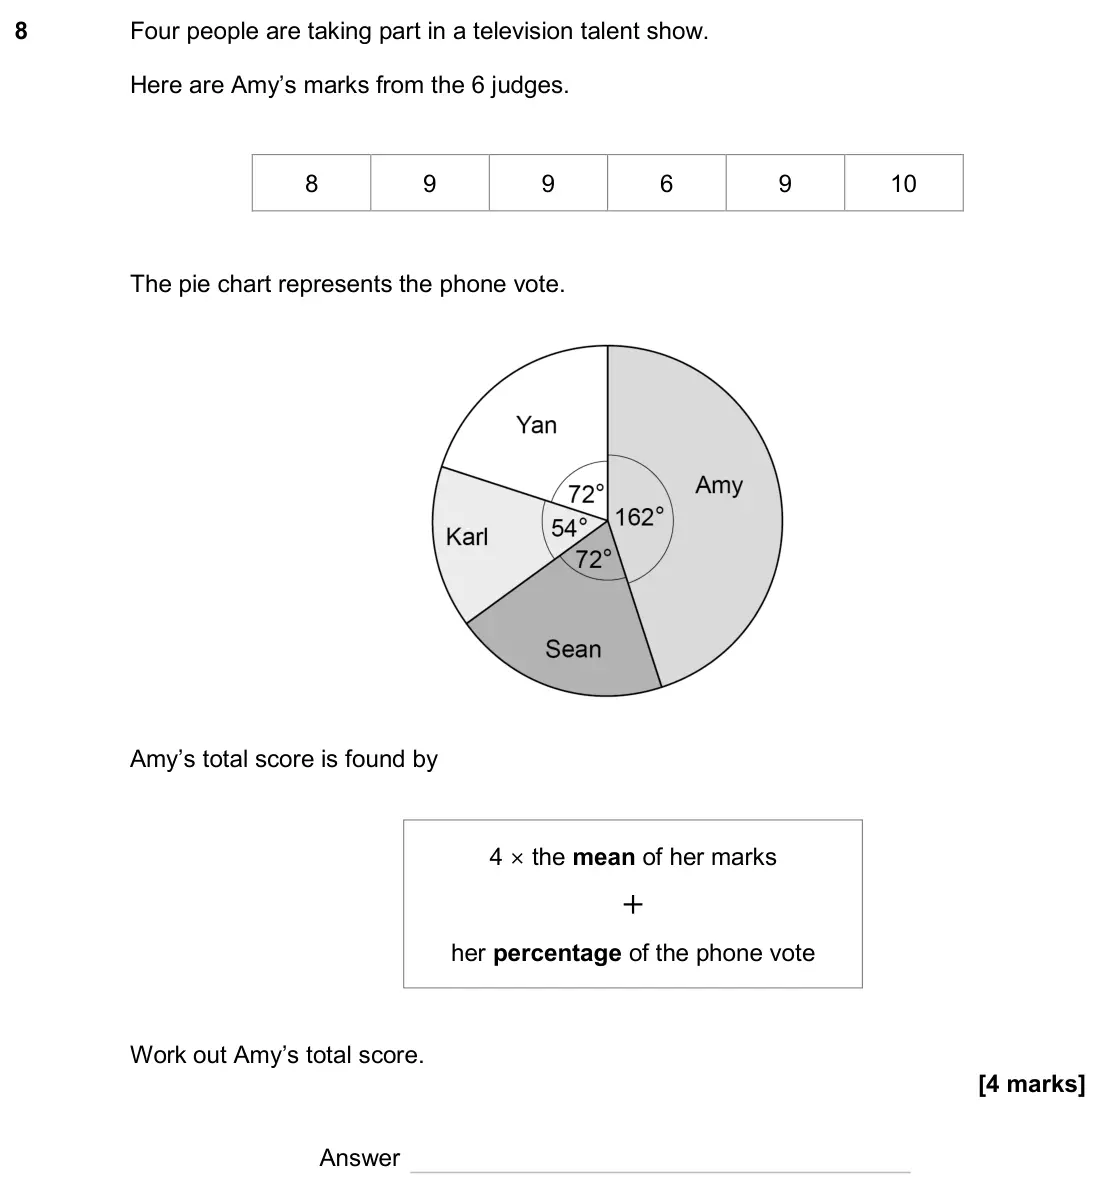
    June 2024 Paper 3H, question 8: Four people are taking part in a television talent show. Here are Amy’s marks from the 6 judges. 8 9 9 6 9 10 The pie chart represents the phone vote. Amy’s tot
  6. Q6

    November 2023 · Paper 2H

    The whole paper ↗
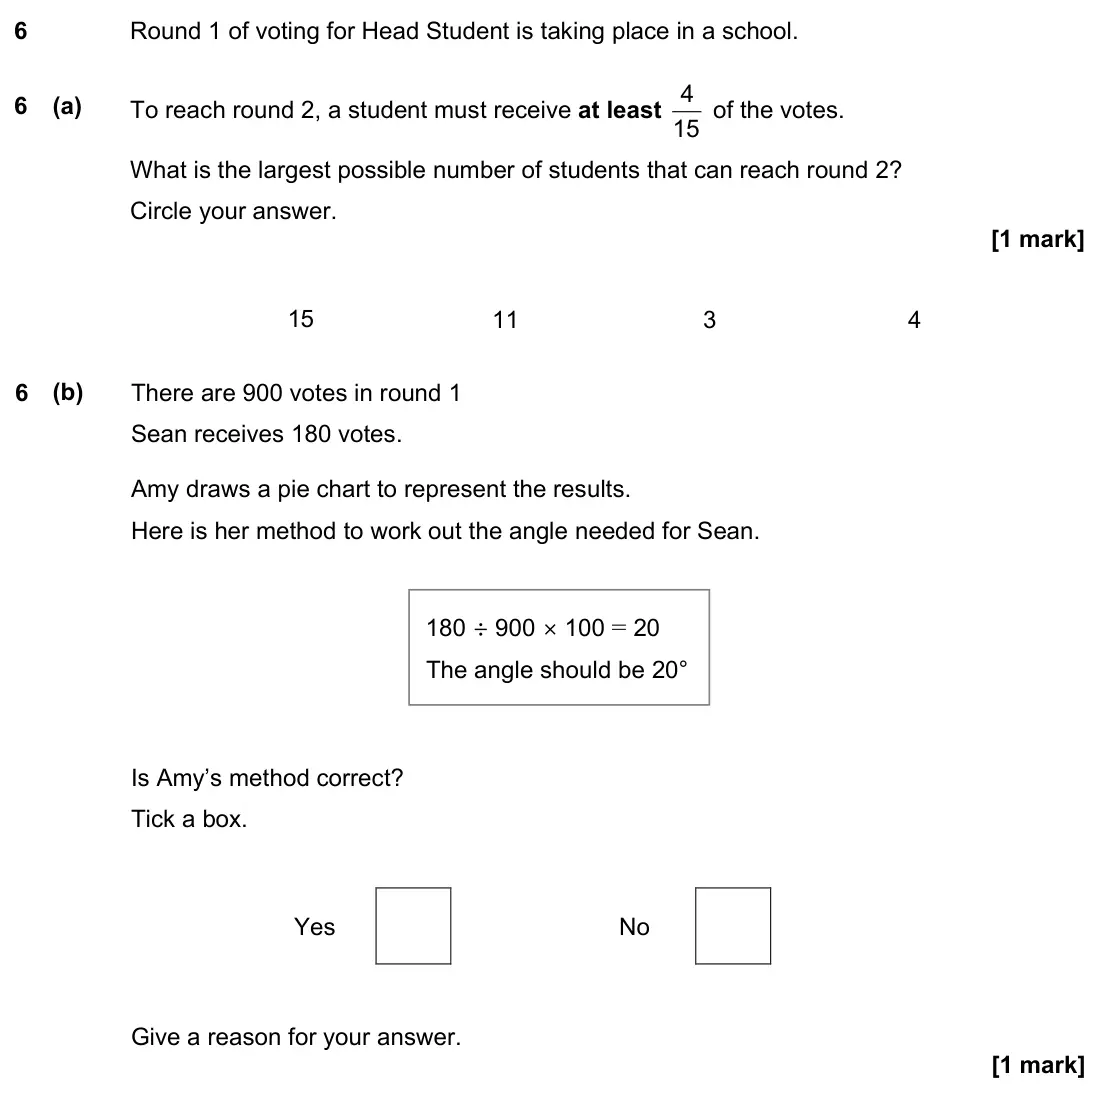
    November 2023 Paper 2H, question 6: Round 1 of voting for Head Student is taking place in a school. 6 (a) To reach round 2, a student must receive at least 15 4 of the votes. What is the largest p
  7. Q9

    June 2023 · Paper 3H

    The whole paper ↗
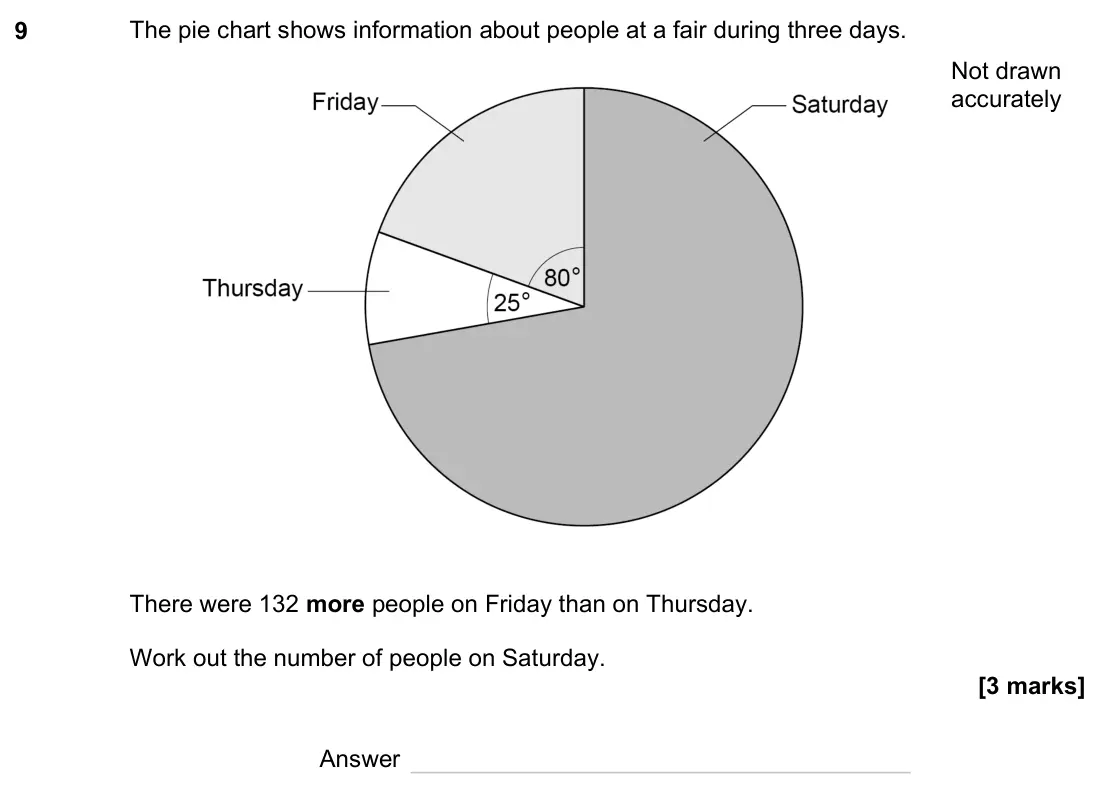
    June 2023 Paper 3H, question 9: The pie chart shows information about people at a fair during three days. There were 132 more people on Friday than on Thursday. Work out the number of people o
  8. Q6

    November 2022 · Paper 2H

    The whole paper ↗
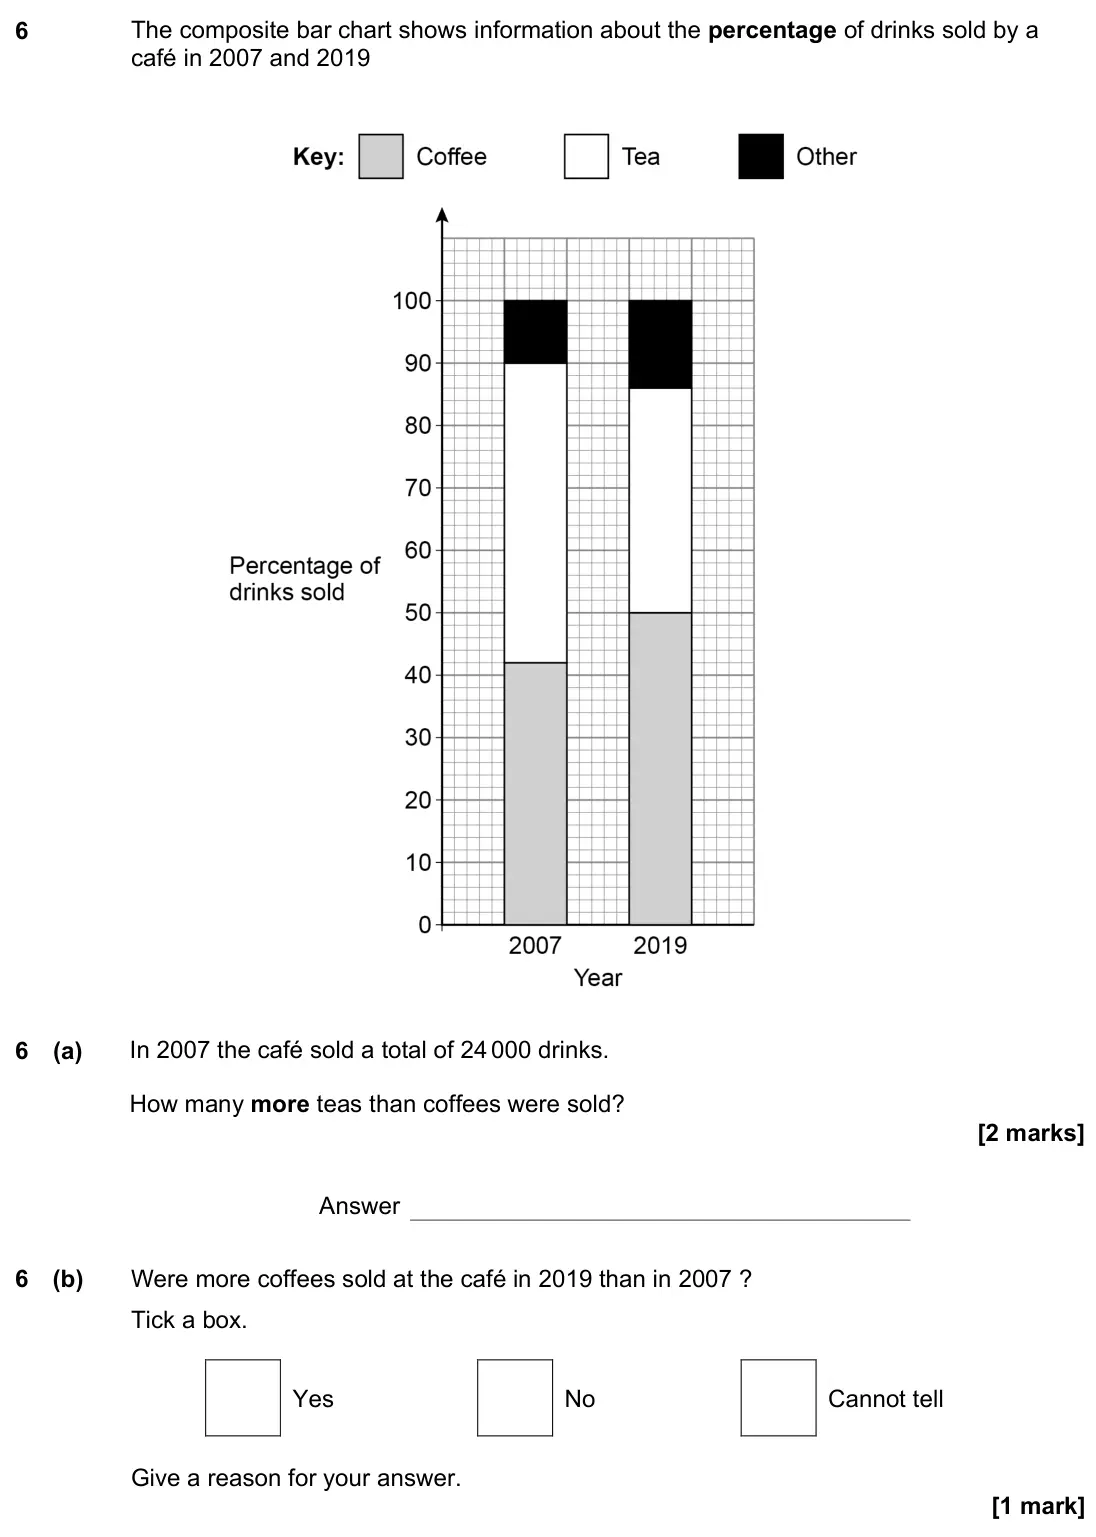
    November 2022 Paper 2H, question 6: The composite bar chart shows information about the percentage of drinks sold by a café in 2007 and 2019 6 (a) In 2007 the café sold a total of 24 000 drinks. H
  9. Q14

    June 2022 · Paper 2H

    The whole paper ↗
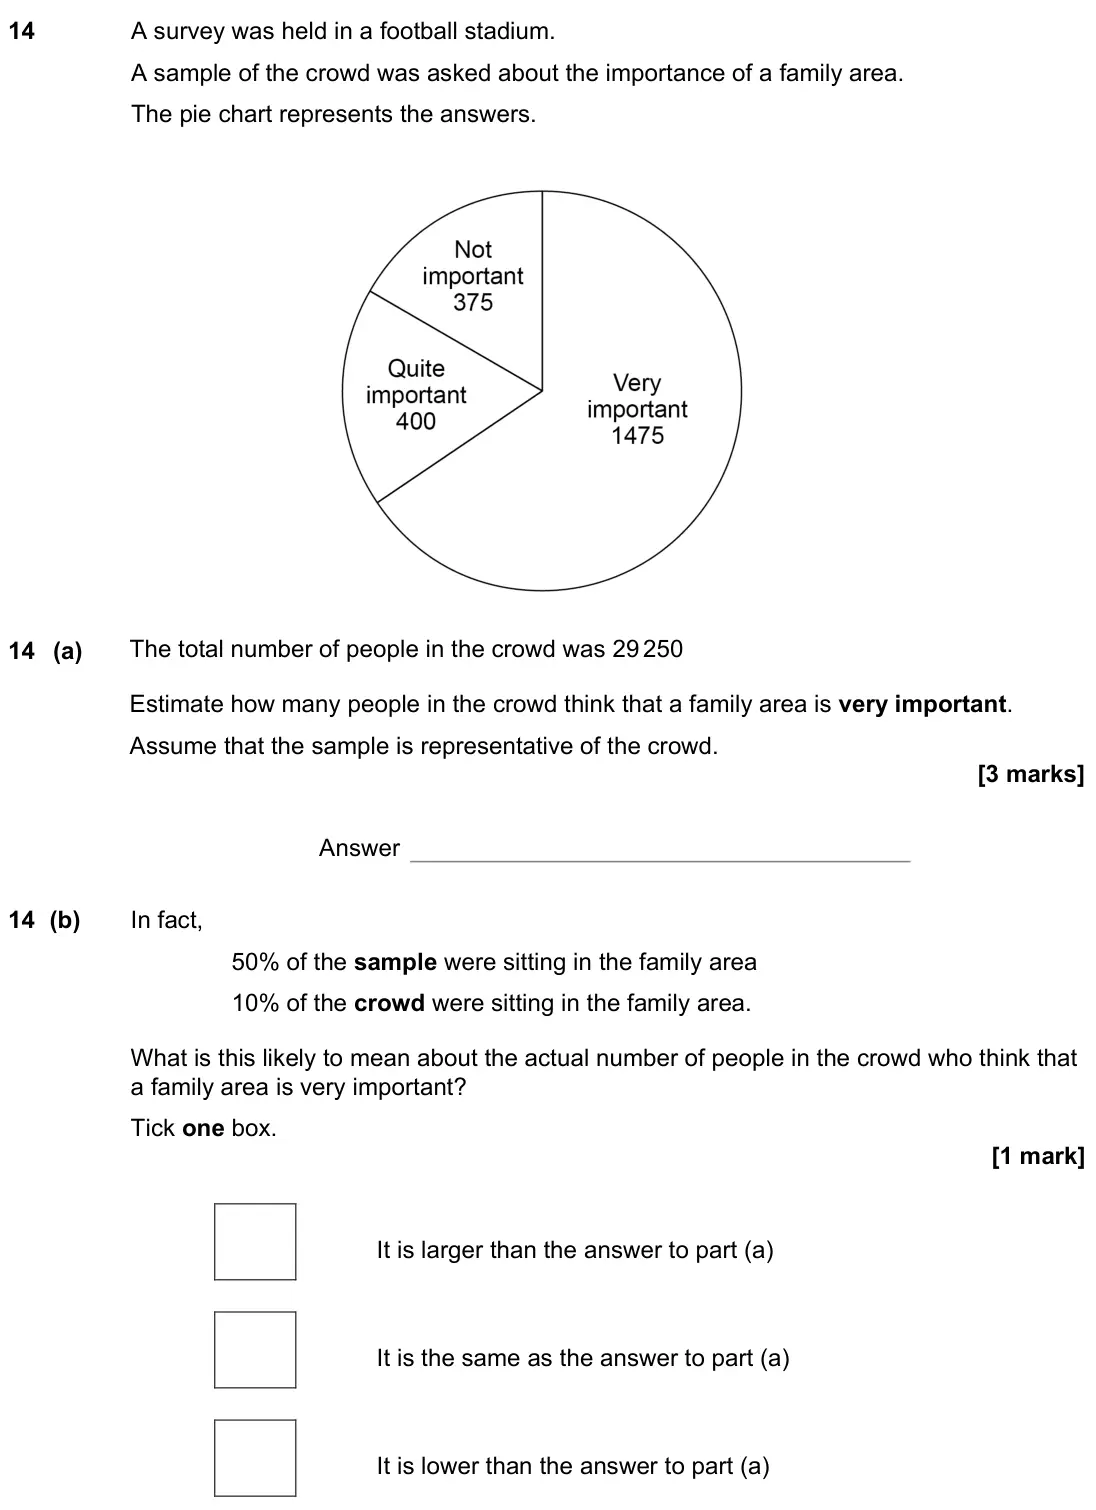
    June 2022 Paper 2H, question 14: A survey was held in a football stadium. A sample of the crowd was asked about the importance of a family area. The pie chart represents the answers. 14 (a) The
  10. Q5

    November 2020 · Paper 2H

    The whole paper ↗
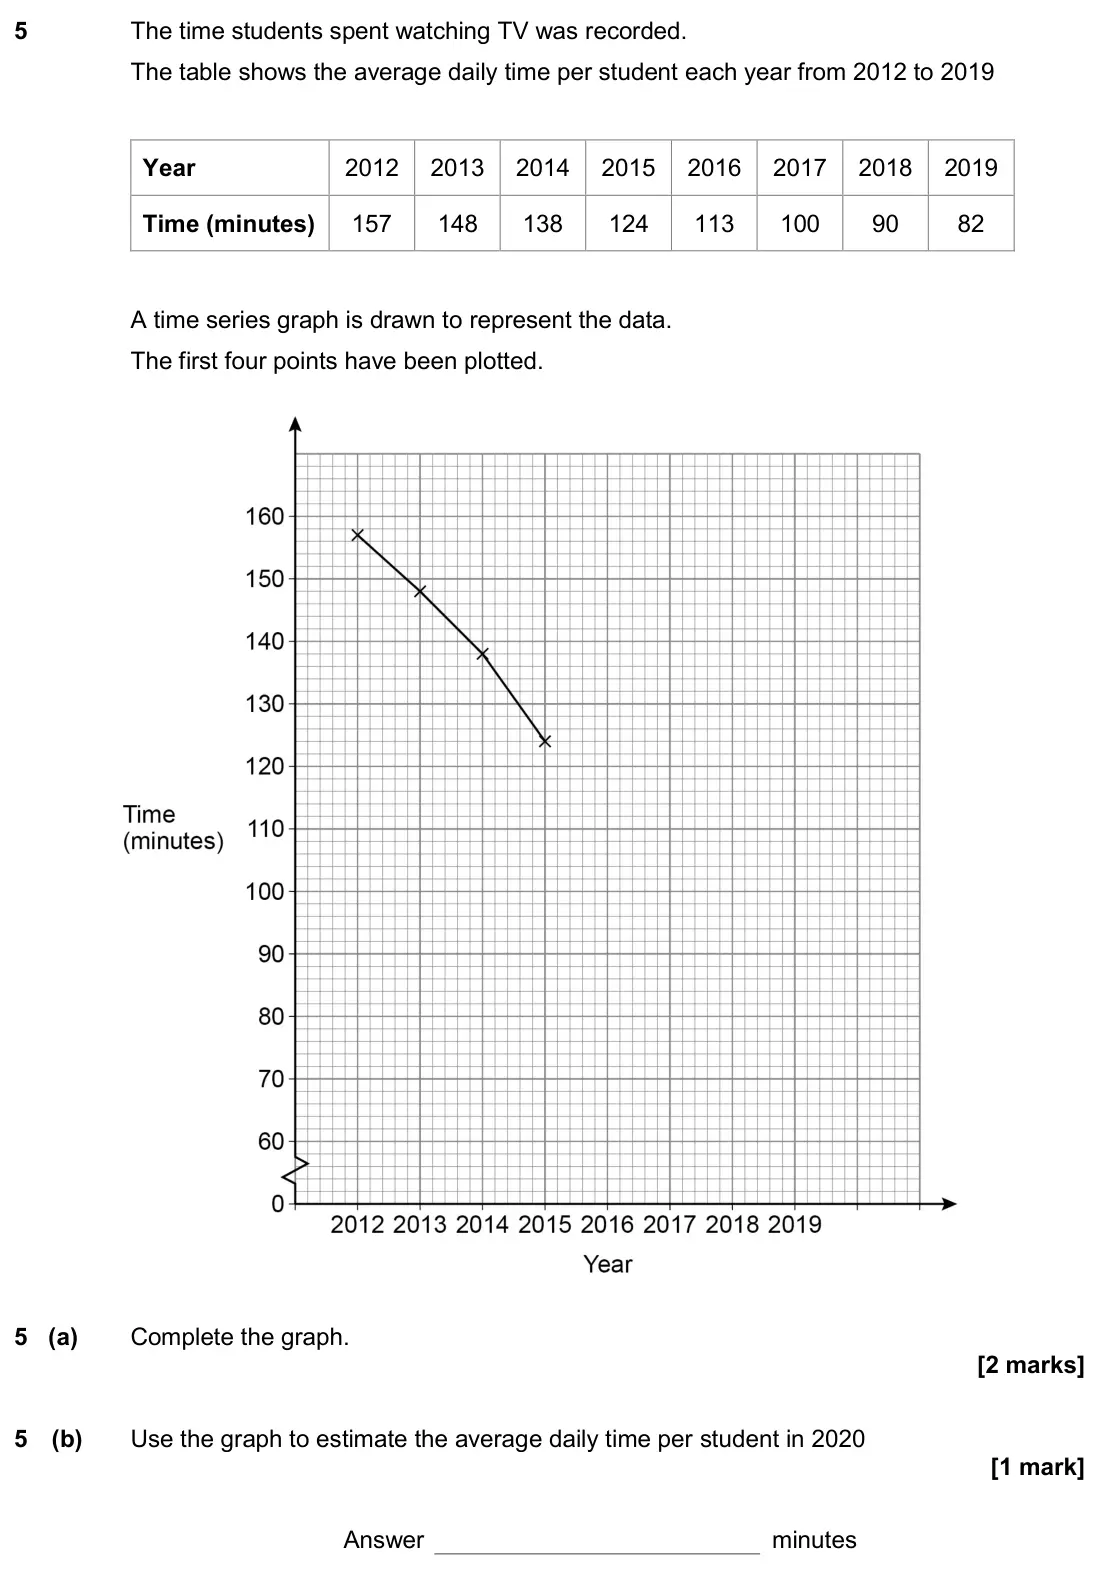
    November 2020 Paper 2H, question 5: The time students spent watching TV was recorded. The table shows the average daily time per student each year from 2012 to 2019 Year 2012 2013 2014 2015 2016 2
  11. Q9

    November 2019 · Paper 3H

    The whole paper ↗
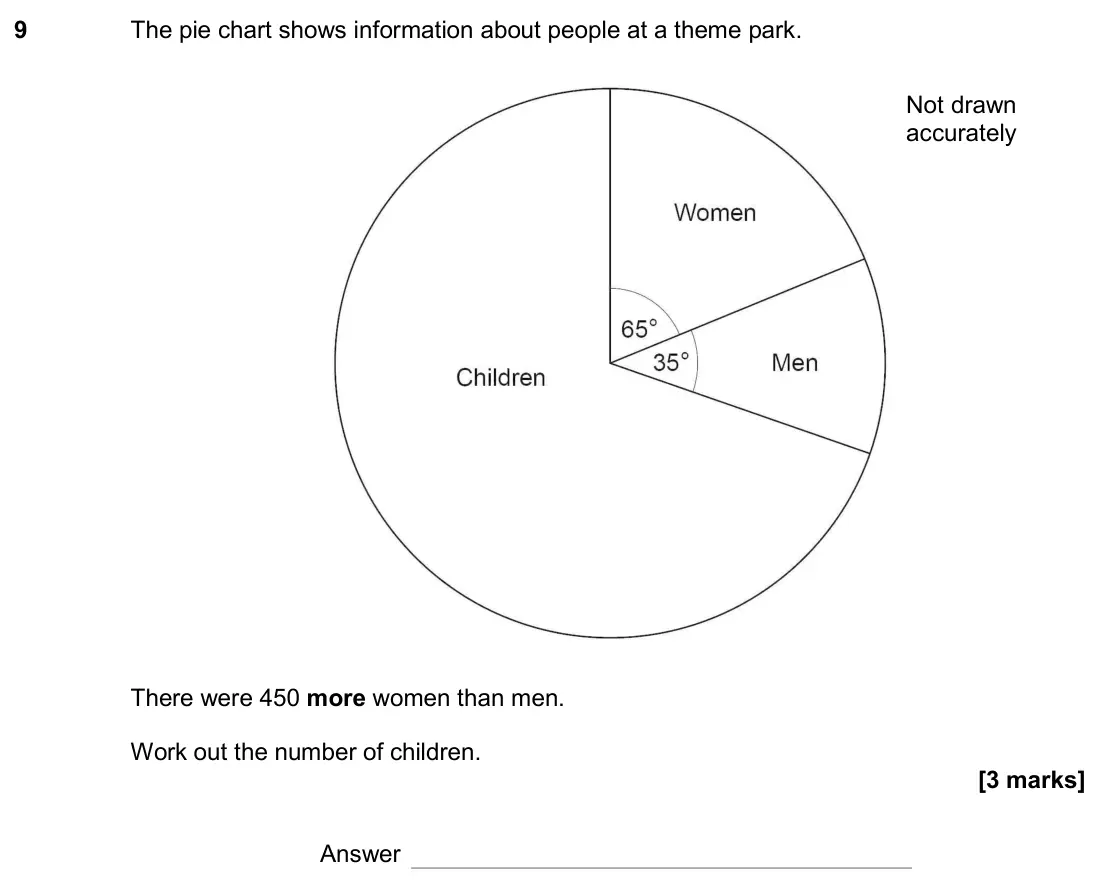
    November 2019 Paper 3H, question 9: The pie chart shows information about people at a theme park. Not drawn accurately There were 450 more women than men. Work out the number of children. Answer
  12. Q9

    June 2019 · Paper 2H

    The whole paper ↗
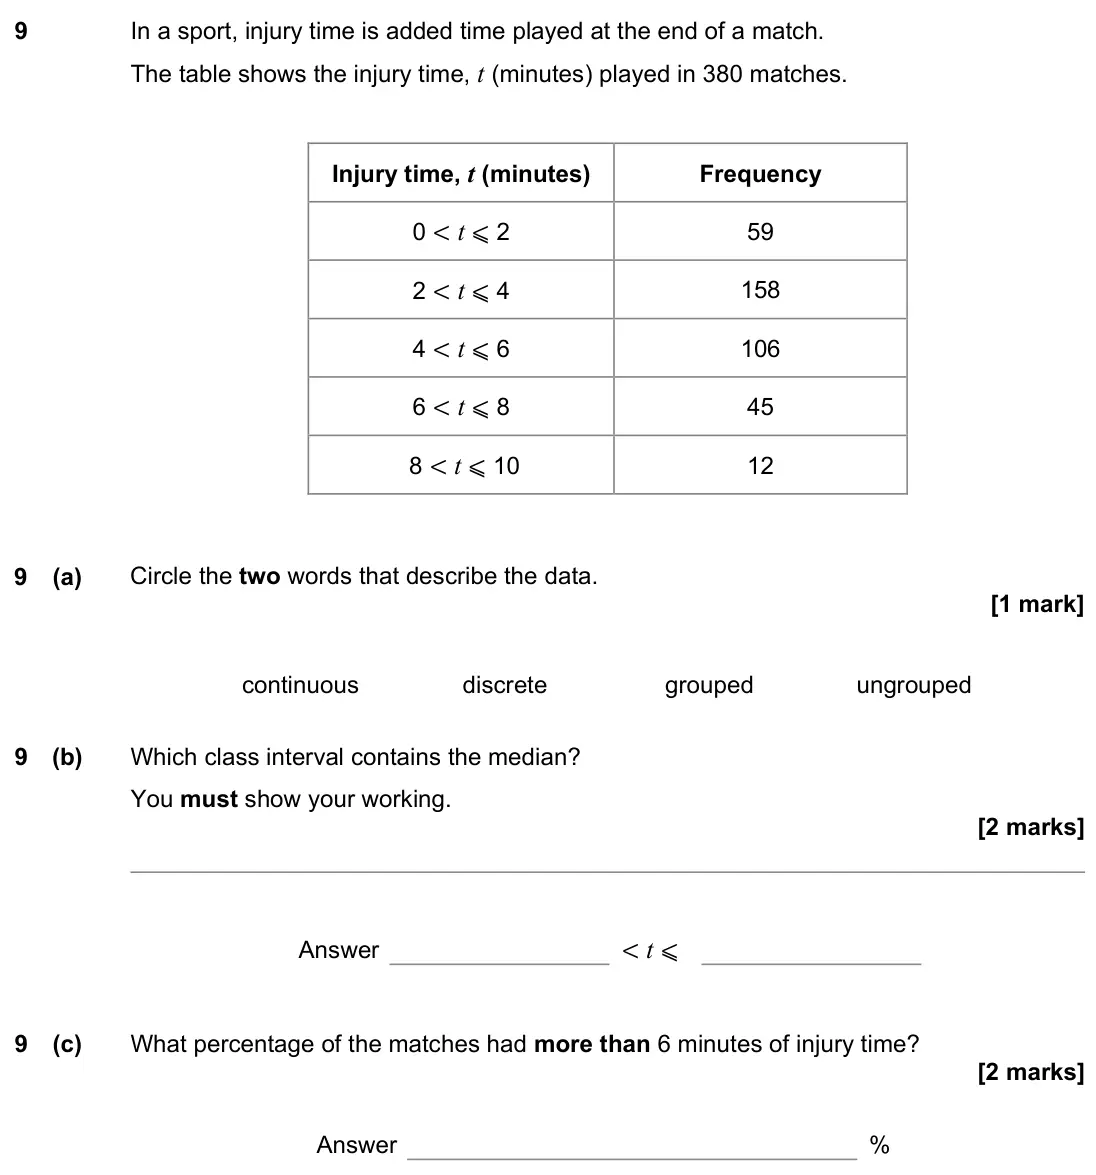
    June 2019 Paper 2H, question 9: In a sport, injury time is added time played at the end of a match. The table shows the injury time, t (minutes) played in 380 matches. Injury time, t (minutes)
  13. Q6

    November 2018 · Paper 3H

    The whole paper ↗
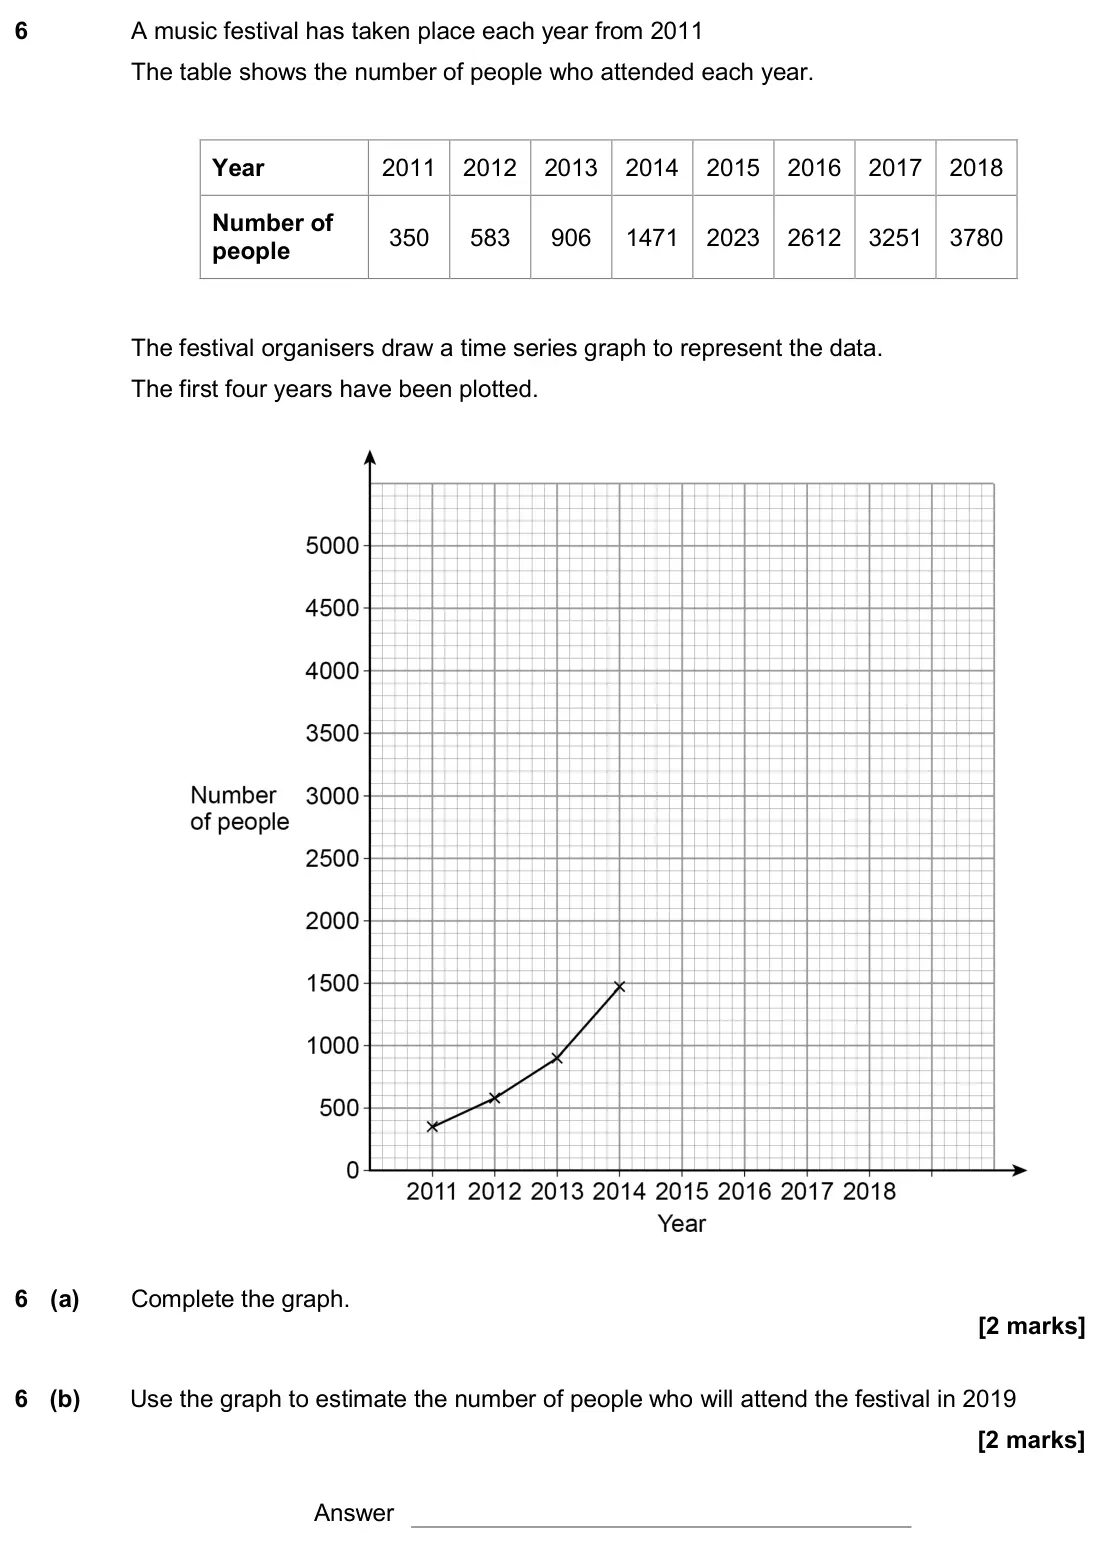
    November 2018 Paper 3H, question 6: A music festival has taken place each year from 2011 The table shows the number of people who attended each year. Year 2011 2012 2013 2014 2015 2016 2017 2018 N
  14. Q11

    November 2017 · Paper 1H

    The whole paper ↗
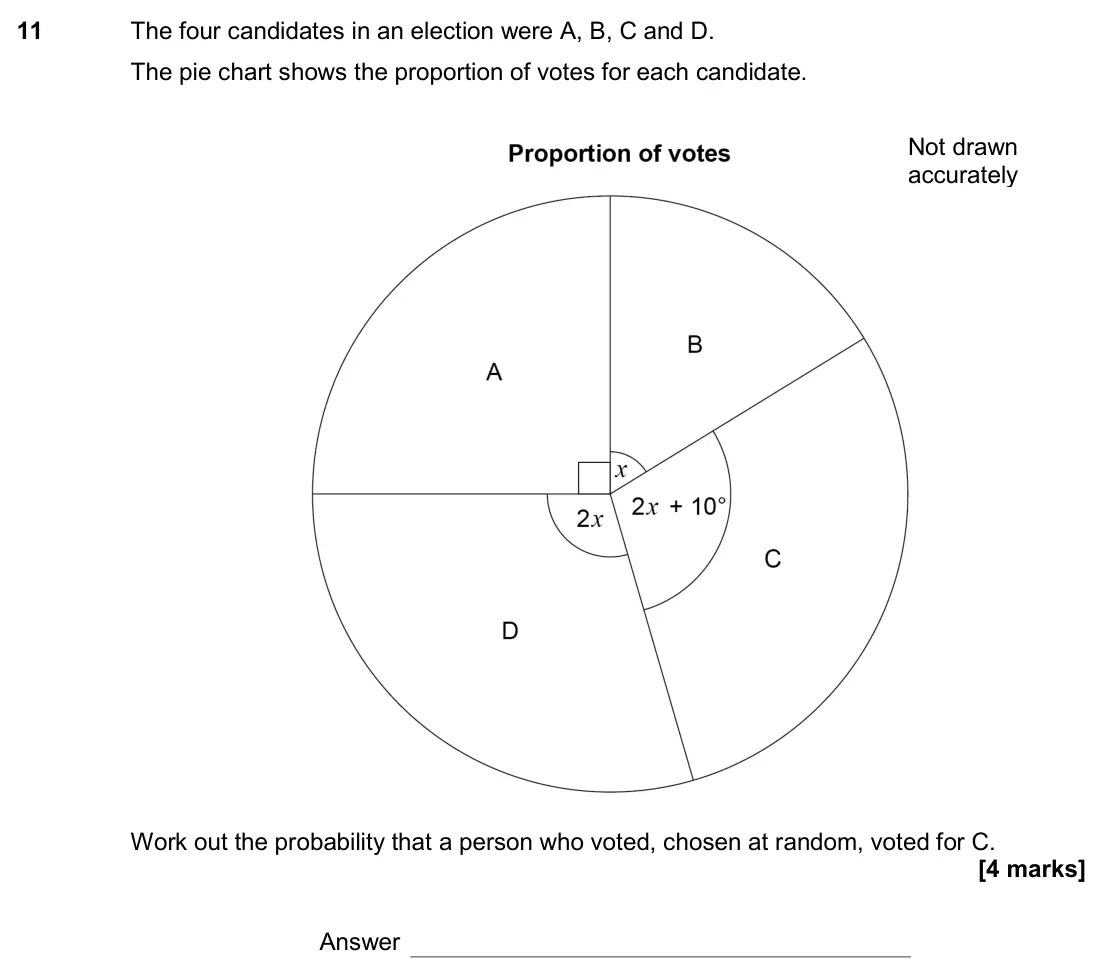
    November 2017 Paper 1H, question 11: The four candidates in an election were A, B, C and D. The pie chart shows the proportion of votes for each candidate. Work out the probability that a person wh
  15. Q10

    June 2017 · Paper 2H

    The whole paper ↗
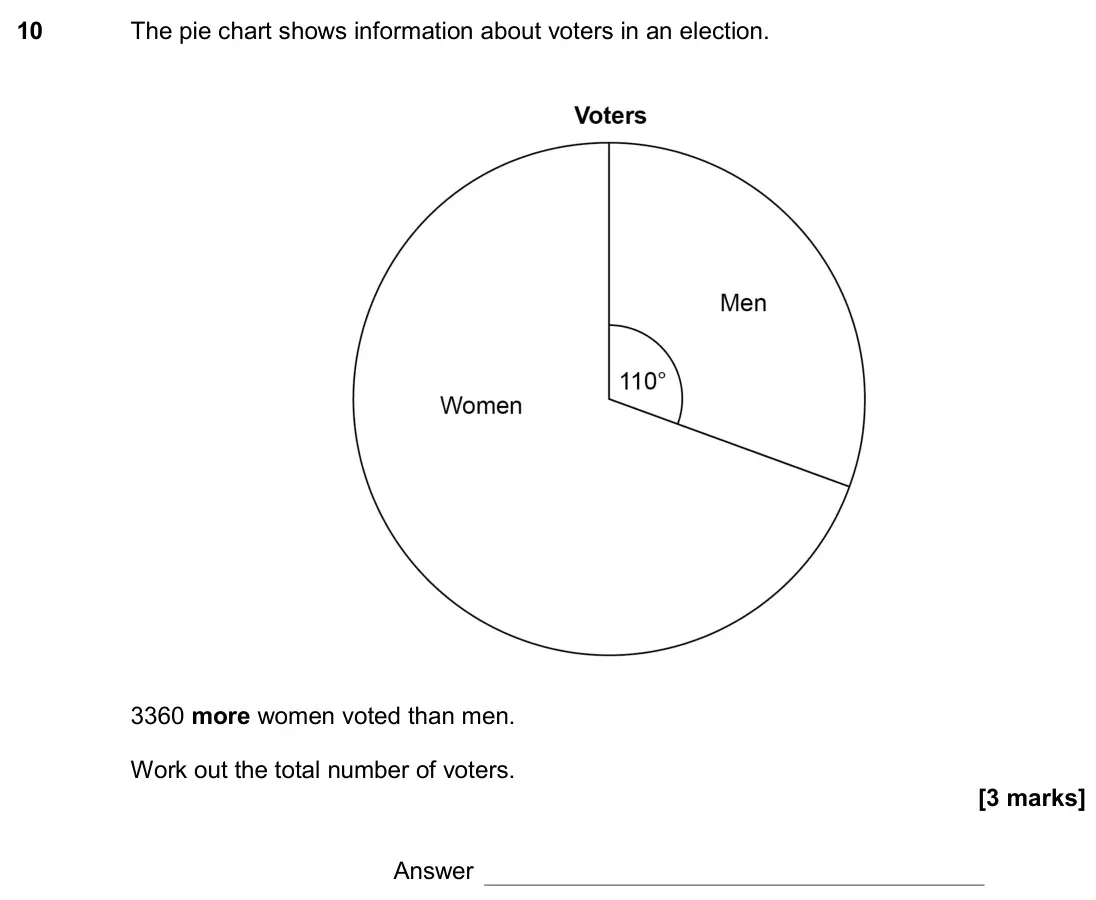
    June 2017 Paper 2H, question 10: The pie chart shows information about voters in an election. 3360 more women voted than men. Work out the total number of voters. Answer
  16. Q11

    Specimen · Paper 1H

    The whole paper ↗
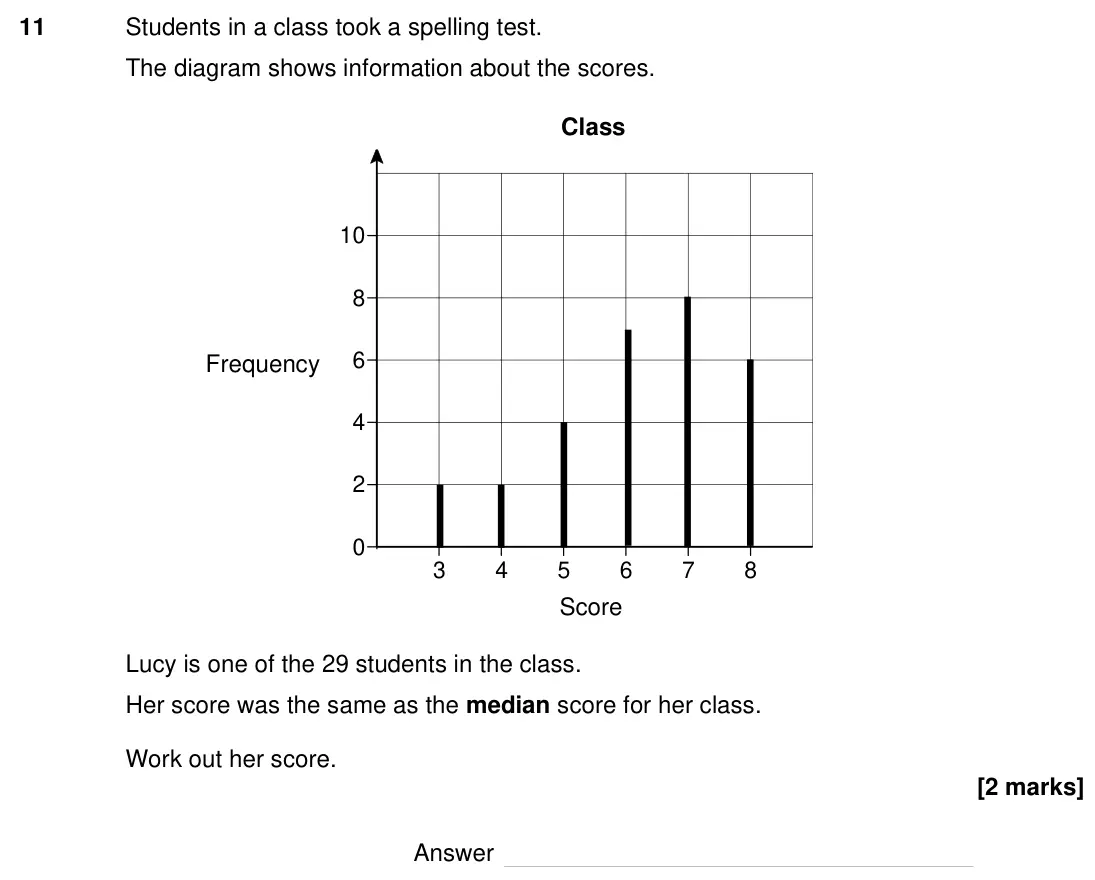
    Specimen Paper 1H, question 11: Students in a class took a spelling test. The diagram shows information about the scores. Lucy is one of the 29 students in the class. Her score was the same as
All 16 questions on Charts and tables, as a list
  1. June 2025, Paper 2H, Q3 (5 marks): Youssuf posted an advert on his social media channel. The table shows the number of views of the advert during its first 6 days. Day 1 2 3 4 5 6 Number of views
  2. June 2025, Paper 3H, Q5 (3 marks): The pie chart represents the results of matches played by a team. 30 matches were won. How many matches were lost? Answer
  3. November 2024, Paper 3H, Q2 (3 marks): The table shows information about the number of houses with solar panels in a town. Year 2017 2018 2019 2020 2021 2022 Number of houses 50 65 115 210 275 350 2
  4. June 2024, Paper 1H, Q6 (3 marks): The table shows the number of workers at a company in different years. Year 2015 2016 2017 2018 2019 2020 2021 2022 Number of workers 29 34 42 52 62 70 76 80 A
  5. June 2024, Paper 3H, Q8 (4 marks): Four people are taking part in a television talent show. Here are Amy’s marks from the 6 judges. 8 9 9 6 9 10 The pie chart represents the phone vote. Amy’s tot
  6. November 2023, Paper 2H, Q6 (2 marks): Round 1 of voting for Head Student is taking place in a school. 6 (a) To reach round 2, a student must receive at least 15 4 of the votes. What is the largest p
  7. June 2023, Paper 3H, Q9 (3 marks): The pie chart shows information about people at a fair during three days. There were 132 more people on Friday than on Thursday. Work out the number of people o
  8. November 2022, Paper 2H, Q6 (3 marks): The composite bar chart shows information about the percentage of drinks sold by a café in 2007 and 2019 6 (a) In 2007 the café sold a total of 24 000 drinks. H
  9. June 2022, Paper 2H, Q14 (4 marks): A survey was held in a football stadium. A sample of the crowd was asked about the importance of a family area. The pie chart represents the answers. 14 (a) The
  10. November 2020, Paper 2H, Q5 (3 marks): The time students spent watching TV was recorded. The table shows the average daily time per student each year from 2012 to 2019 Year 2012 2013 2014 2015 2016 2
  11. November 2019, Paper 3H, Q9 (3 marks): The pie chart shows information about people at a theme park. Not drawn accurately There were 450 more women than men. Work out the number of children. Answer
  12. June 2019, Paper 2H, Q9 (5 marks): In a sport, injury time is added time played at the end of a match. The table shows the injury time, t (minutes) played in 380 matches. Injury time, t (minutes)
  13. November 2018, Paper 3H, Q6 (4 marks): A music festival has taken place each year from 2011 The table shows the number of people who attended each year. Year 2011 2012 2013 2014 2015 2016 2017 2018 N
  14. November 2017, Paper 1H, Q11 (4 marks): The four candidates in an election were A, B, C and D. The pie chart shows the proportion of votes for each candidate. Work out the probability that a person wh
  15. June 2017, Paper 2H, Q10 (3 marks): The pie chart shows information about voters in an election. 3360 more women voted than men. Work out the total number of voters. Answer
  16. Specimen, Paper 1H, Q11 (2 marks): Students in a class took a spelling test. The diagram shows information about the scores. Lucy is one of the 29 students in the class. Her score was the same as

Questions, mark schemes and examiner’s reports are © AQA, from their published past papers. Plumi isn’t affiliated with any exam board. Want whole papers? Every AQA GCSE Maths paper.

Rather write your answers by hand on iPad? Plumi marks them against the same mark schemes.