 plumi
Data handling and analysis: AQA A‑Level Psychology questions
Every AQA A-Level Psychology exam question on 4.2.3.2 Data handling and analysis, 2020–2025, with its mark scheme and examiner’s report.
Find questions669
Calculations

Q15.1
The whole paper ↗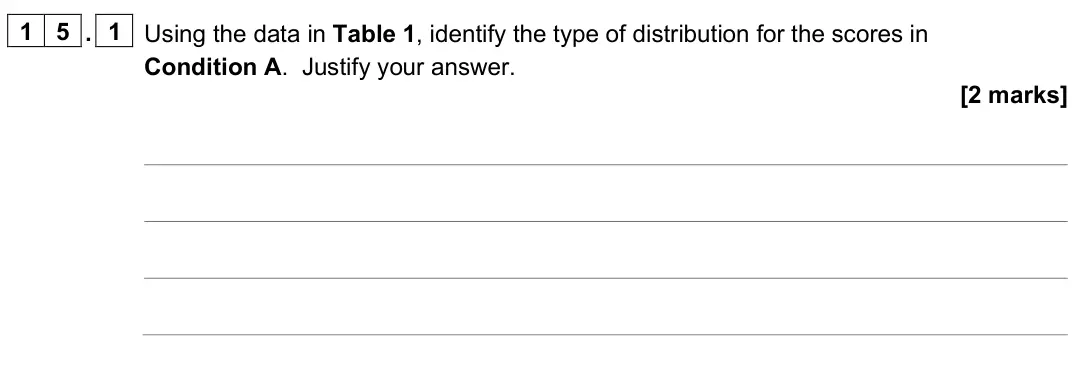
Q15.2
The whole paper ↗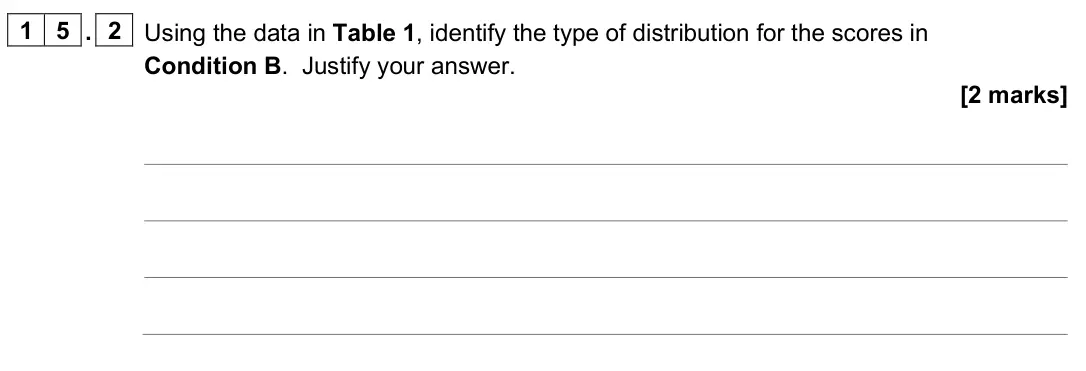
All 58 questions on Data handling and analysis, as a list
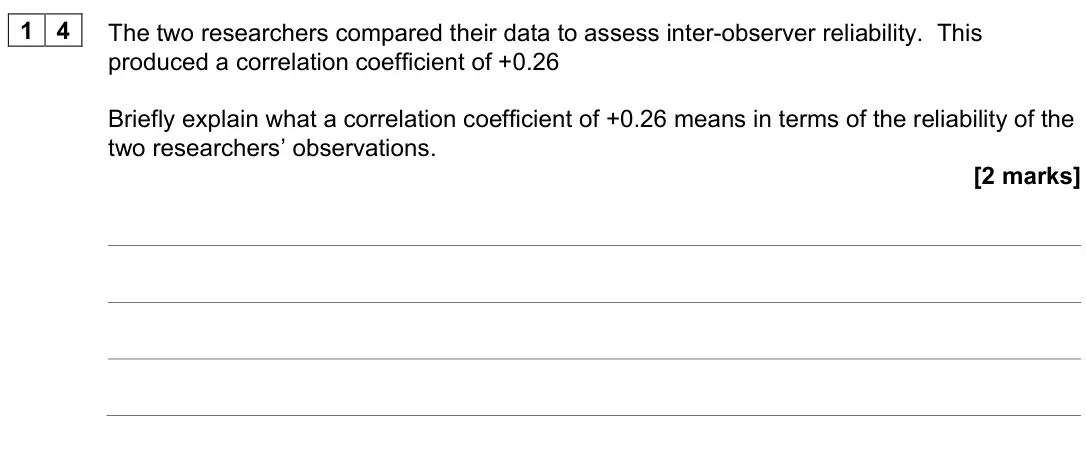
- June 2025, Paper 1, Q14 (2 marks): The two researchers compared their data to assess inter-observer reliability. This produced a correlation coefficient of +0.26 Briefly explain what a correlatio
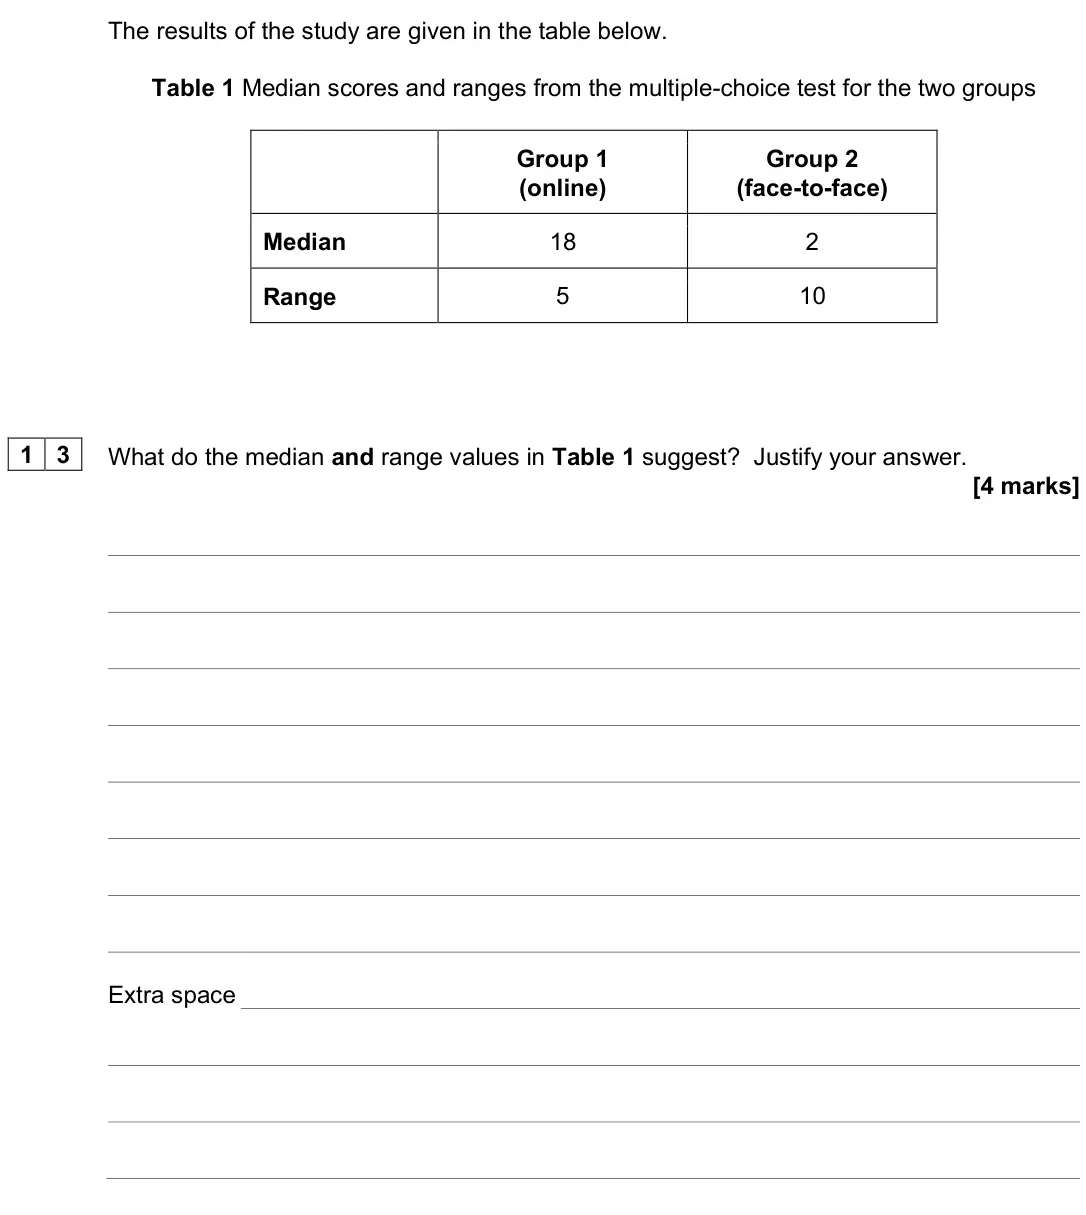
- June 2025, Paper 2, Q13 (4 marks): What do the median and range values in Table 1 suggest? Justify your answer. [4 marks]
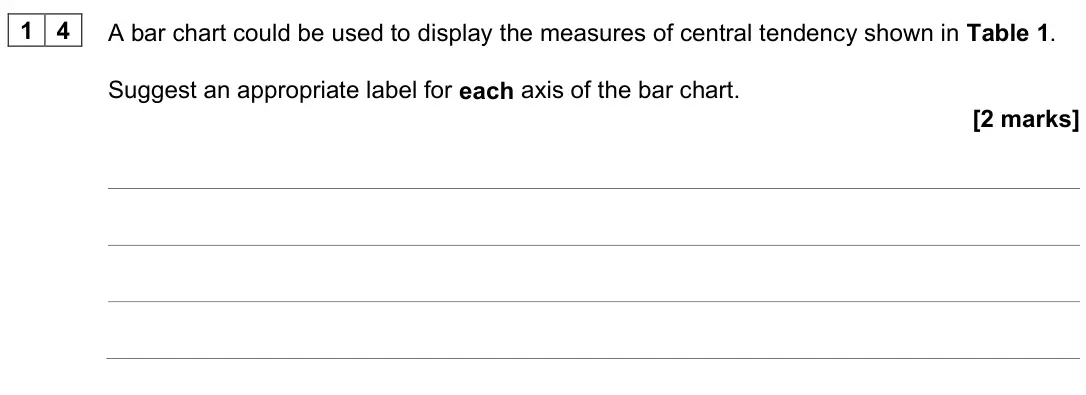
- June 2025, Paper 2, Q14 (2 marks): A bar chart could be used to display the measures of central tendency shown in Table 1. Suggest an appropriate label for each axis of the bar chart. [2 marks]
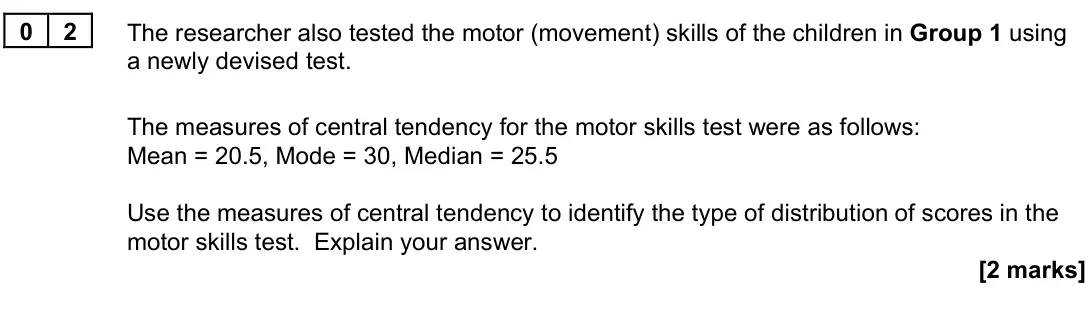
- June 2025, Paper 3, Q02 (2 marks): The researcher also tested the motor (movement) skills of the children in Group 1 using a newly devised test. The measures of central tendency for the motor ski
- June 2025, Paper 3, Q03 (2 marks): Explain how the researcher could modify the motor skills test so that it would be more likely to produce a set of scores that is normally distributed. [2 marks]
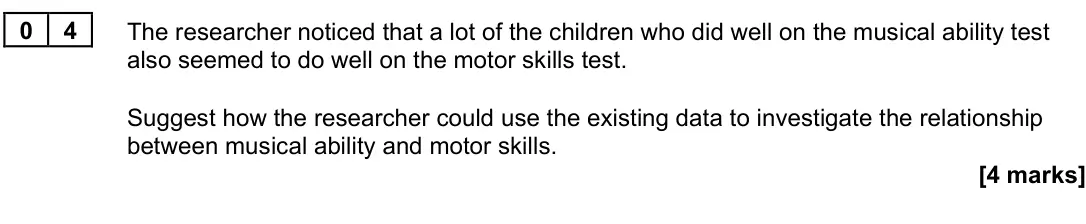
- June 2025, Paper 3, Q04 (4 marks): The researcher noticed that a lot of the children who did well on the musical ability test also seemed to do well on the motor skills test. Suggest how the rese
- June 2025, AS Paper 1, Q15.1 (2 marks): Using the data in Table 1, identify the type of distribution for the scores in Condition A. Justify your answer. [2 marks]
- June 2025, AS Paper 1, Q15.2 (2 marks): Using the data in Table 1, identify the type of distribution for the scores in Condition B. Justify your answer. [2 marks]
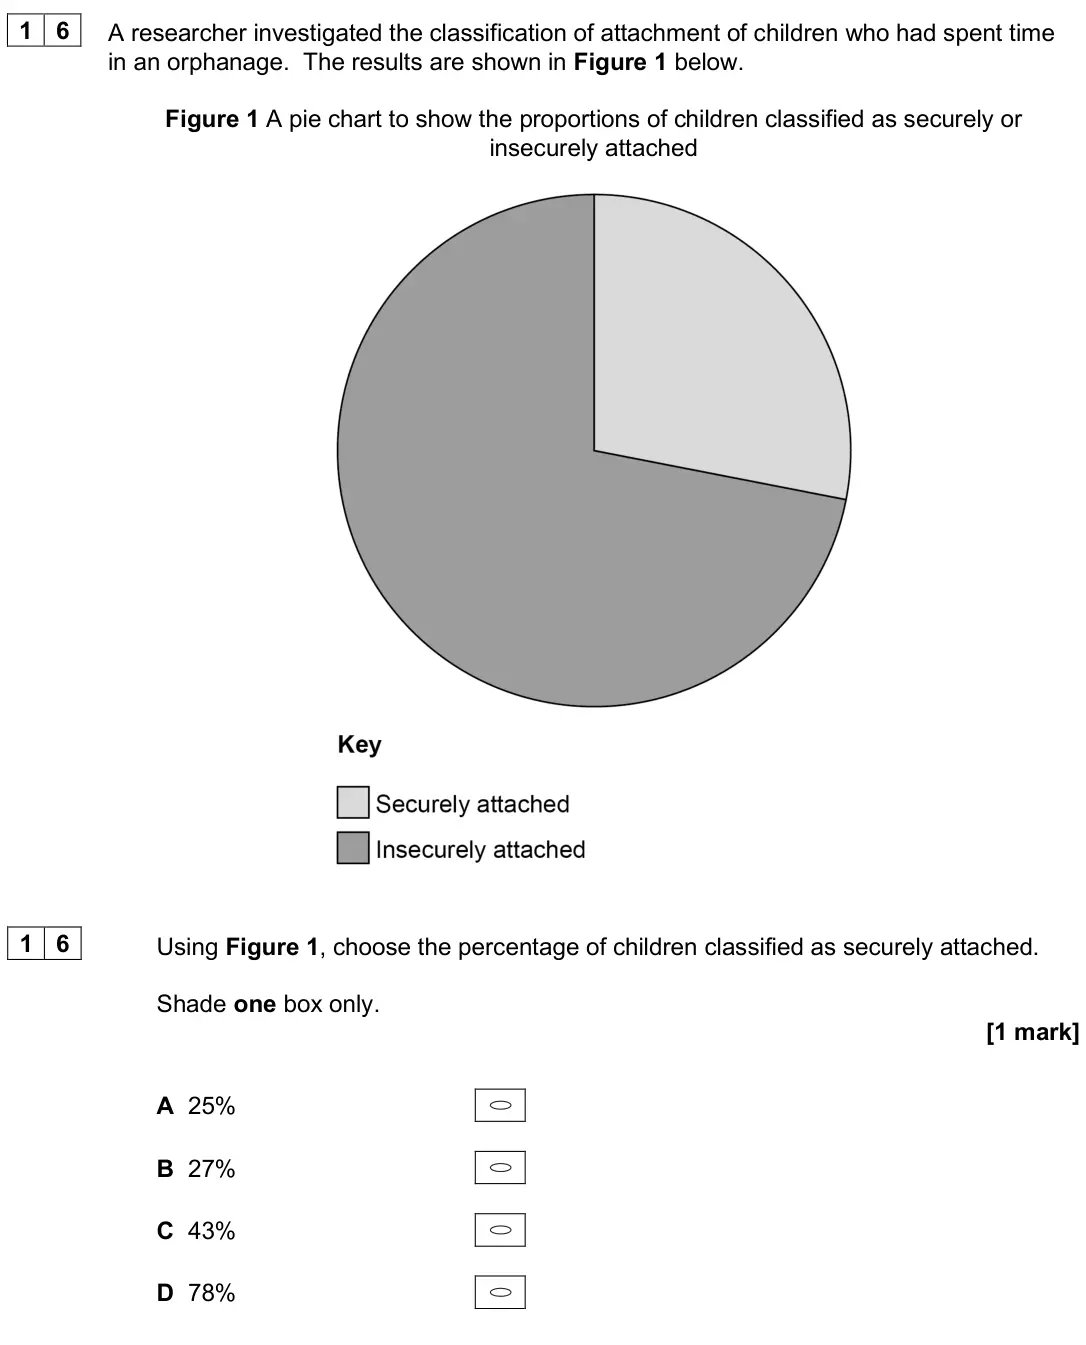
- June 2025, AS Paper 1, Q16 (1 mark): A researcher investigated the classification of attachment of children who had spent time in an orphanage. The results are shown in Figure 1 below. Figure 1 A p
- June 2025, AS Paper 1, Q17 (2 marks): With reference to attachment types, what conclusion can you reach from the data in Figure 1? Justify your answer. [2 marks]
- June 2024, Paper 2, Q11 (2 marks): Is the diary primary or secondary data? Justify your answer. [2 marks]
- June 2024, Paper 2, Q15 (2 marks): In the interview the researcher collected some qualitative data. Write one question that could be used in the researcher’s interview that would produce qualitat
- June 2024, Paper 2, Q16 (1 mark): Identify one limitation of qualitative data. [1 mark]
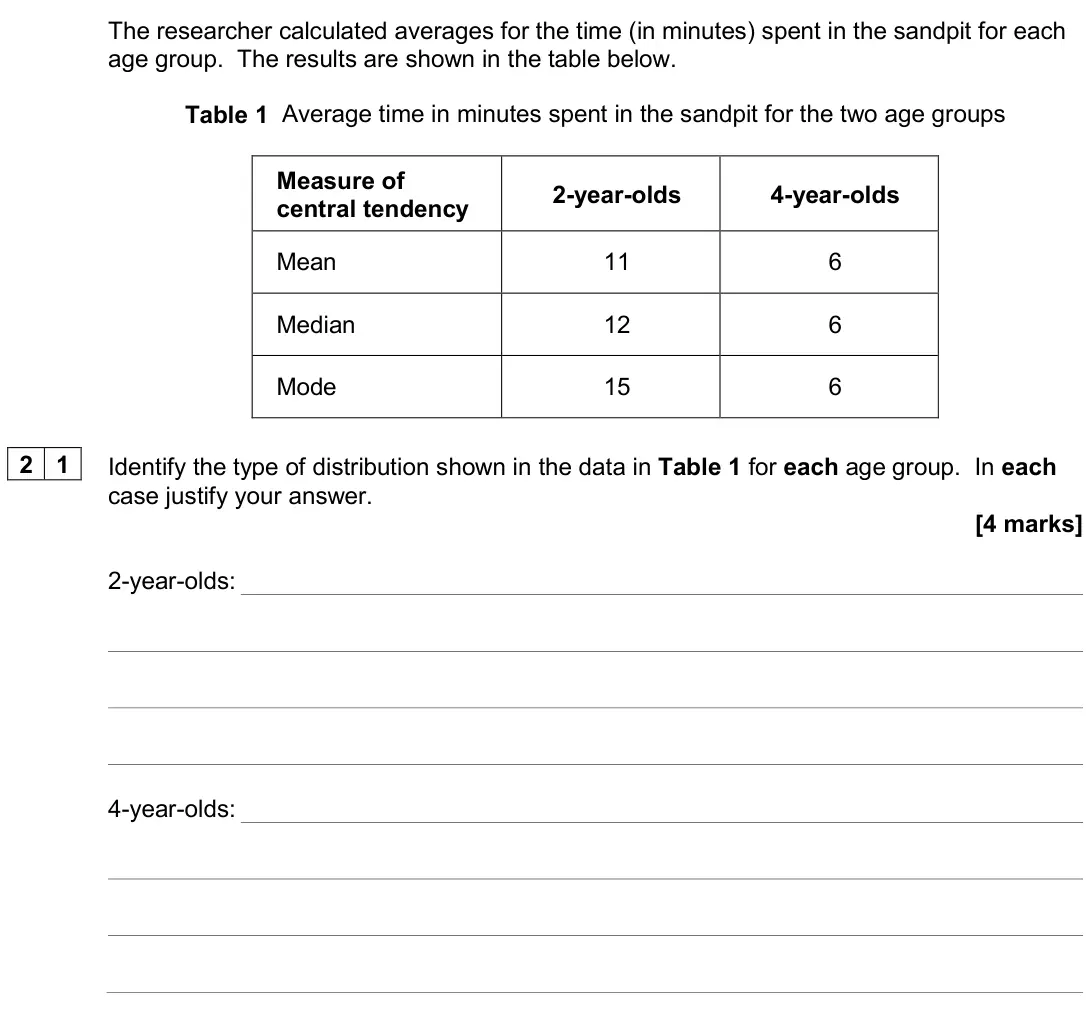
- June 2024, Paper 2, Q21 (4 marks): Identify the type of distribution shown in the data in Table 1 for each age group. In each case justify your answer. [4 marks] 2-year-olds: 4-year-olds:
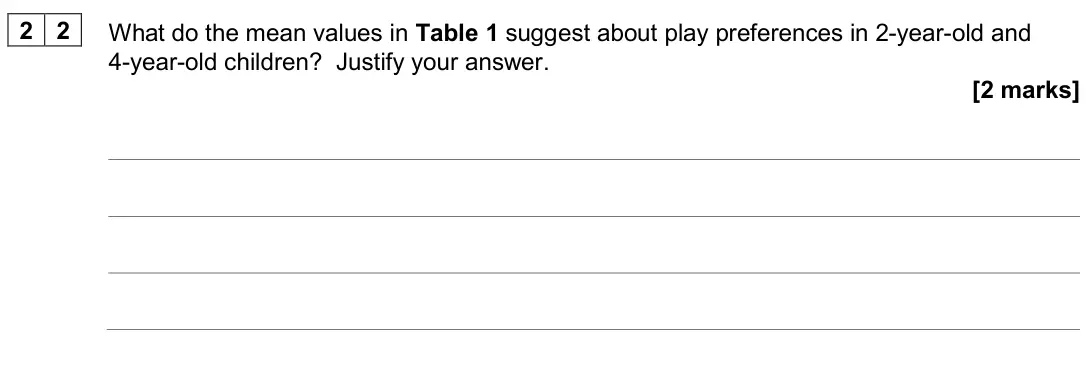
- June 2024, Paper 2, Q22 (2 marks): What do the mean values in Table 1 suggest about play preferences in 2-year-old and 4-year-old children? Justify your answer. [2 marks]
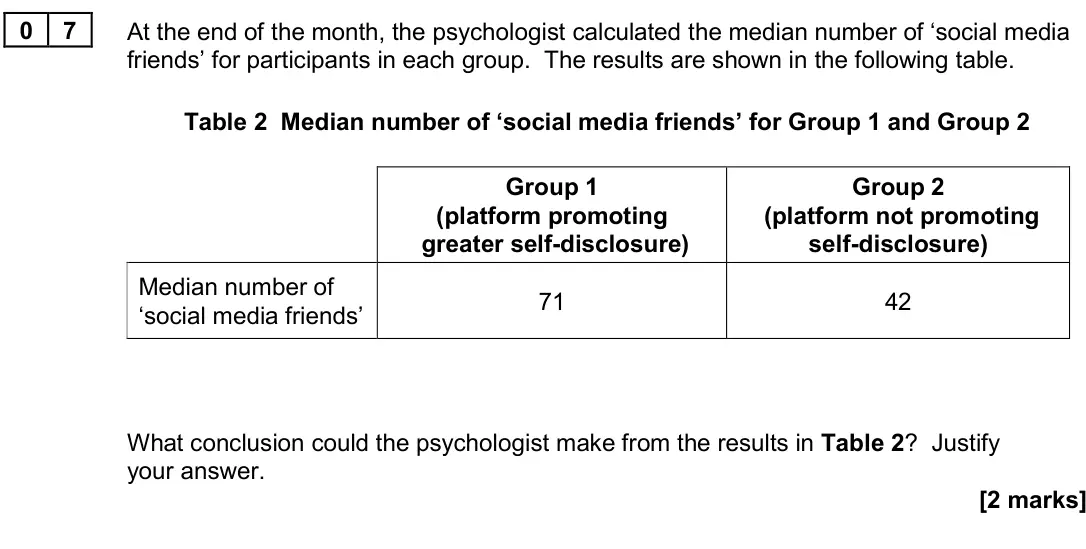
- June 2024, Paper 3, Q07 (2 marks): At the end of the month, the psychologist calculated the median number of ‘social media friends’ for participants in each group. The results are shown in the fo
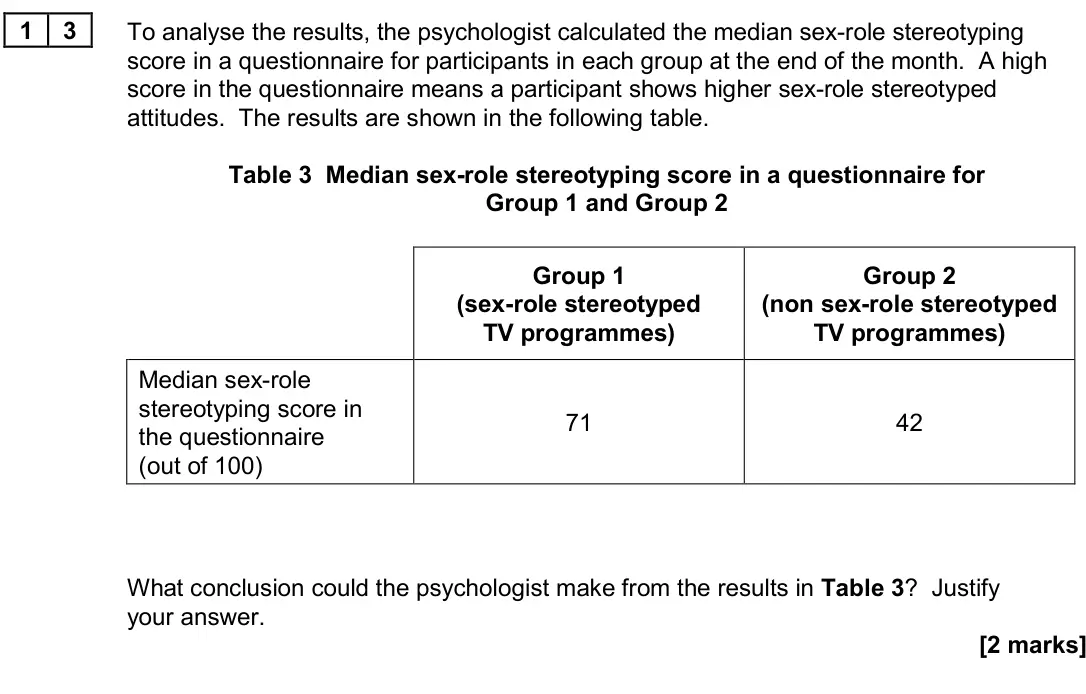
- June 2024, Paper 3, Q13 (2 marks): To analyse the results, the psychologist calculated the median sex-role stereotyping score in a questionnaire for participants in each group at the end of the m
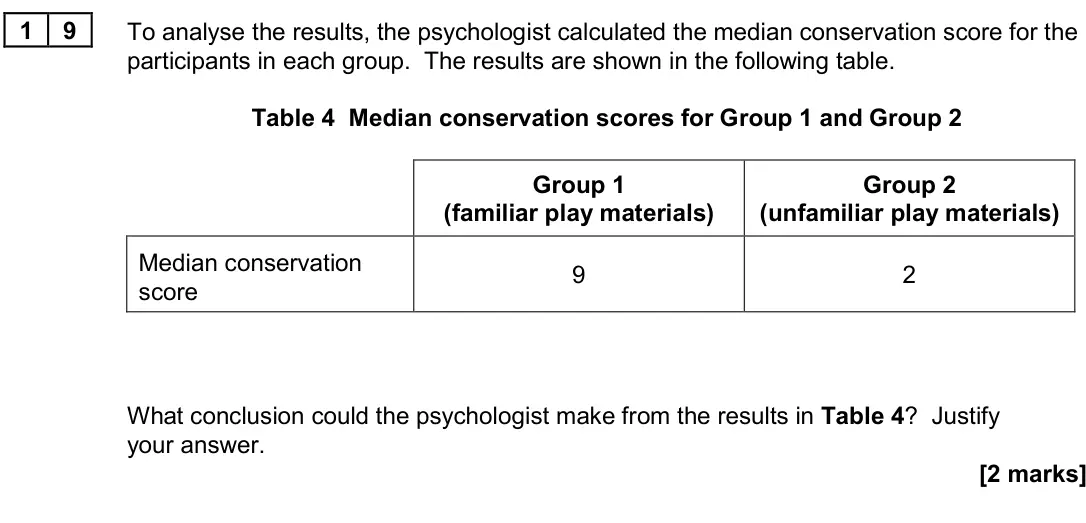
- June 2024, Paper 3, Q19 (2 marks): To analyse the results, the psychologist calculated the median conservation score for the participants in each group. The results are shown in the following tab
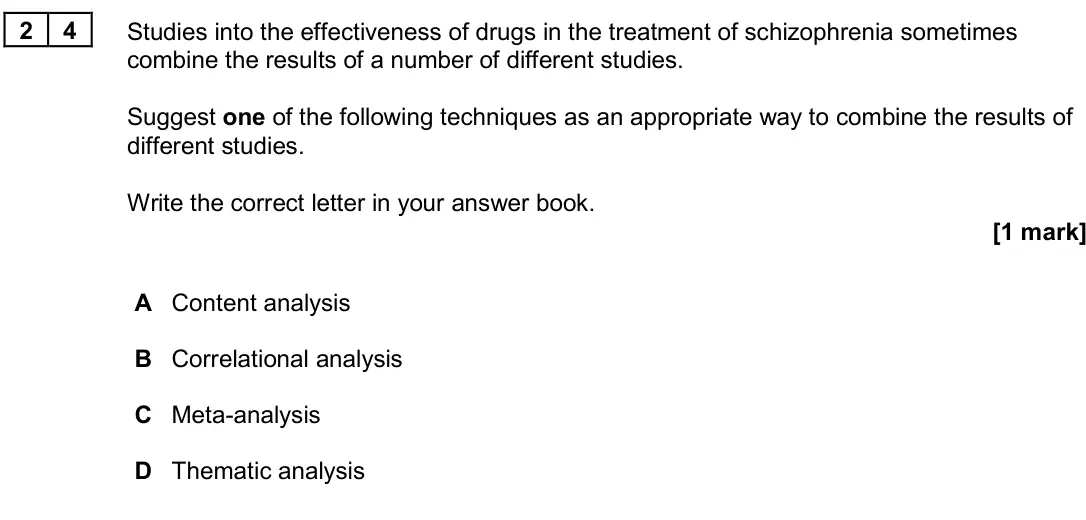
- June 2024, Paper 3, Q24 (1 mark): Studies into the effectiveness of drugs in the treatment of schizophrenia sometimes combine the results of a number of different studies. Suggest one of the fol
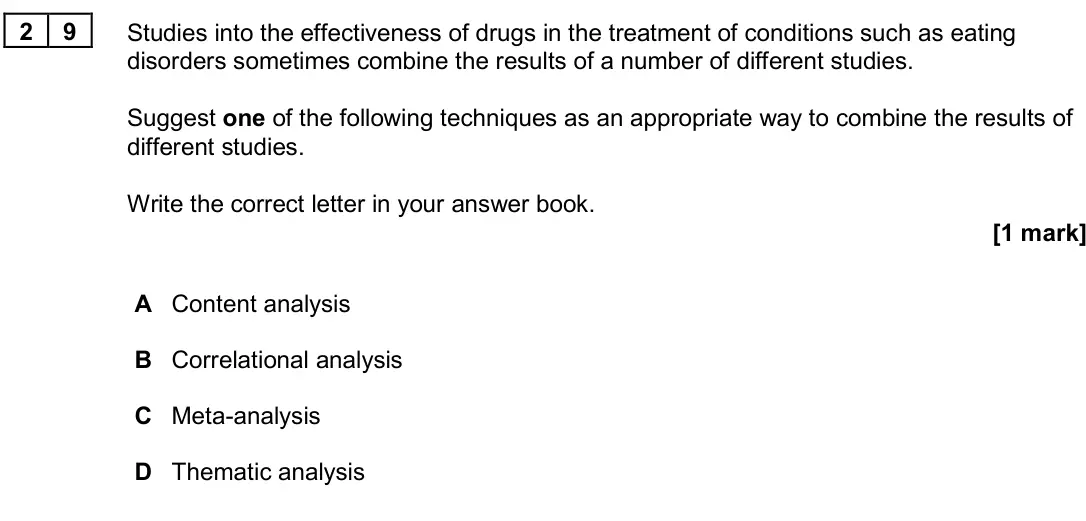
- June 2024, Paper 3, Q29 (1 mark): Studies into the effectiveness of drugs in the treatment of conditions such as eating disorders sometimes combine the results of a number of different studies.
- June 2024, Paper 3, Q34 (1 mark): Studies into the effectiveness of drug therapy in the treatment of stress sometimes combine the results of a number of different studies. Suggest one of the fol
- June 2024, AS Paper 1, Q09 (2 marks): A psychologist investigated the effect of anxiety on the accuracy of memory. She obtained a volunteer sample of 50 psychology students by putting up a poster on
- June 2024, AS Paper 2, Q08.1 (2 marks): Calculate the mean improvement score for Group 1 (CBT). Give your answer to two significant figures. [2 marks]
- June 2024, AS Paper 2, Q08.2 (2 marks): The psychologist found a mean improvement score of 1.5 for Group 2 (counselling). Give one conclusion about the effectiveness of the therapies using the mean sc
- June 2024, AS Paper 2, Q18.1 (2 marks): Calculate the median and mode obedience ratings for the Year 2 teachers. [2 marks]
- June 2024, AS Paper 2, Q18.2 (2 marks): Explain why the median may be a more appropriate average to use with the data for the Year 2 teachers in Question 18.1 than the mode. [2 marks]
- June 2023, Paper 2, Q14 (4 marks): Explain one strength and one limitation of collecting quantitative data in this study. [4 marks]
- June 2023, Paper 2, Q15 (4 marks): What do the median and range values presented in Table 1 suggest about the students’ stress ratings after each condition? Justify your answer. [4 marks]
- June 2023, Paper 2, Q16 (4 marks): Explain one limitation of using the range to represent the spread of stress ratings. [4 marks]
- June 2023, AS Paper 1, Q03.1 (2 marks): Explain why the median would be a more appropriate measure of central tendency than the mean for the data in Table 1. [2 marks]
- June 2022, Paper 1, Q16 (1 mark): The calculated value of r for the Pearson’s test was +0.42. Which one of the following scattergrams best represents a correlation coefficient of +0.42? Shade on
- June 2022, Paper 2, Q16 (2 marks): Explain one reason why collecting quantitative data could reduce the validity of this study. [2 marks]
- June 2022, Paper 3, Q16 (4 marks): Explain why the data in Table 1 does not enable the researchers to draw proper conclusions about the effectiveness of therapy for the two groups. What should th
- June 2022, Paper 3, Q17 (4 marks): In this study, the mood scores were assumed to be an interval level of measurement because the test of mood was standardised. Explain how you could convert the
- June 2022, Paper 3, Q22 (4 marks): Explain why the data in Table 2 does not enable the researchers to draw proper conclusions about the effectiveness of different types of support. What should th
- June 2022, Paper 3, Q23 (4 marks): In this study, the mood scores were assumed to be an interval level of measurement because the test of mood was standardised. Explain how you could convert the
- June 2022, Paper 3, Q28 (4 marks): Explain why the data in Table 3 does not enable the researchers to draw proper conclusions about the effectiveness of therapy for the two groups. What should th
- June 2022, Paper 3, Q29 (4 marks): In this study, the mood scores were assumed to be an interval level of measurement because the test of mood was standardised. Explain how you could convert the
- June 2022, AS Paper 1, Q06.1 (4 marks): Identify the type of distribution that the data suggest for each of Groups A and B. In each case justify your answer. [4 marks] Group A Group B
- June 2022, AS Paper 1, Q06.2 (2 marks): Explain what the difference in mode values of the two age groups shows. [2 marks]
- June 2022, AS Paper 1, Q07.3 (2 marks): Explain why the data in this study is primary data. [2 marks]
- June 2022, AS Paper 1, Q07.4 (2 marks): A week later, the same students were asked to describe the man’s facial features, estimate his age in years and weight in kilograms. Identify the qualitative da
- June 2022, AS Paper 2, Q10.3 (2 marks): What does the graph in Figure 1 suggest about the relationship between stress and illness? [2 marks]
- June 2022, AS Paper 2, Q10.5 (2 marks): Which two of the following best describe the stress level scores collected by the psychologist? Shade two boxes. [2 marks] A Meta-analysis B Primary C Qualitati
- June 2022, AS Paper 2, Q11.1 (2 marks): What do the mean values in Table 1 suggest about the effectiveness of the different strategies? Justify your answer. [2 marks]
- June 2022, AS Paper 2, Q11.2 (2 marks): What do the standard deviation values for the meditation condition suggest? Justify your answer. [2 marks]
- November 2021, Paper 1, Q03 (2 marks): A researcher wanted to investigate whether there was a relationship between locus of control and resistance to social influence. Before the investigation began,
- November 2021, Paper 2, Q13 (2 marks): Explain one strength of collecting quantitative data in this study. [2 marks]
- November 2020, Paper 1, Q07 (3 marks): Suggest a more appropriate measure of central tendency for this data set and explain why it would be more appropriate. [3 marks]
- November 2020, Paper 2, Q13 (1 mark): Which of the following correlation co-efficients best describes the data represented in Figure 2? Shade one circle only. [1 mark] A –0.80 B –0.25 C +0.25 D +0.8
- November 2020, Paper 2, Q14 (3 marks): Identify the type of graph shown in Figure 2 and explain why this is an appropriate graph to use for the data collected. [3 marks]
- November 2020, Paper 2, Q16 (2 marks): What is meant by the term meta-analysis? [2 marks]
- November 2020, Paper 2, Q20 (4 marks): Using the data in Table 2, explain how the distribution of scores in Group A differs from the distribution of scores in Group B. [4 marks]
- November 2020, Paper 2, Q21 (4 marks): What do the mean and standard deviation values in Table 2 suggest about the effect of the recreational screen time on test performance? Justify your answer. [4
- November 2020, AS Paper 1, Q05.1 (2 marks): What do the mean values in Table 1 suggest about coding in short-term memory? Justify your answer. [2 marks]
- November 2020, AS Paper 1, Q05.2 (2 marks): What do the standard deviation values in Table 1 suggest? Justify your answer. [2 marks]
- November 2020, AS Paper 2, Q15 (4 marks): Summarise the findings of this study using the data in Table 2. [4 marks]
- November 2020, AS Paper 2, Q17 (4 marks): Compare the results given in Table 2 with those seen in Table 3. What conclusion could now be made from these two sets of data? Explain your answer. [4 marks]
Questions, mark schemes and examiner’s reports are © AQA, from their published past papers. Plumi isn’t affiliated with any exam board. Want whole papers? Full past papers.
Rather write your answers by hand on iPad? Plumi marks them against the same mark schemes.