 plumi
Determinants of long-run aggregate supply: AQA A‑Level Economics questions
Every AQA A-Level Economics exam question on 4.2.2.6 Determinants of long-run aggregate supply, 2020–2025, with its mark scheme and examiner’s report.
Find questions686
Calculations






All 10 questions on Determinants of long-run aggregate supply, as a list
- June 2025, AS Paper 2, Q23 (4 marks): Use Extract A to identify two significant points of comparison between the natural change in the population and net migration into the UK over the period shown.
- June 2025, AS Paper 2, Q24 (4 marks): Use the information in Extract B (lines 8–12) to complete the pie chart to show the forecast age structure of the UK population in 2039. [4 marks] Context 1 Tot
- June 2025, AS Paper 2, Q31 (10 marks): Extract E (lines 12–13) states: ‘To increase revenue, the main rate of corporation tax, the tax payable on firms’ profits, was increased to 25%.’ Explain why an
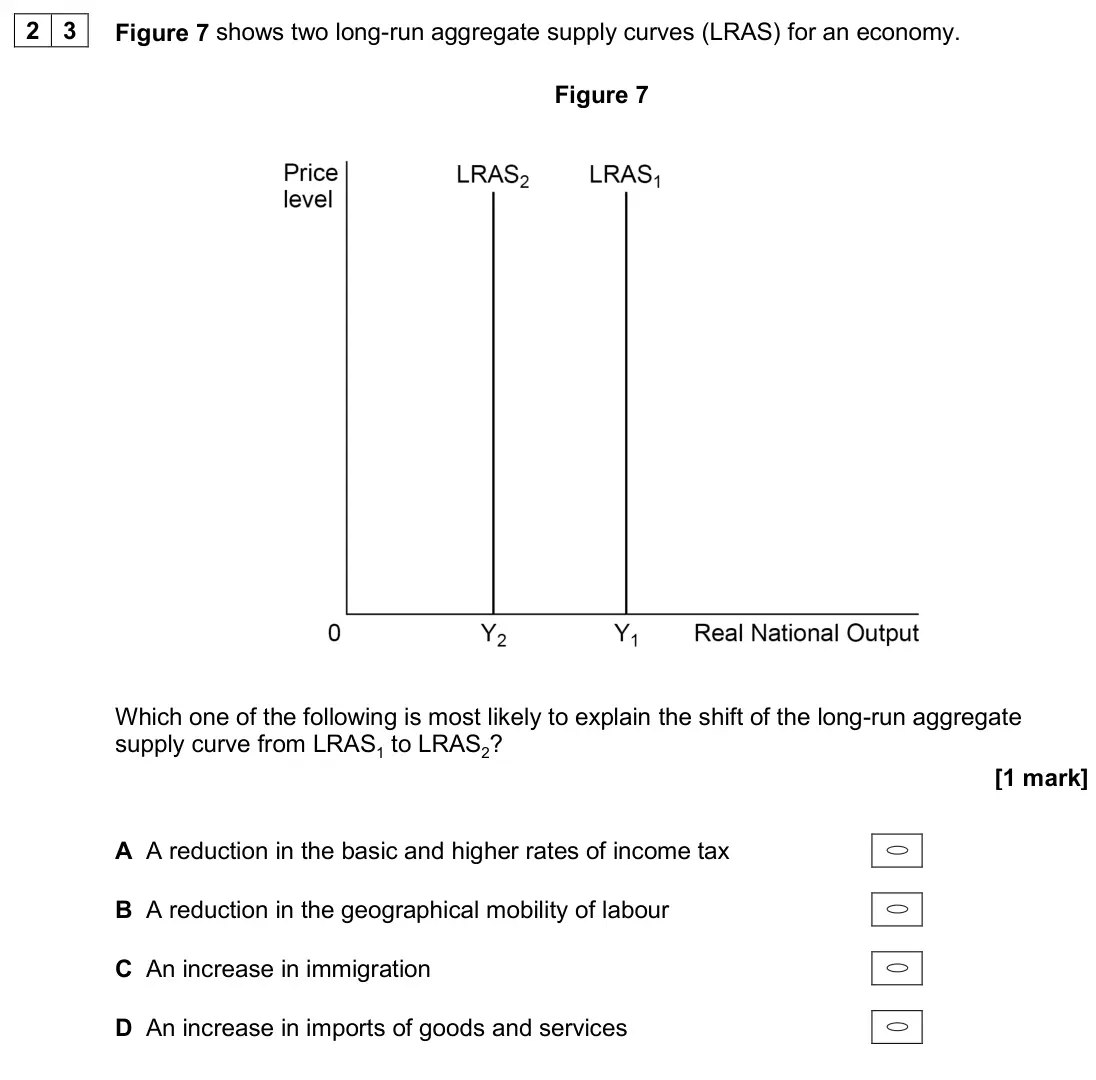
- June 2024, Paper 3, Q23 (1 mark): Figure 7 shows two long-run aggregate supply curves (LRAS) for an economy. Figure 7 Which one of the following is most likely to explain the shift of the long-r
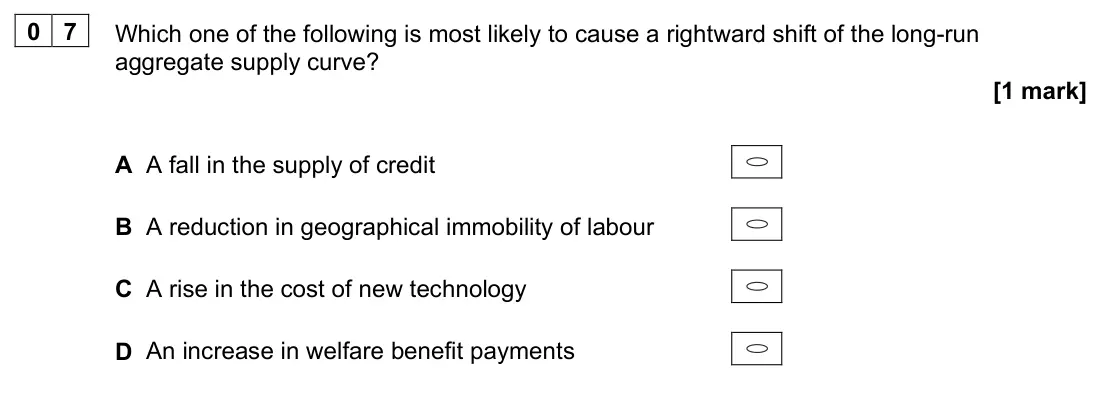
- June 2024, AS Paper 2, Q07 (1 mark): Which one of the following is most likely to cause a rightward shift of the long-run aggregate supply curve? [1 mark] A A fall in the supply of credit B A reduc
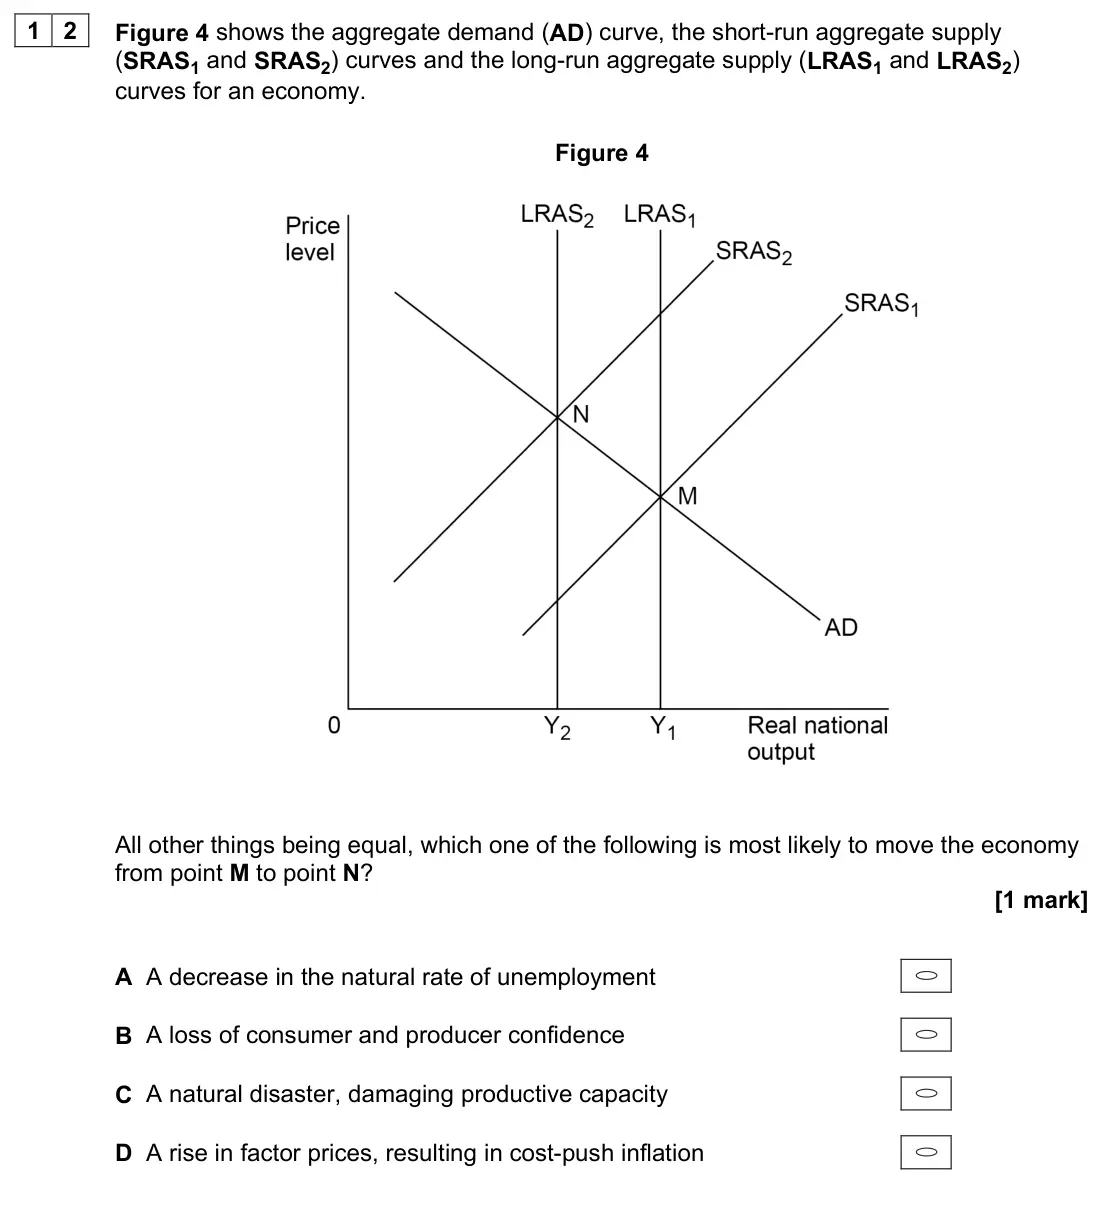
- June 2022, Paper 3, Q12 (1 mark): Figure 4 shows the aggregate demand (AD) curve, the short-run aggregate supply (SRAS1 and SRAS2) curves and the long-run aggregate supply (LRAS1 and LRAS2) curv
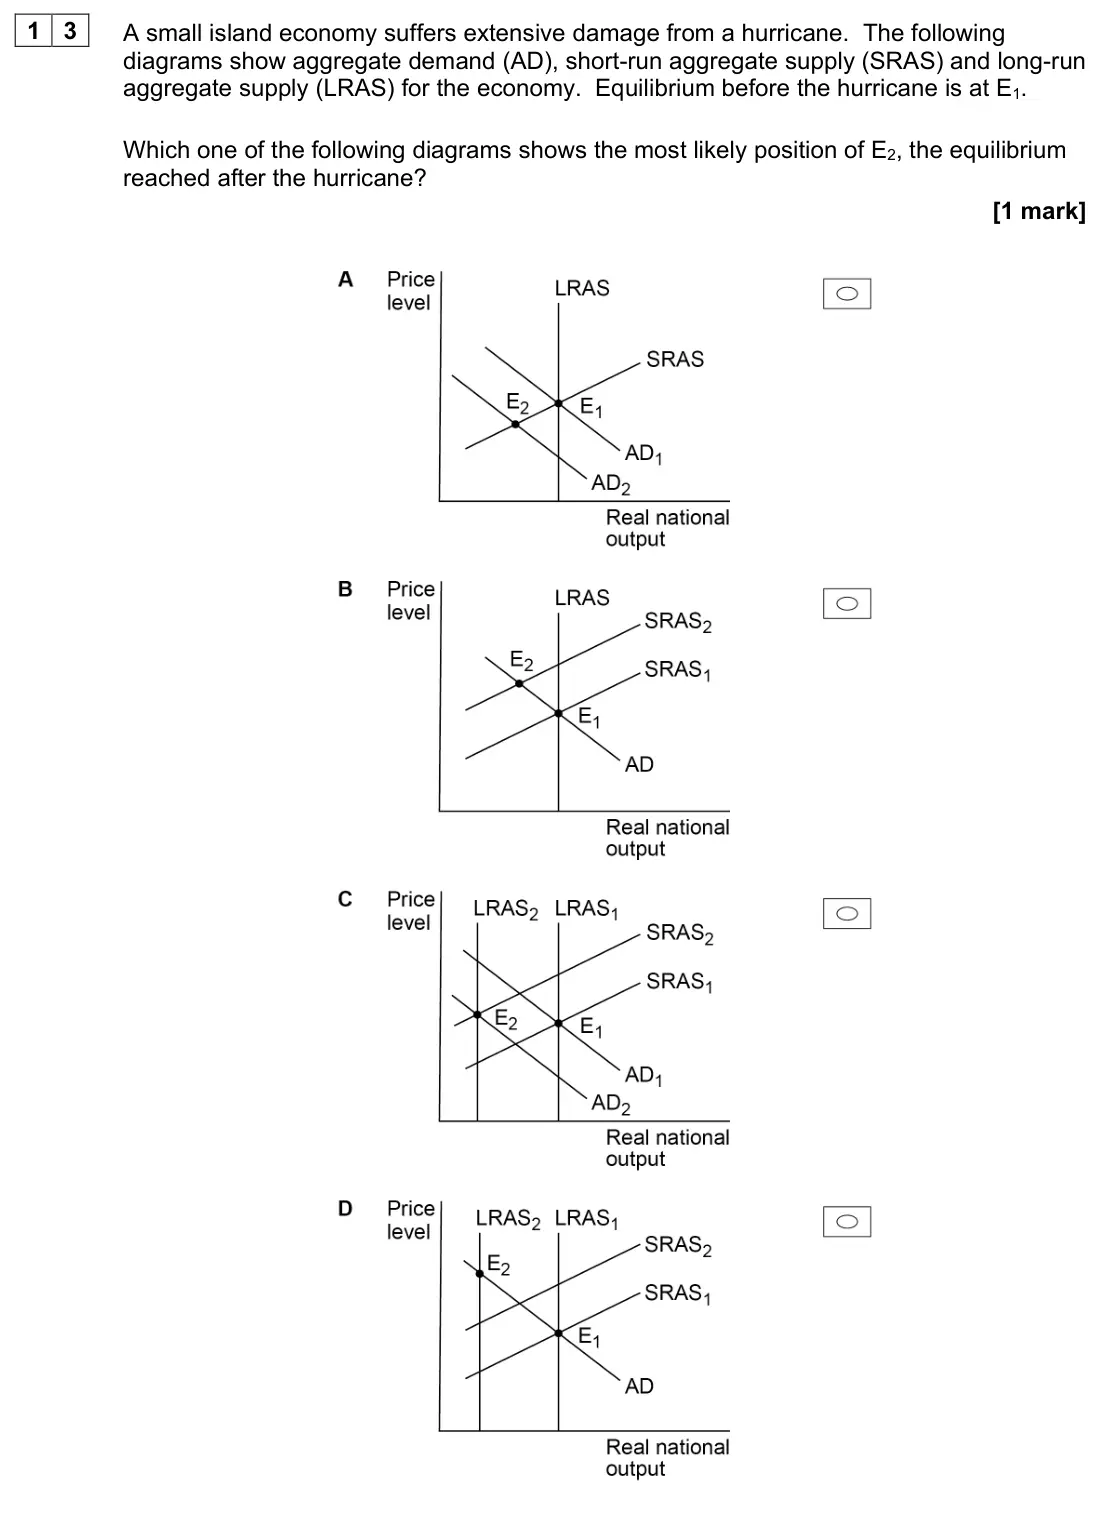
- June 2022, AS Paper 2, Q13 (1 mark): A small island economy suffers extensive damage from a hurricane. The following diagrams show aggregate demand (AD), short-run aggregate supply (SRAS) and long-
- June 2022, AS Paper 2, Q24 (4 marks): Extract C (lines 16–17) states: ‘An increase in the funds available for education and training should help to improve factor mobility’. Draw an AD/AS diagram to
- November 2021, Paper 2, Q07 (9 marks): Extract E (line 14) states: ‘Investment in R&D has been an important driver of economic growth and industrial progress.’ With the help of a diagram, explain how
- November 2020, Paper 2, Q03 (9 marks): Extract C (line 19) states: ‘Improving workers’ productivity is the key to increasing real GDP’. With the help of a diagram, explain how improving productivity
Questions, mark schemes and examiner’s reports are © AQA, from their published past papers. Plumi isn’t affiliated with any exam board. Want whole papers? Full past papers.
Rather write your answers by hand on iPad? Plumi marks them against the same mark schemes.