 plumi
Aggregate demand and aggregate supply analysis: AQA A‑Level Economics questions
Every AQA A-Level Economics exam question on 4.2.2.2 Aggregate demand and aggregate supply analysis, 2020–2025, with its mark scheme and examiner’s report.
Find questions686
Calculations


All 12 questions on Aggregate demand and aggregate supply analysis, as a list
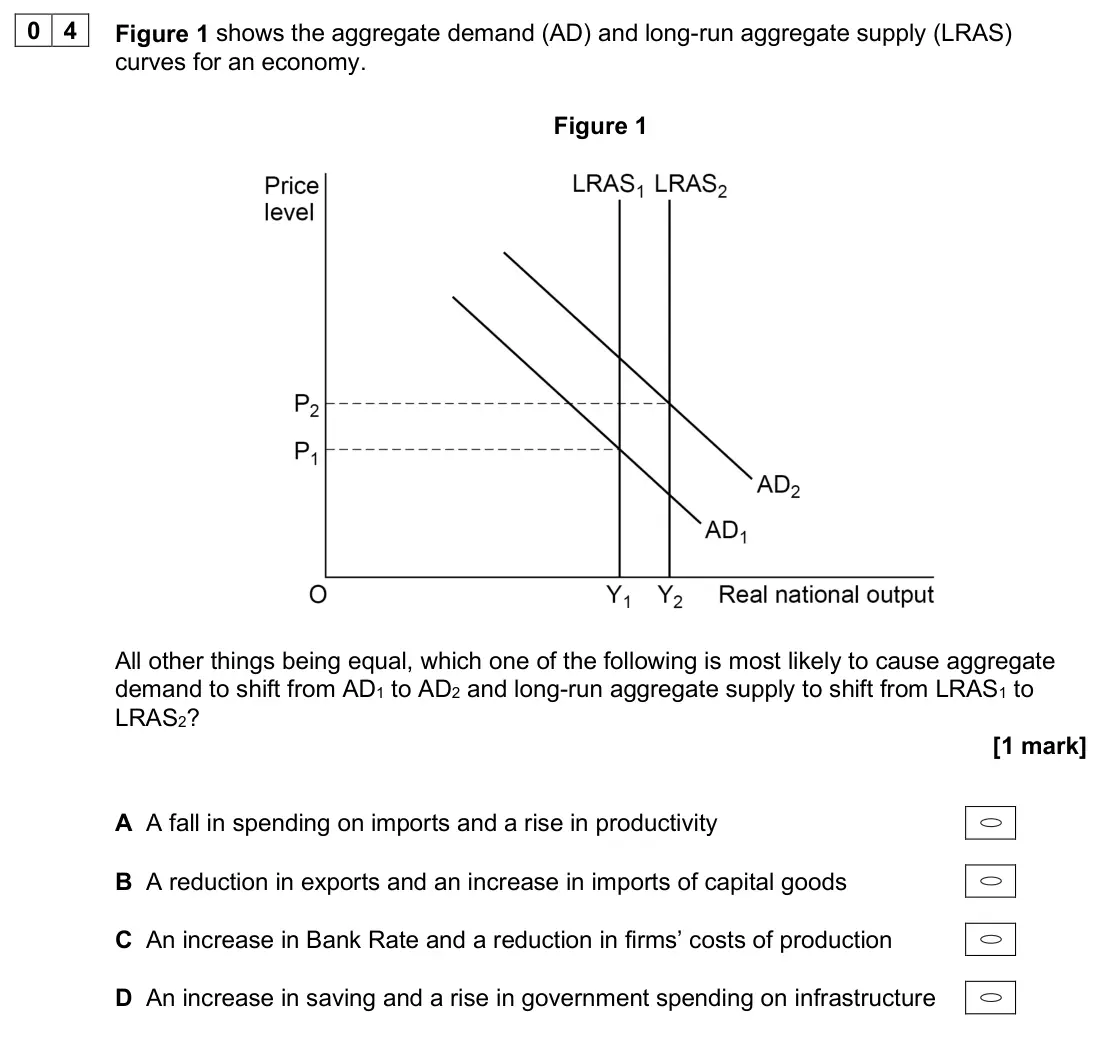
- June 2025, AS Paper 2, Q04 (1 mark): Figure 1 shows the aggregate demand (AD) and long-run aggregate supply (LRAS) curves for an economy. Figure 1 All other things being equal, which one of the fol
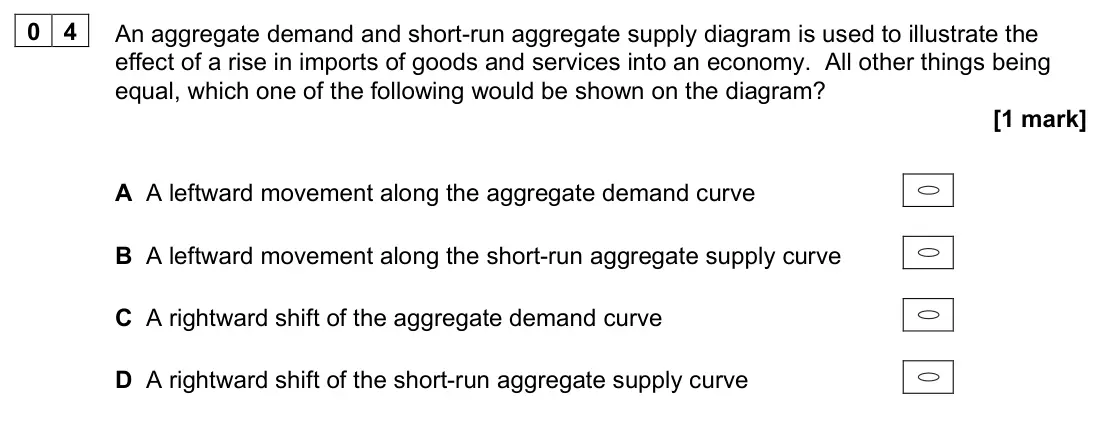
- June 2024, AS Paper 2, Q04 (1 mark): An aggregate demand and short-run aggregate supply diagram is used to illustrate the effect of a rise in imports of goods and services into an economy. All othe
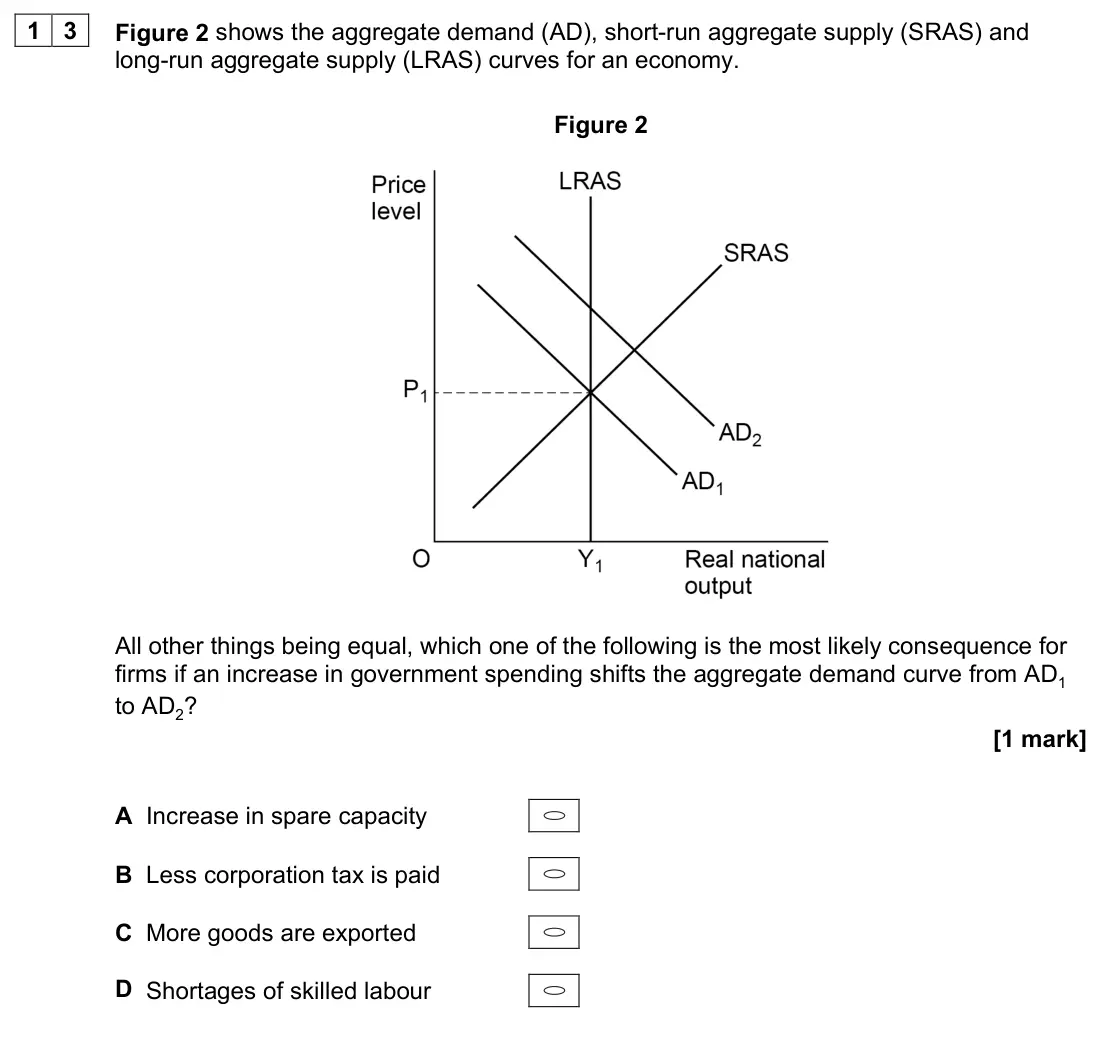
- June 2024, AS Paper 2, Q13 (1 mark): Figure 2 shows the aggregate demand (AD), short-run aggregate supply (SRAS) and long-run aggregate supply (LRAS) curves for an economy. Figure 2 All other thing
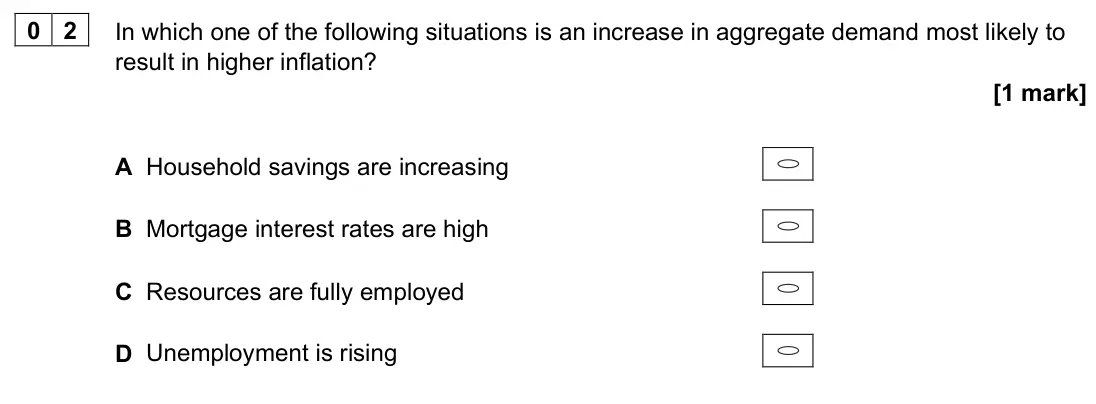
- June 2023, AS Paper 2, Q02 (1 mark): In which one of the following situations is an increase in aggregate demand most likely to result in higher inflation? [1 mark] A Household savings are increasi
- June 2023, AS Paper 2, Q30 (4 marks): Extract E (lines 4–6) states: ‘Recent favourable trade balances, such as the £8.2 billion surplus achieved in the 12 months to October 2020, have largely been o
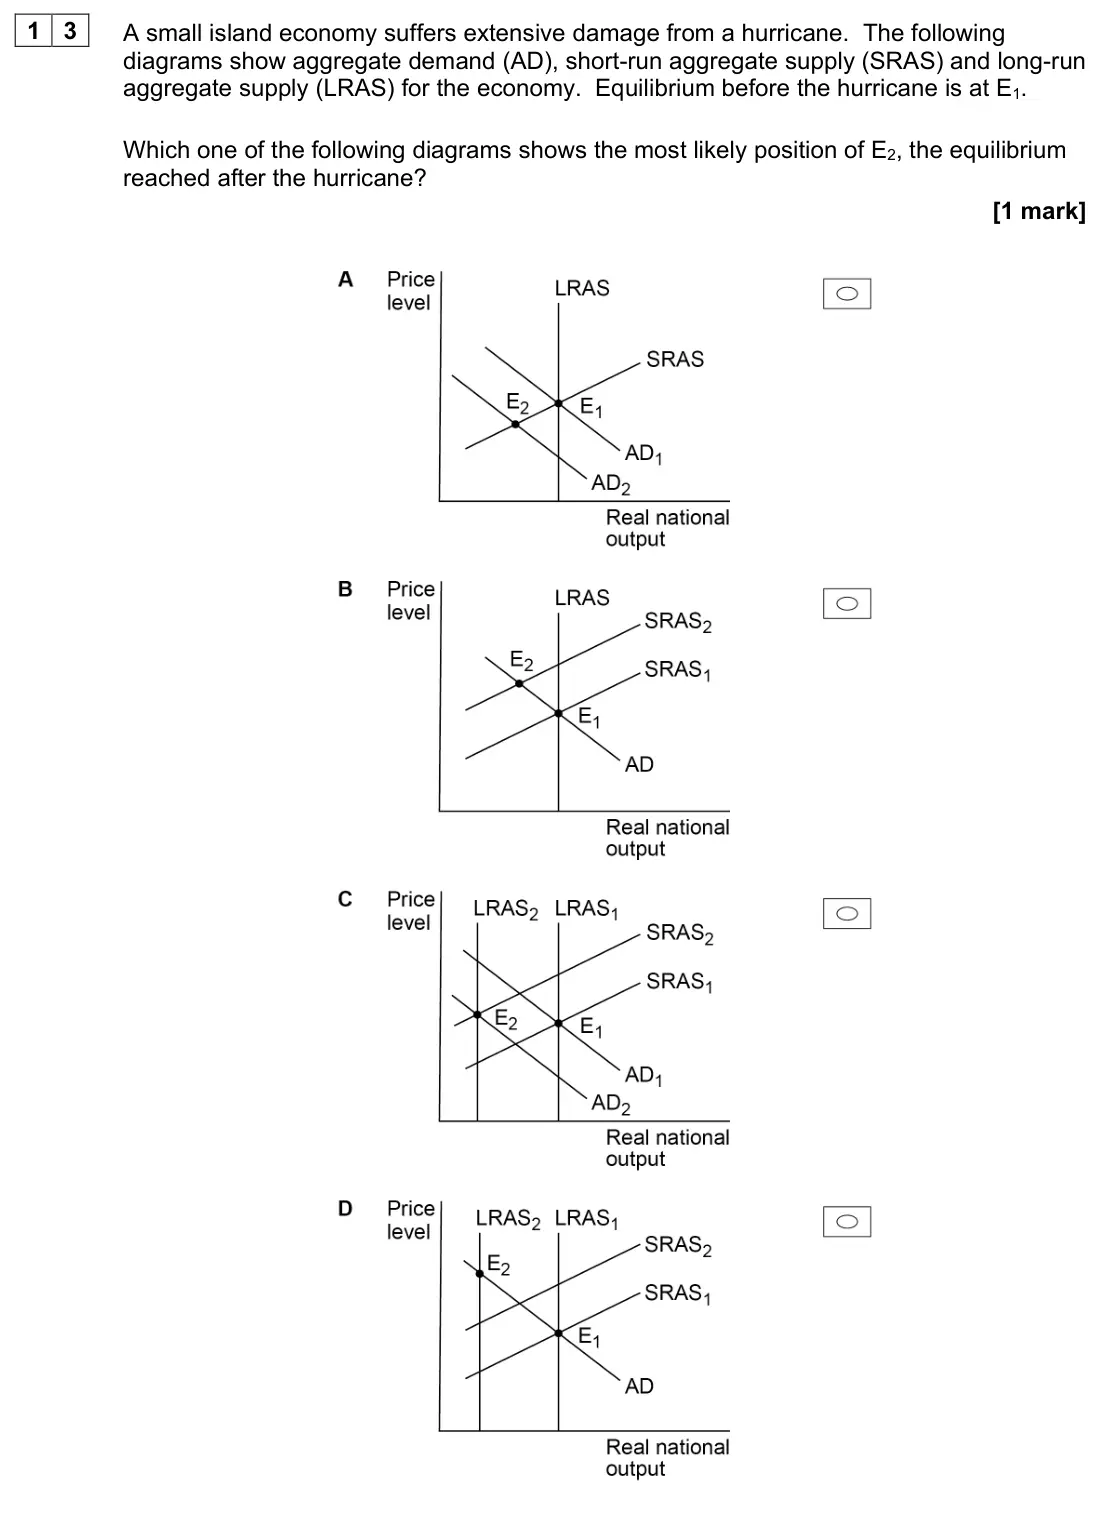
- June 2022, AS Paper 2, Q13 (1 mark): A small island economy suffers extensive damage from a hurricane. The following diagrams show aggregate demand (AD), short-run aggregate supply (SRAS) and long-
- June 2022, AS Paper 2, Q30 (4 marks): Extract E (line 15) states: ‘Government spending acts as an injection into the circular flow of income’. Draw an AD/AS diagram to show the effect of an increase
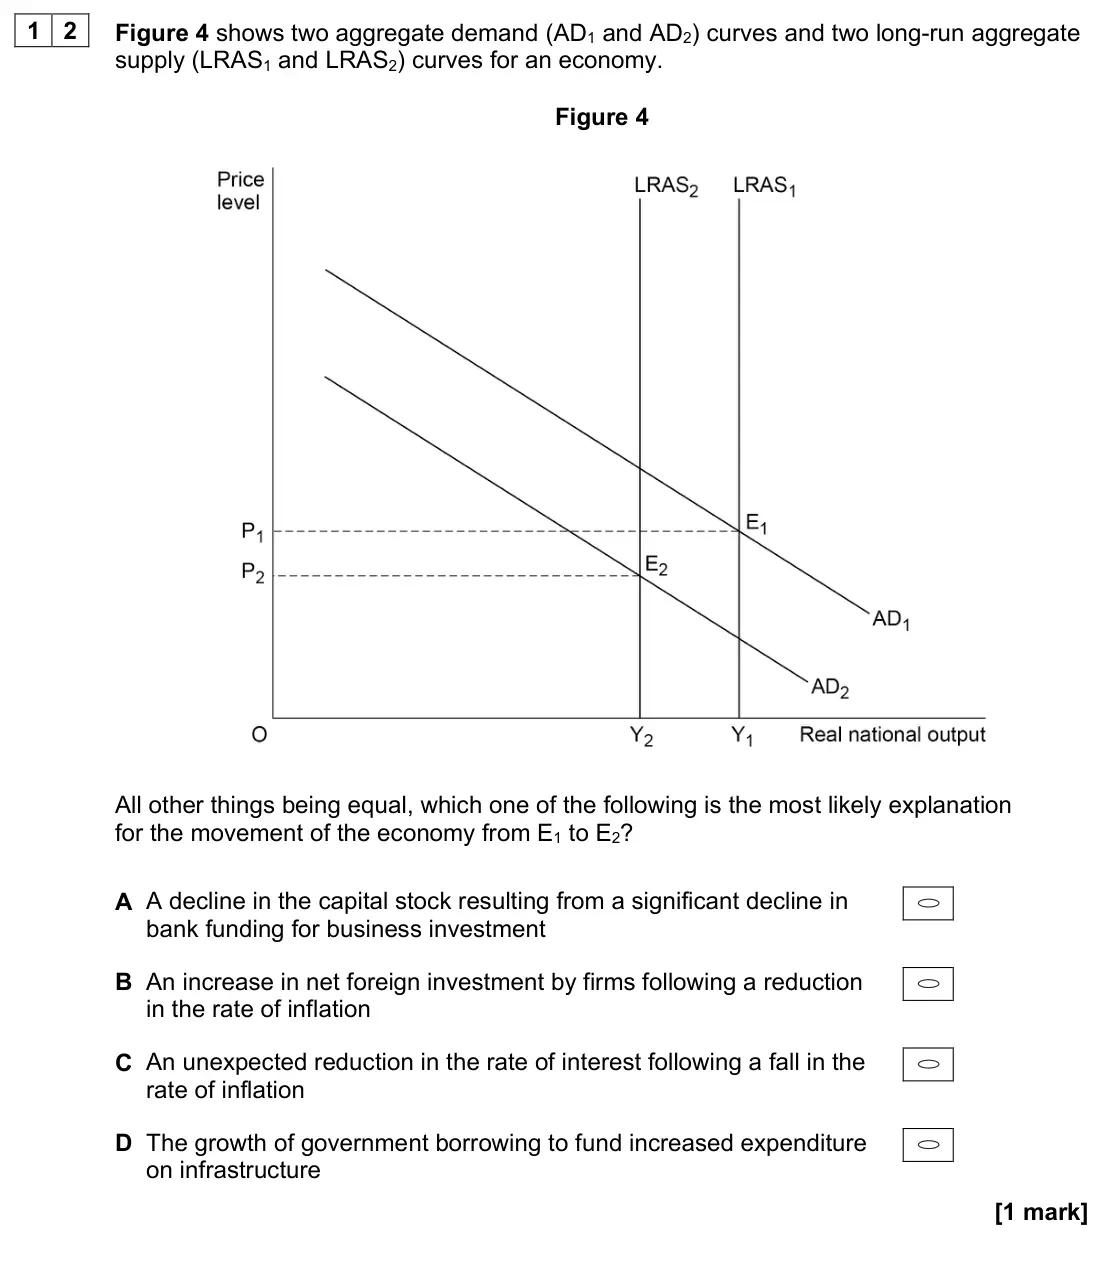
- November 2021, Paper 3, Q12 (1 mark): Figure 4 shows two aggregate demand (AD1 and AD2) curves and two long-run aggregate supply (LRAS1 and LRAS2) curves for an economy. Figure 4 All other things be
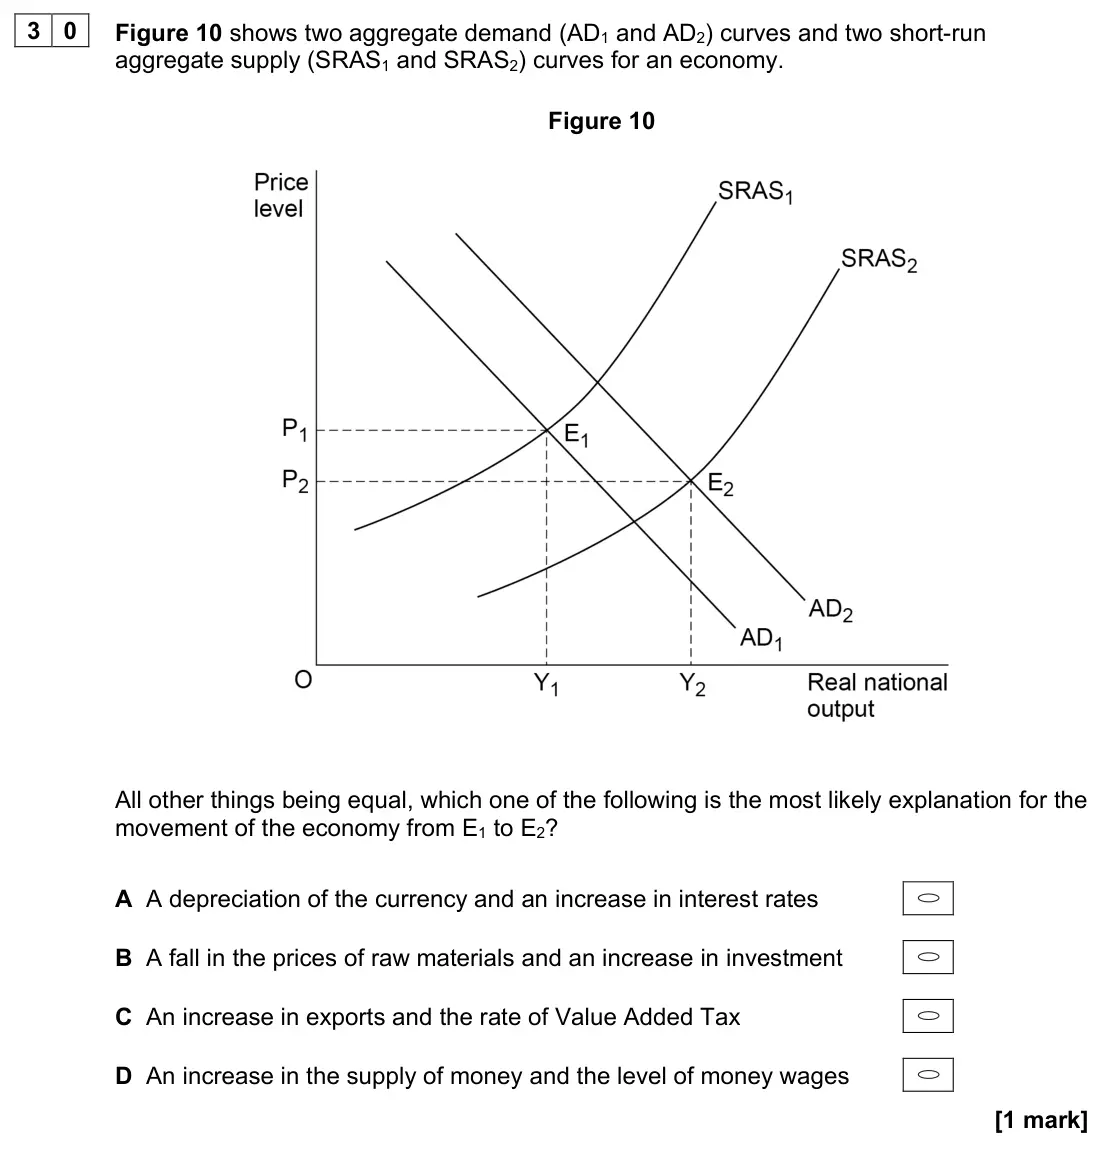
- November 2021, Paper 3, Q30 (1 mark): Figure 10 shows two aggregate demand (AD1 and AD2) curves and two short-run aggregate supply (SRAS1 and SRAS2) curves for an economy. Figure 10 All other things
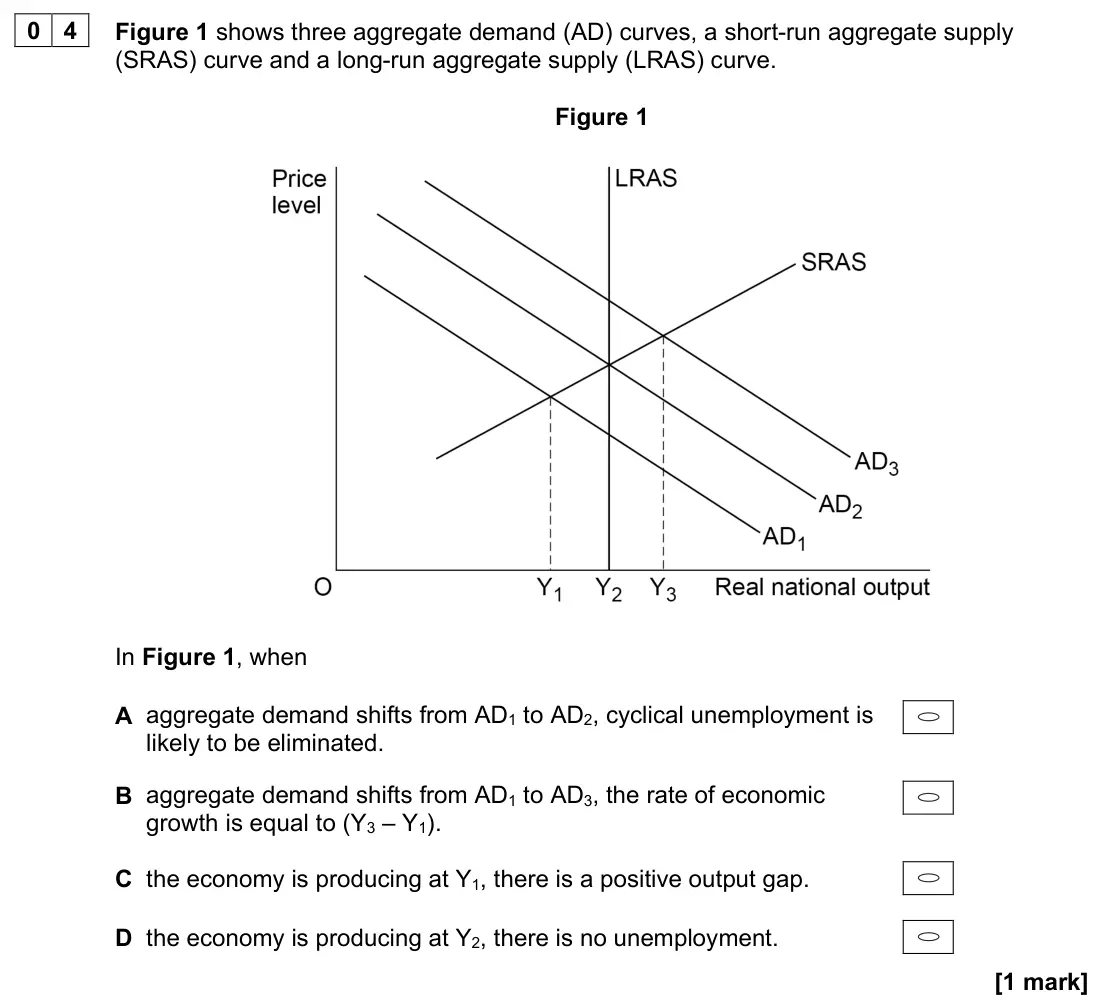
- November 2020, Paper 3, Q04 (1 mark): Figure 1 shows three aggregate demand (AD) curves, a short-run aggregate supply (SRAS) curve and a long-run aggregate supply (LRAS) curve. Figure 1 In Figure 1,
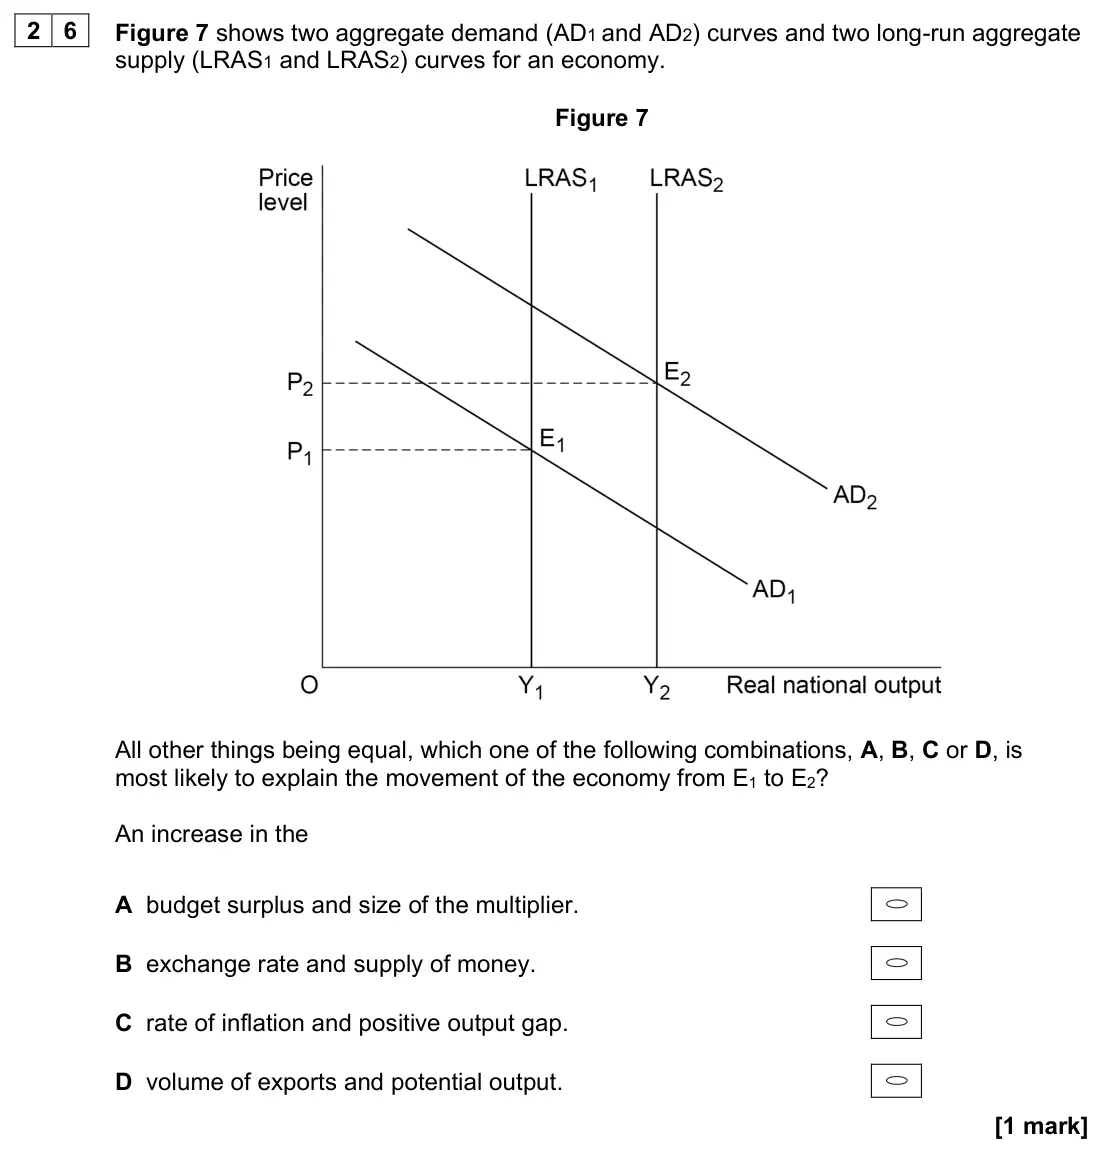
- November 2020, Paper 3, Q26 (1 mark): Figure 7 shows two aggregate demand (AD1 and AD2) curves and two long-run aggregate supply (LRAS1 and LRAS2) curves for an economy. Figure 7 All other things be
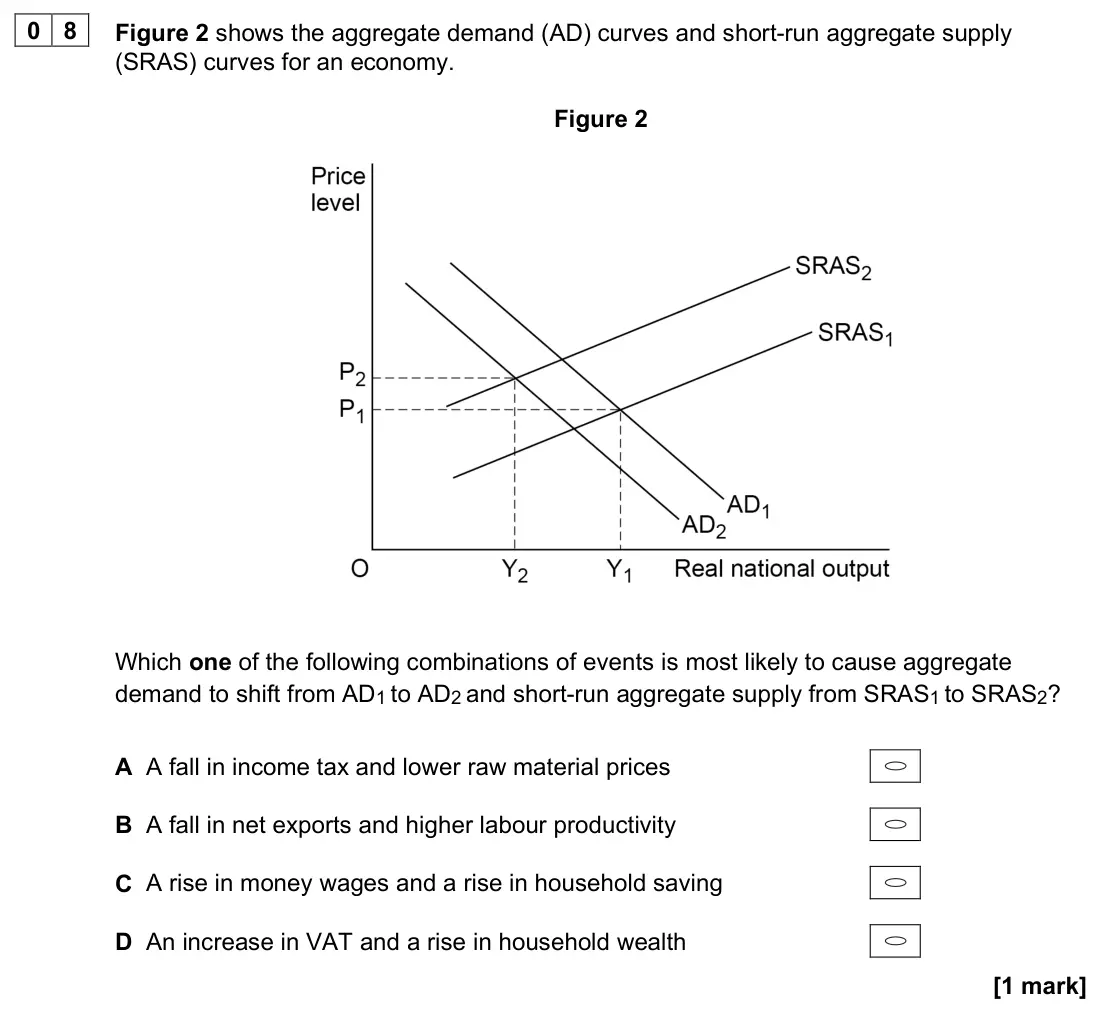
- November 2020, AS Paper 2, Q08 (1 mark): Figure 2 shows the aggregate demand (AD) curves and short-run aggregate supply (SRAS) curves for an economy. Figure 2 Which one of the following combinations of
Questions, mark schemes and examiner’s reports are © AQA, from their published past papers. Plumi isn’t affiliated with any exam board. Want whole papers? Full past papers.
Rather write your answers by hand on iPad? Plumi marks them against the same mark schemes.