 plumi
Sales forecasting: WJEC A‑Level Business questions
Every WJEC A-Level Business exam question on 3.3 Sales forecasting, 2016–2025, with its mark scheme and examiner’s report.
Find questions410
Exam
All years
Calculations
Q1(a)
The whole paper ↗
Q1(b)(i)
The whole paper ↗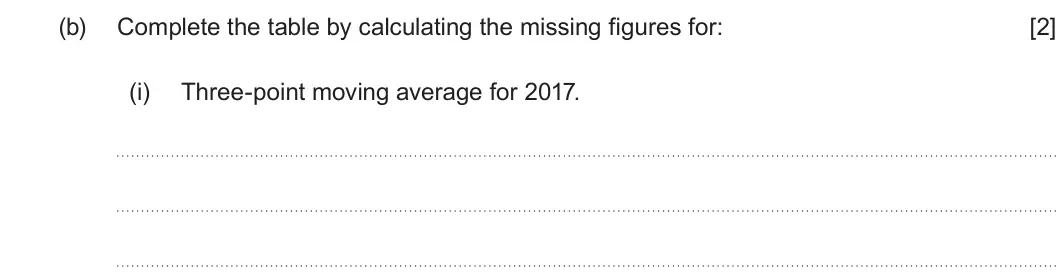
Q1(b)(ii)
The whole paper ↗
Q1(c)
The whole paper ↗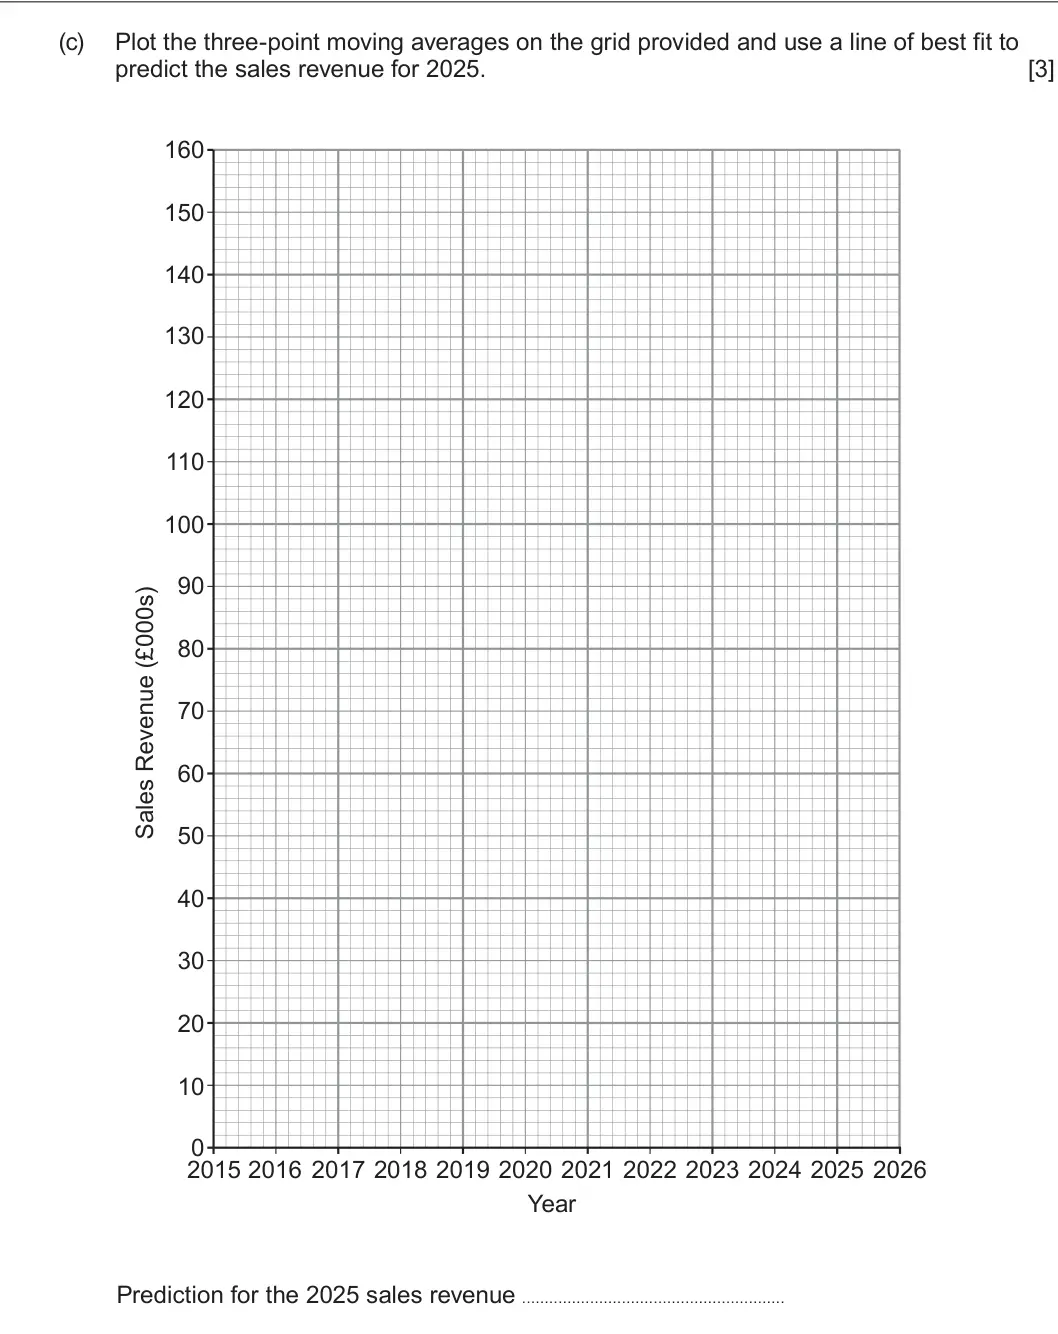
Q1(d)
The whole paper ↗
Q1(a)
The whole paper ↗
Q1(b)
The whole paper ↗
Q1(c)
The whole paper ↗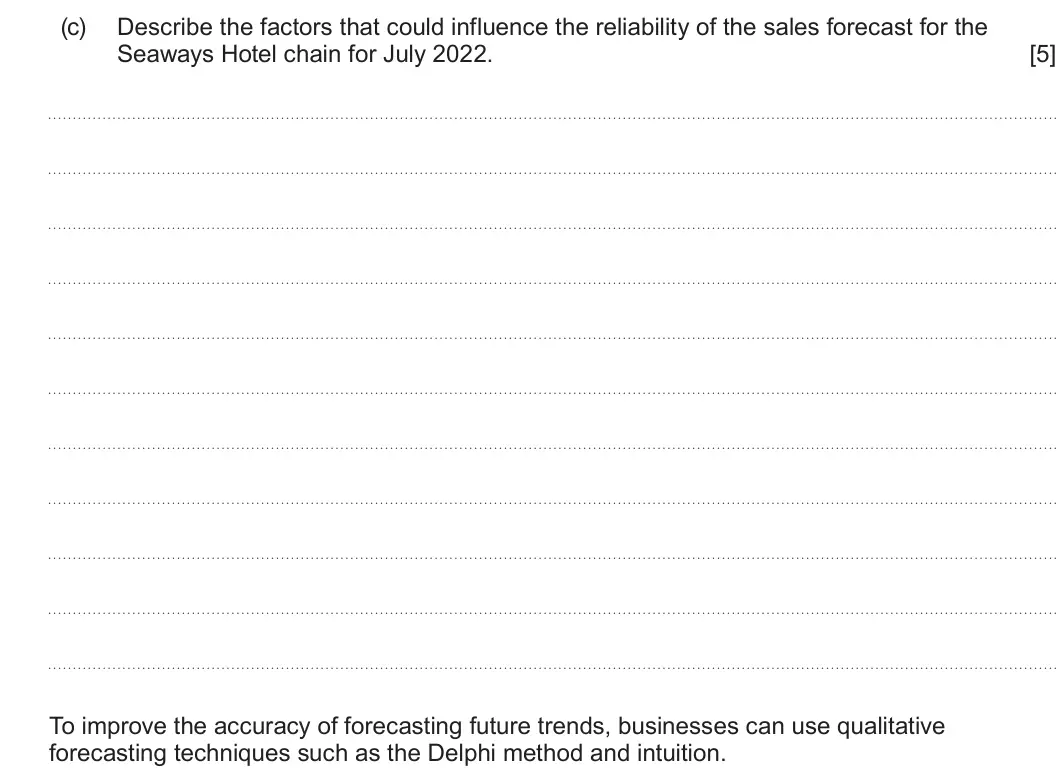
Q1(d)
The whole paper ↗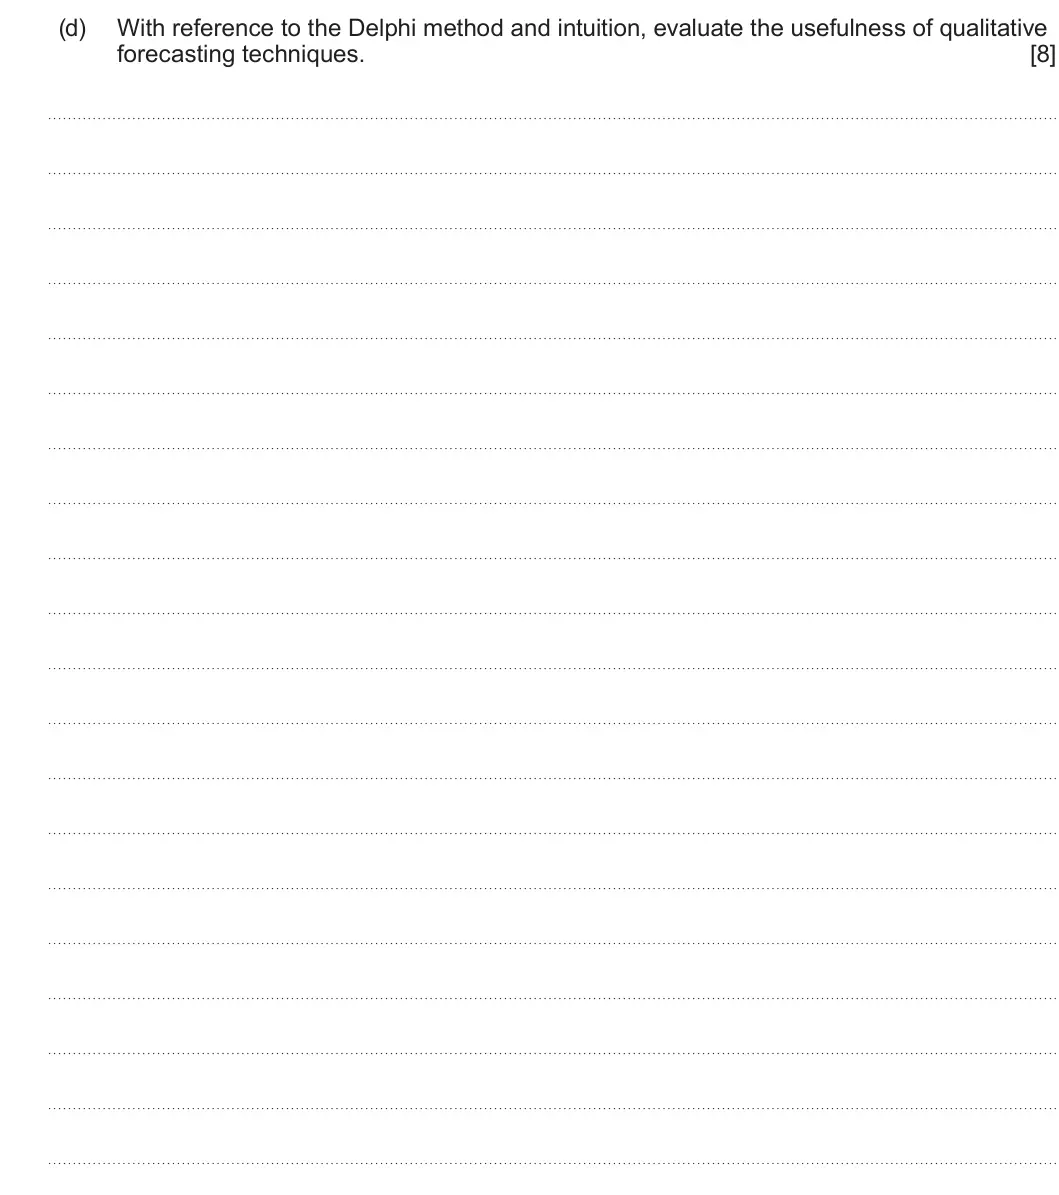
Q6(a)
The whole paper ↗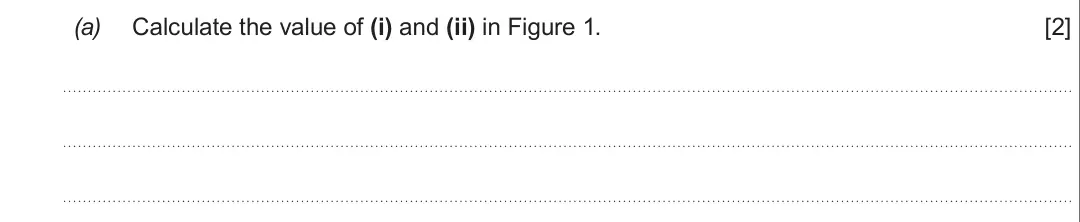
Q6(b)
The whole paper ↗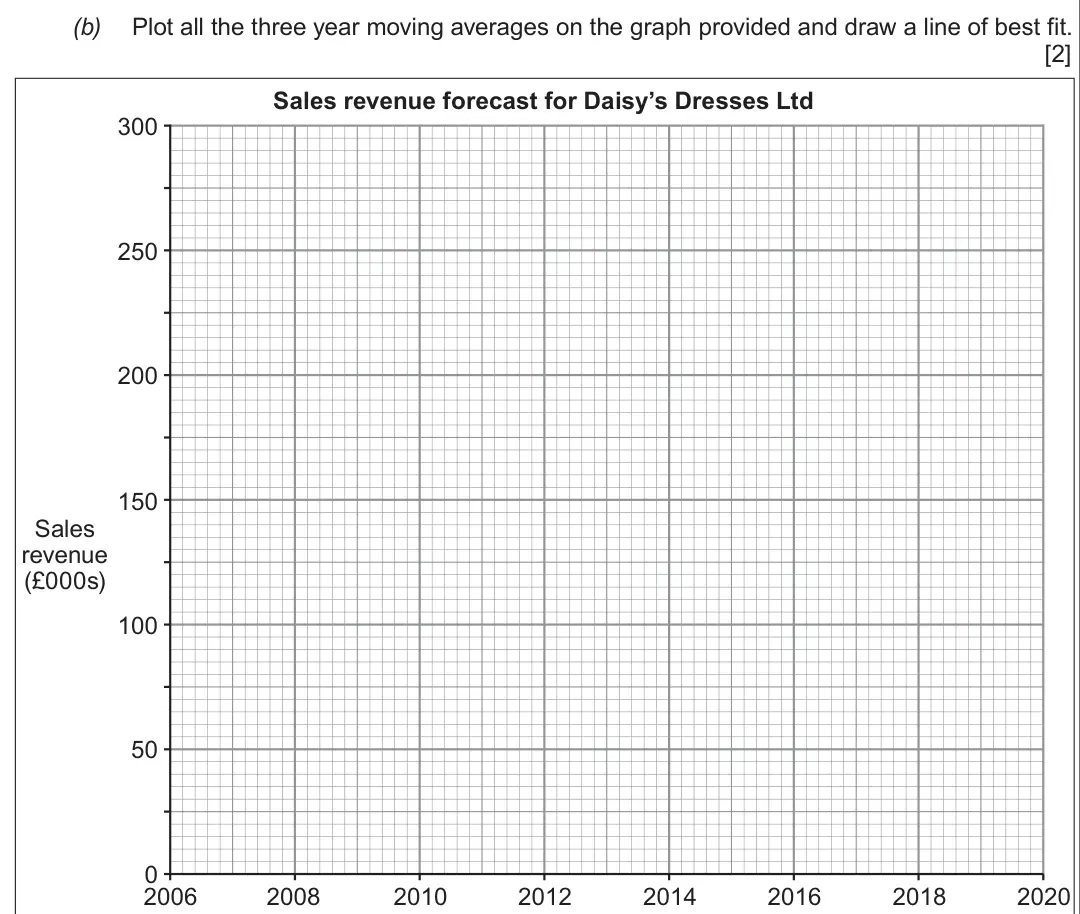
Q6(c)
The whole paper ↗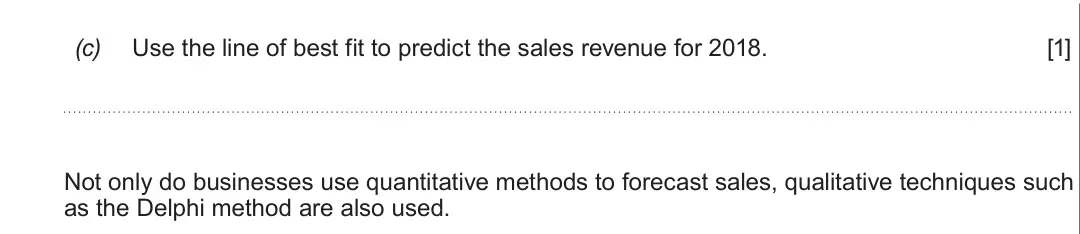
Q6(d)
The whole paper ↗
All 13 questions on Sales forecasting, as a list
- Summer 2025, Unit 3, Q1(a) (1 mark): State what is meant by sales forecasting. [1]
- Summer 2025, Unit 3, Q1(b)(i) (2 marks): Three-point moving average for 2017.
- Summer 2025, Unit 3, Q1(b)(ii): Sales revenue for 2021.
- Summer 2025, Unit 3, Q1(c) (3 marks): Plot the three-point moving averages on the grid provided and use a line of best fit to predict the sales revenue for 2025. [3] 160 150 140 130 120 110 100 90 8
- Summer 2025, Unit 3, Q1(d) (8 marks): With reference to the data, evaluate the usefulness of time series analysis to the owners of Bassini’s Ice Cream Parlour. [8] Additional space for Question 1(d)
- Summer 2022, Unit 3, Q1(a) (1 mark): Use extrapolation to state how many guests are expected to stay at the Seaways Hotel chain in July 2022. [1]
- Summer 2022, Unit 3, Q1(b) (6 marks): Explain how the data in the graph could be used to aid the future planning of the Seaways Hotel chain. [6]
- Summer 2022, Unit 3, Q1(c) (5 marks): Describe the factors that could influence the reliability of the sales forecast for the Seaways Hotel chain for July 2022. [5] To improve the accuracy of foreca
- Summer 2022, Unit 3, Q1(d) (8 marks): With reference to the Delphi method and intuition, evaluate the usefulness of qualitative forecasting techniques. [8]
- Summer 2017, Unit 3, Q6(a) (2 marks): Calculate the value of (i) and (ii) in Figure 1 [2]
- Summer 2017, Unit 3, Q6(b) (2 marks): Plot all the three year moving averages on the graph provided and draw a line of best fit. [2] Sales revenue forecast for Daisy’s Dresses Ltd 300 250 200 150 Sa
- Summer 2017, Unit 3, Q6(c) (1 mark): Use the line of best fit to predict the sales revenue for 2018. [1] Not only do businesses use quantitative methods to forecast sales, qualitative techniques su
- Summer 2017, Unit 3, Q6(d) (7 marks): Evaluate the usefulness of both quantitative and qualitative methods of forecasting to small manufacturing companies such as Daisy’s Dresses Ltd. [7]
Questions, mark schemes and examiner’s reports are © WJEC CBAC Ltd, from their published past papers. Plumi isn’t affiliated with any exam board. Want whole papers? Full past papers.
Rather write your answers by hand on iPad? Plumi marks them against the same mark schemes.