 plumi
Flows, game theory and dynamic programming: OCR MEI A‑Level Further Maths questions
Every OCR MEI A-Level Further Maths exam question on D.6 Flows, game theory and dynamic programming, 2018–2025, with its mark scheme and examiner’s report.
Find questions847





All 12 questions on Flows, game theory and dynamic programming, as a list
- June 2025, AS Modelling with Algorithms, Q5 (12 marks): The diagram represents a system of pipes through which water flows continuously from a source S to a sink T. The weights on the arcs show the capacities of the
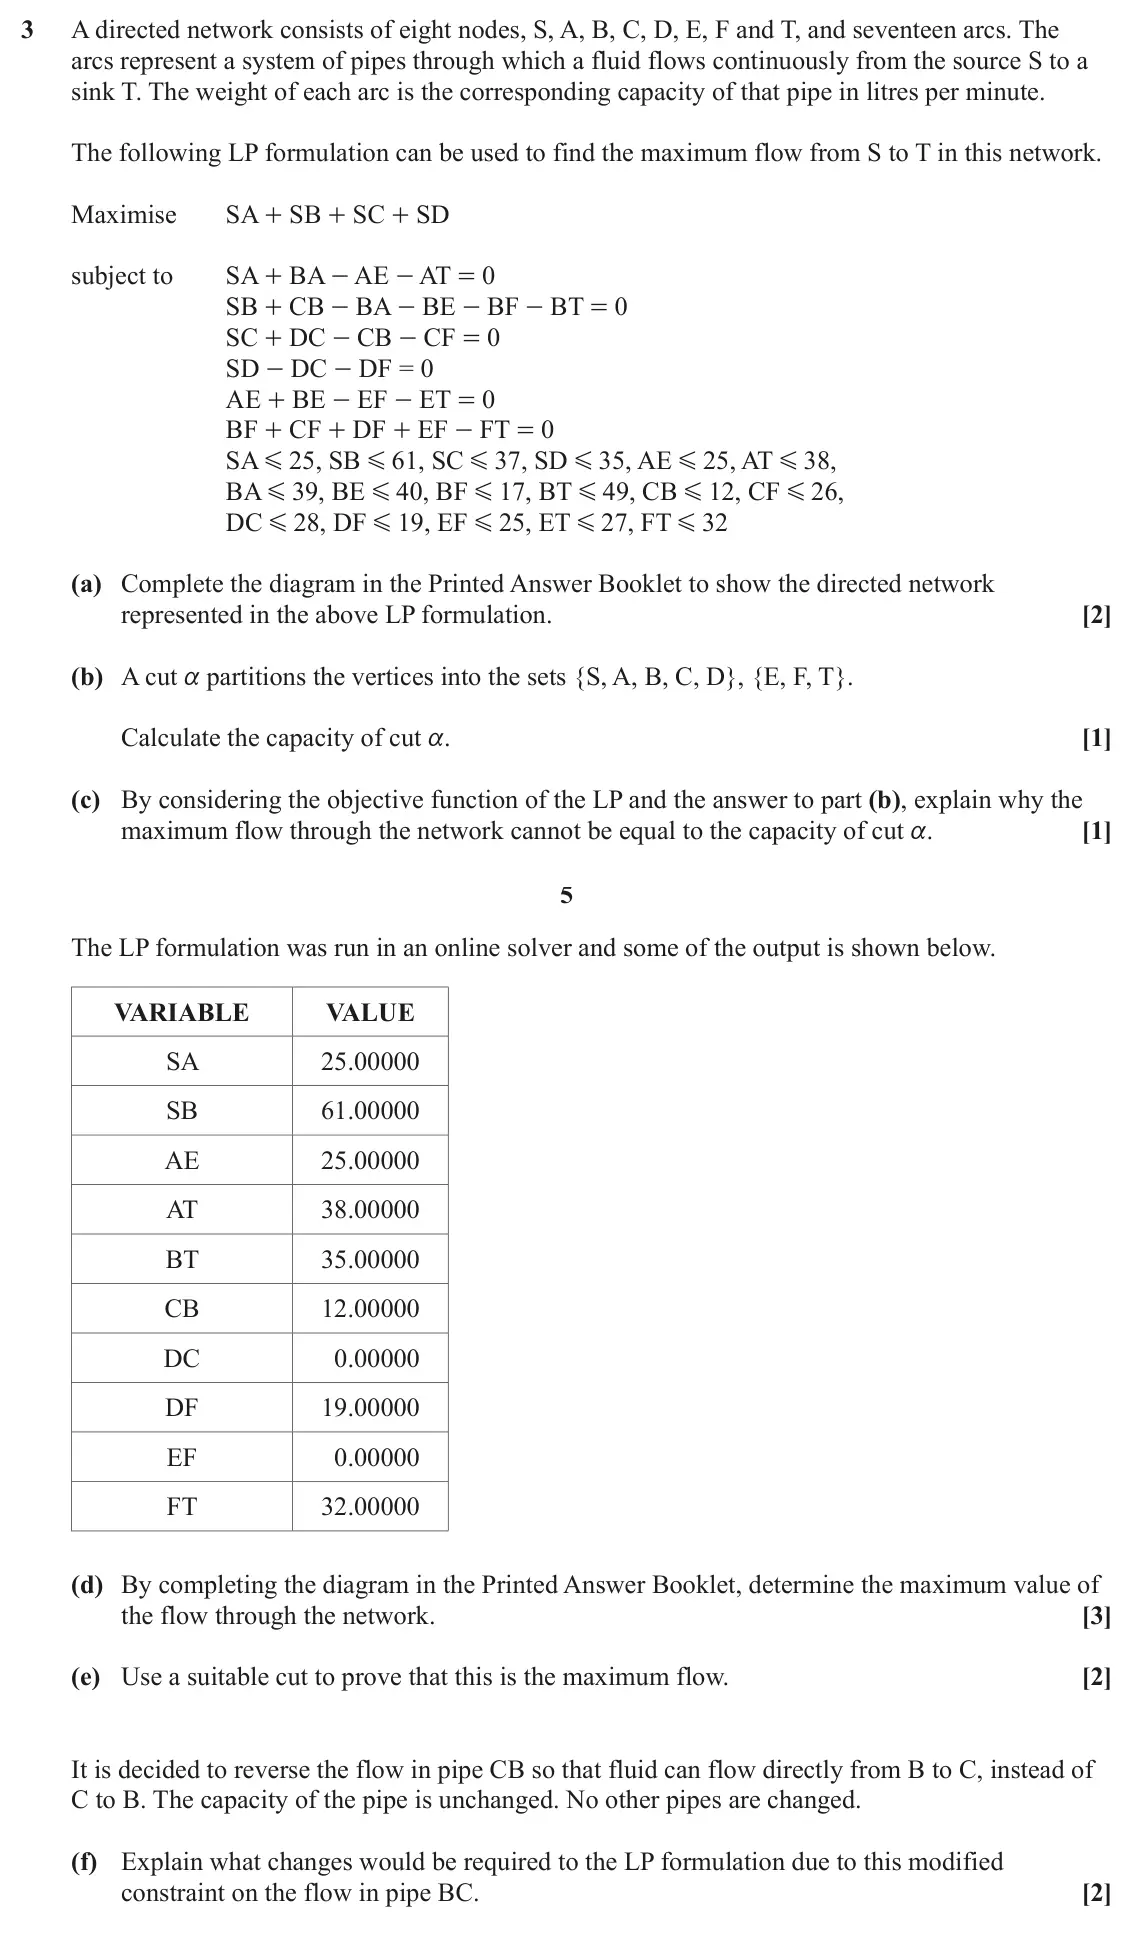
- June 2024, Modelling with Algorithms, Q3 (11 marks): A directed network consists of eight nodes, S, A, B, C, D, E, F and T, and seventeen arcs. The arcs represent a system of pipes through which a fluid flows cont
- June 2023, Modelling with Algorithms, Q5 (10 marks): H 12 31 9 D 28 A G 10 5 42 T 6 S 10 3 E 12 29 25 5 F 8 19 7 B C I 20 13 The diagram represents a system of pipes through which a fluid flows continuously from a
- June 2023, AS Modelling with Algorithms, Q1 (6 marks): Fig. 1.1 I a 10 E 2 1 C 11 6 2 H 17 5 2 8 G 4 J 13 A 12 5 10 10 10 K B D 6 7 F a The diagram in Fig. 1.1 represents a system of pipes through which a fluid can
- June 2022, Modelling with Algorithms, Q1 (7 marks): A 15 F H 3 D 24 20 34 I 17 B 8 15 25 14 25 10 E 24 J 12 C 39 G 29 K Fig. 1.1 The diagram in Fig. 1.1 represents a system of pipes through which a fluid can flow
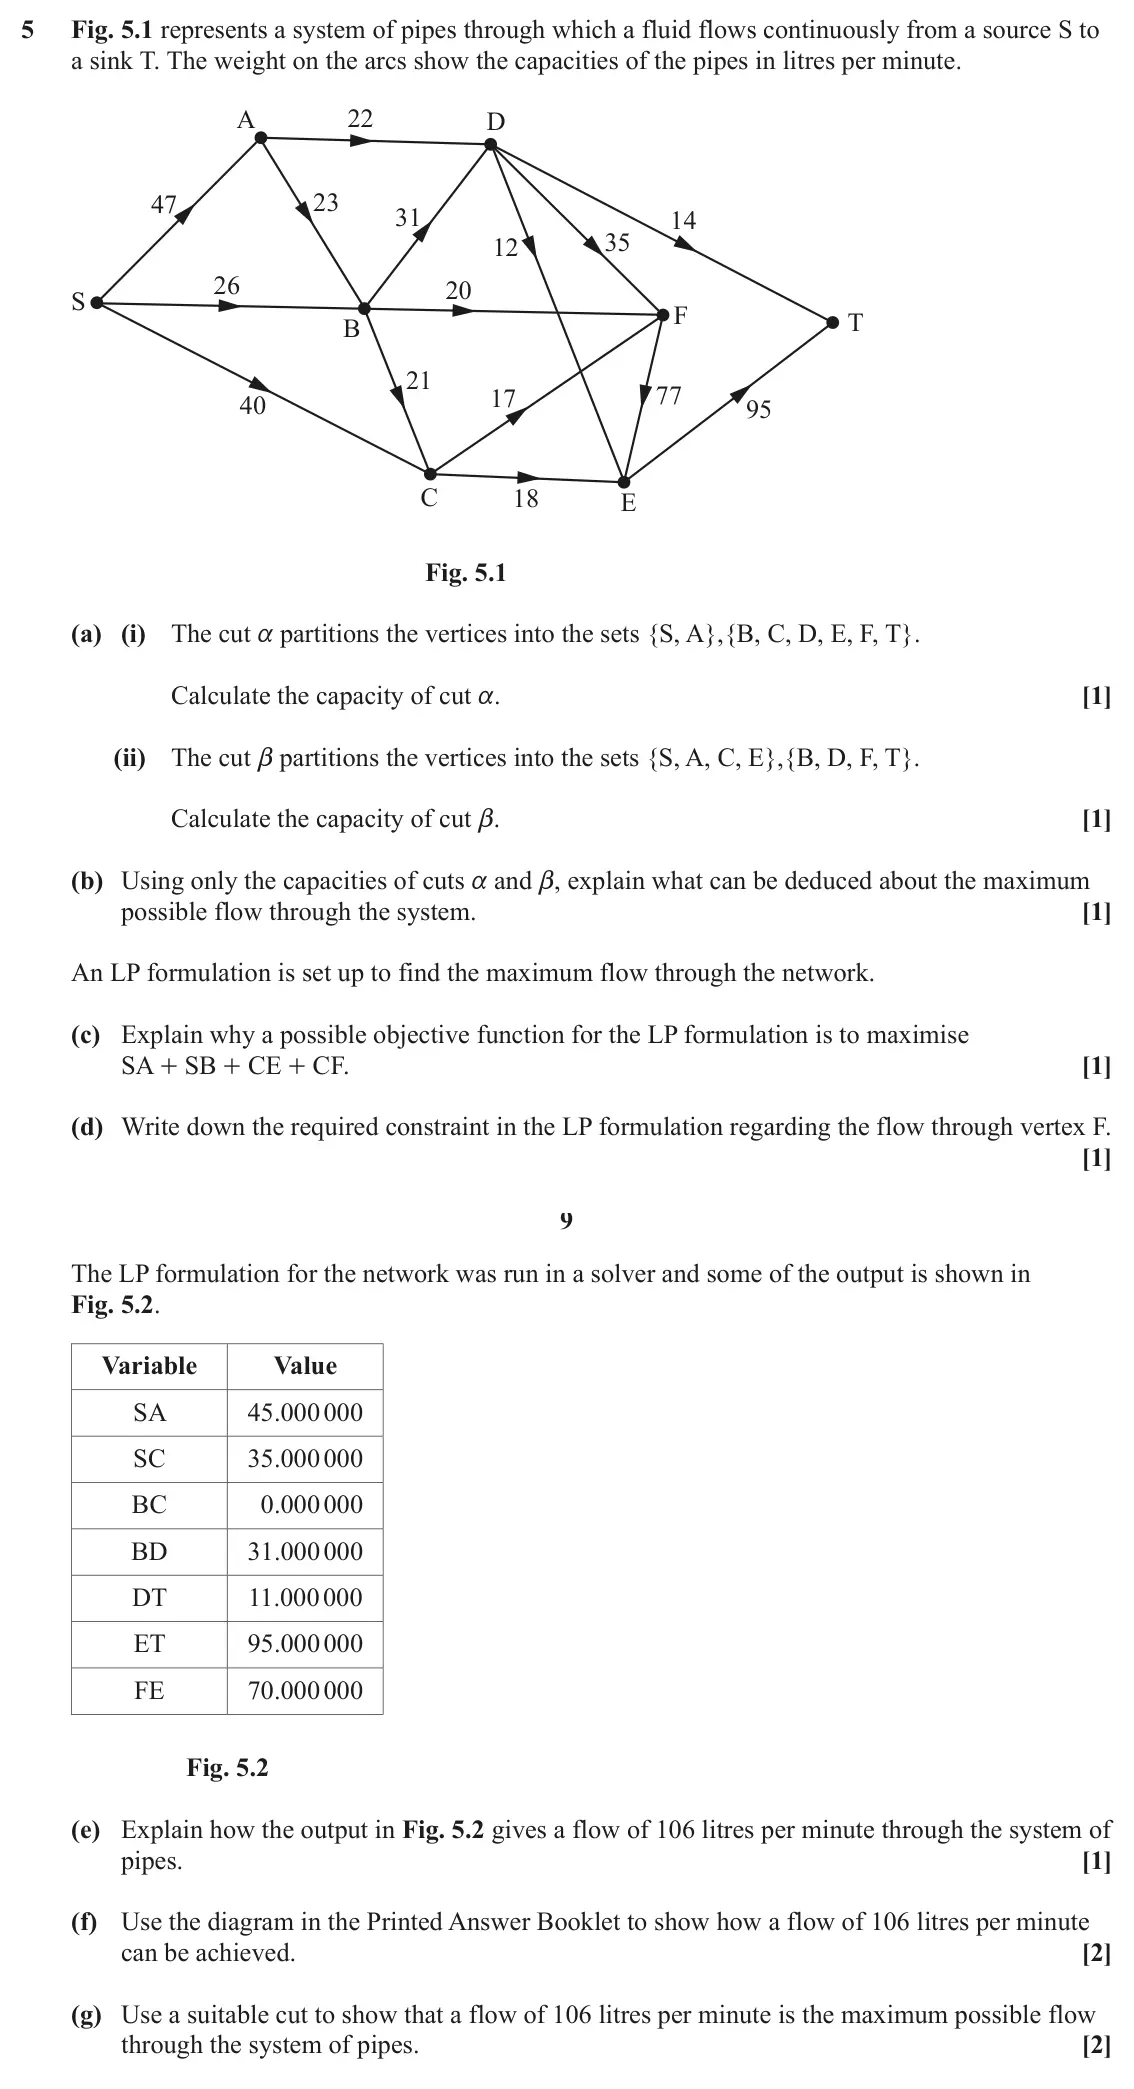
- June 2022, AS Modelling with Algorithms, Q5 (10 marks): Fig. 5.1 represents a system of pipes through which a fluid flows continuously from a source S to a sink T. The weight on the arcs show the capacities of the pi
- November 2021, Modelling with Algorithms, Q4 (13 marks): Fig. 4.1 represents a system of pipes through which fluid can flow from a source, S, to a sink, T. It also shows two cuts, a and b. The arc weights show capacit
- November 2020, Modelling with Algorithms, Q3 (11 marks): a C G 80 45 60 A K 30 55 45 D H 50 45 25 55 25 L 35 20 65 I E 45 B 30 20 30 15 55 M 70 F J 75 a Fig. 3 The diagram in Fig. 3 represents a system of pipes throug
- November 2020, AS Modelling with Algorithms, Q5 (10 marks): Fig. 5 represents a system of pipes through which water flows continuously from a source S to a sink T. The weights on the arcs show the capacities of the pipes
- June 2019, Modelling with Algorithms, Q3 (10 marks): Fig. 3 represents a system of pipes through which fluid flows continuously from a source node, S, to a sink node, T. The weight on each arc shows the capacity o
- June 2019, AS Modelling with Algorithms, Q4 (13 marks): A D 17 G 22 53 24 15 E B 40 H 18 20 25 C I 30 F 27 Fig. 4.1 Fig. 4.1 shows a network representing a system of pipes. Fluid flows continuously from three sources
- June 2018, AS Modelling with Algorithms, Q2 (6 marks): Fig. 2 represents a system of one-way roads through which traffic flows from a source, S, to a sink, T. The weights on the arcs show the capacities of the roads
Questions, mark schemes and examiner’s reports are © OCR, from their published past papers. Plumi isn’t affiliated with any exam board. Want whole papers? Every OCR MEI A-Level Further Maths paper.
Rather write your answers by hand on iPad? Plumi marks them against the same mark schemes.