 plumi
Critical path analysis: OCR MEI A‑Level Further Maths questions
Every OCR MEI A-Level Further Maths exam question on D.3 Critical path analysis, 2018–2025, with its mark scheme and examiner’s report.
Find questions847




All 15 questions on Critical path analysis, as a list
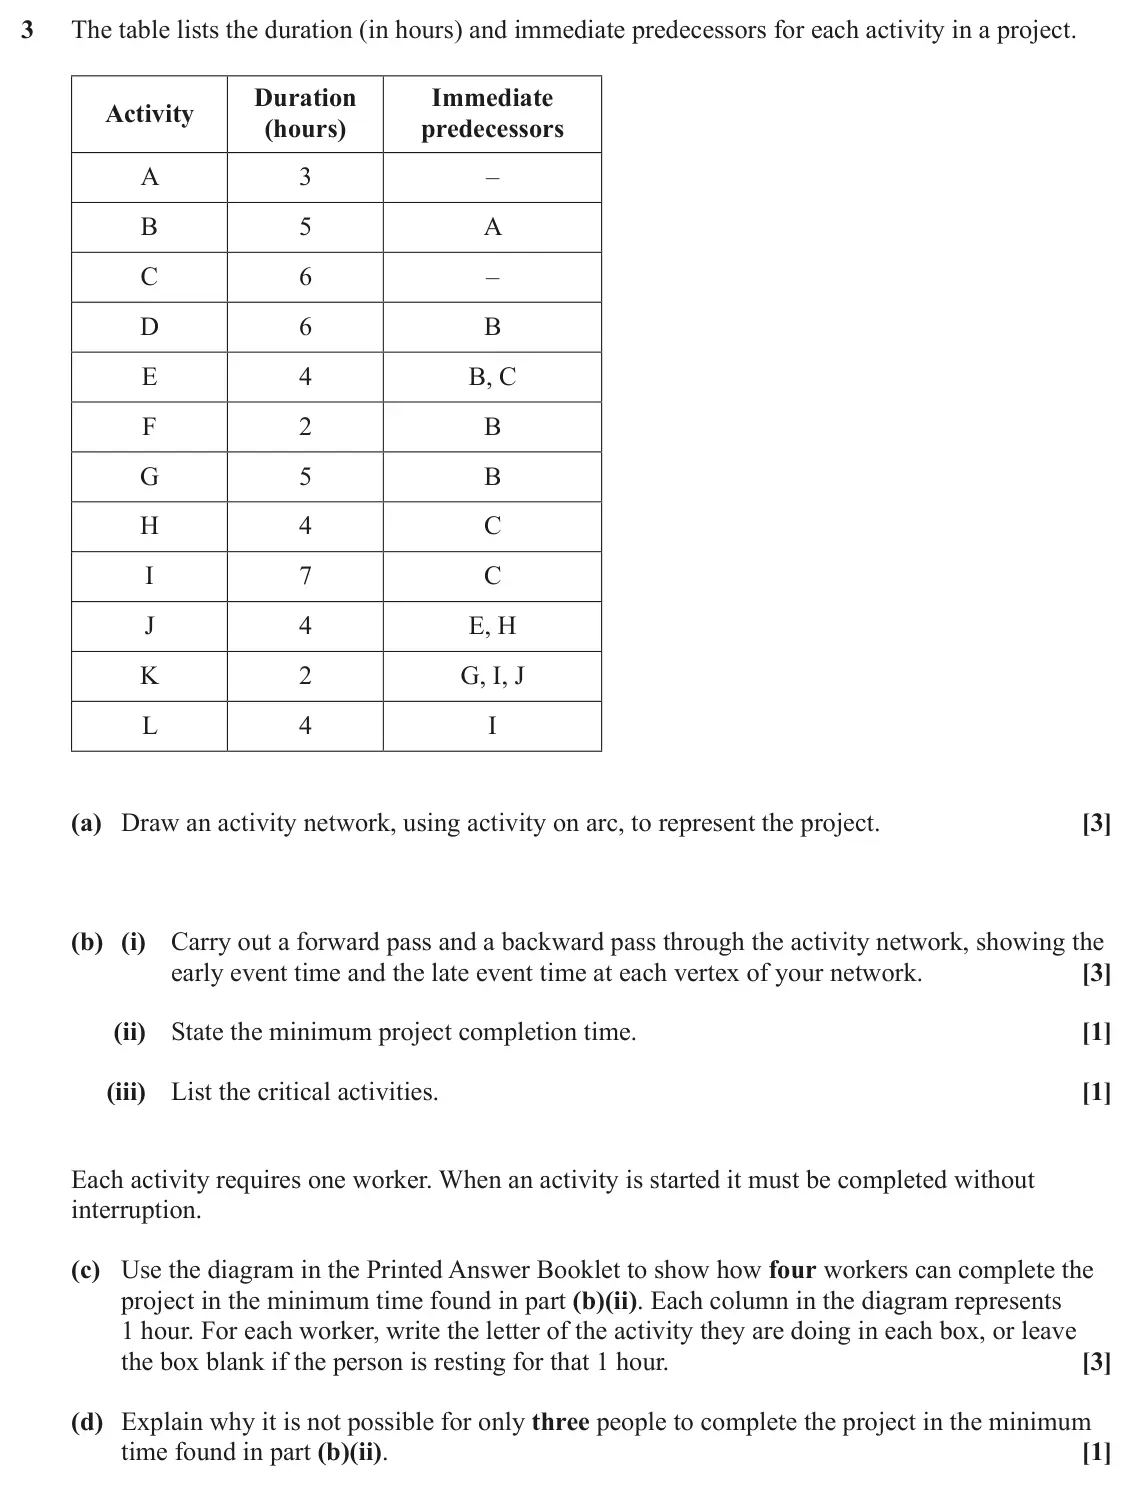
- June 2025, Modelling with Algorithms, Q3 (12 marks): The table lists the duration (in hours) and immediate predecessors for each activity in a project. Duration Immediate Activity (hours) predecessors A 3 – B 5 A
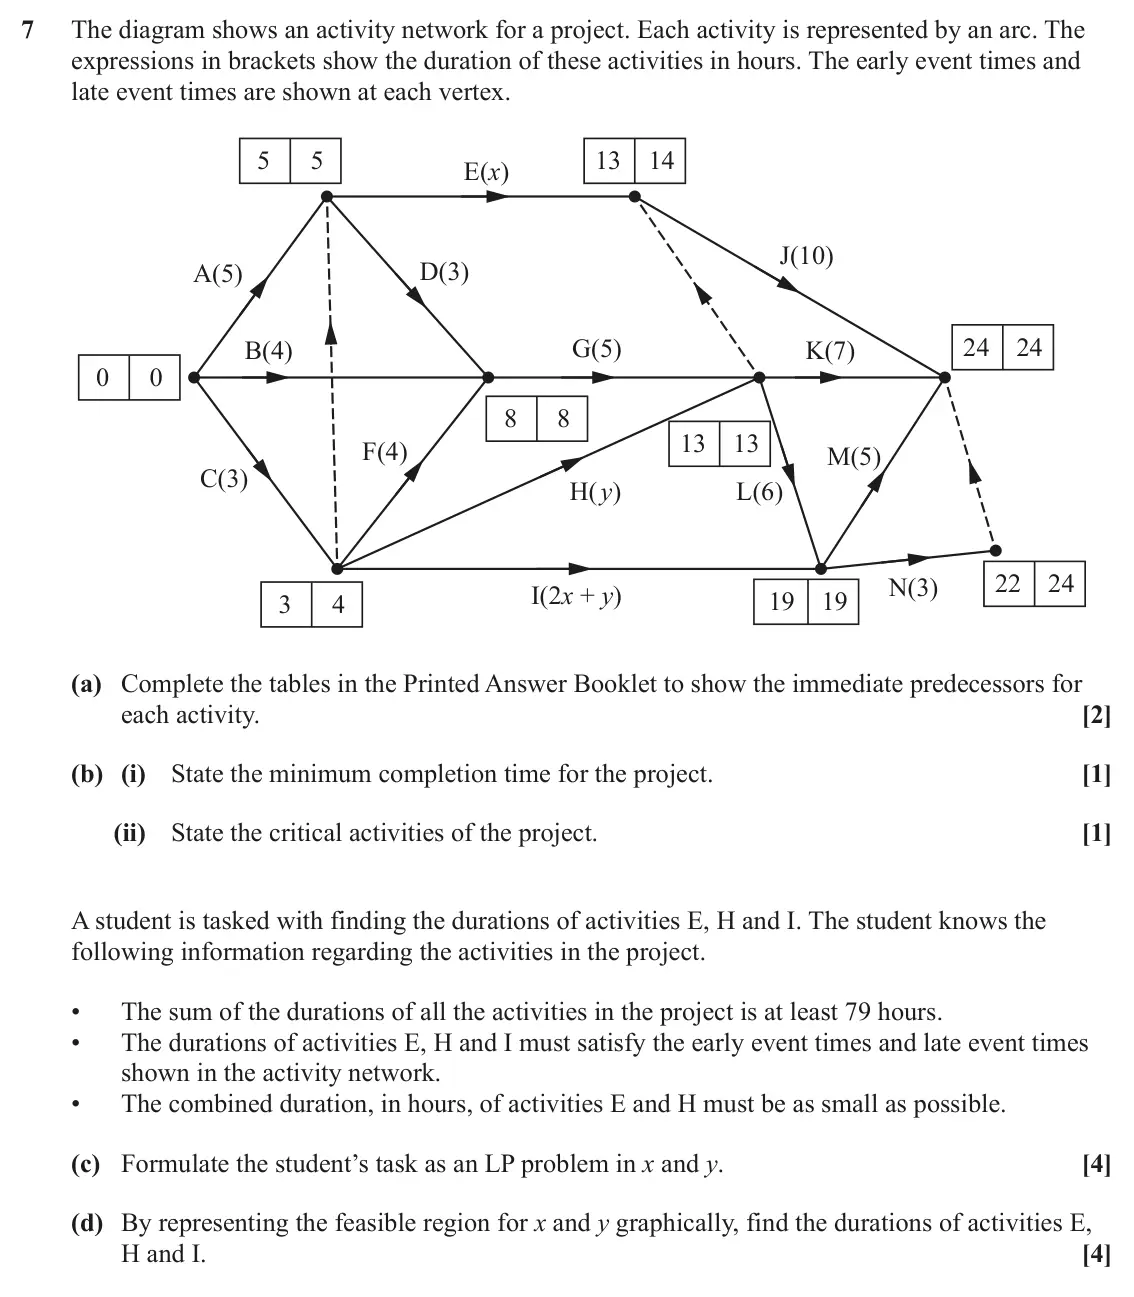
- June 2025, AS Modelling with Algorithms, Q7 (12 marks): The diagram shows an activity network for a project. Each activity is represented by an arc. The expressions in brackets show the duration of these activities i
- June 2024, Modelling with Algorithms, Q5 (11 marks): The table in Fig. 5.1 lists the immediate predecessors for each of the eleven activities in a project. Fig. 5.1 Activity Immediate predecessors A - B - C - D A
- June 2024, AS Modelling with Algorithms, Q3 (10 marks): The diagram shows an activity network for a project. The number in brackets show the duration of these activities in hours. F(7) A (4) G(4) J (4) D (2) B(3) K(3
- June 2023, Modelling with Algorithms, Q2 (10 marks): The diagram shows an activity network for a project. The arc weights show activity durations in hours. The numbers in circles are event numbers. E(10) K(11) 2 5
- June 2023, AS Modelling with Algorithms, Q4 (12 marks): Fig. 4.1 shows an activity network for a project. The arc weights show activity durations in days. Fig. 4.1 D(8) E(4) I(6) A(4) K(8) B(7) F(7) J(11) G(3) C(5) L
- June 2022, Modelling with Algorithms, Q3 (6 marks): Activity Independent Float A 0 5 12 7 14 D B 7 C 0 J A I D 0 14 14 B E 0 0 0 20 20 G F 2 E G 2 H K C H 0 F 10 10 17 17 I 0 J 1 K 0 Fig. 3.1 Fig. 3.2 Fig. 3.1 sh
- June 2022, AS Modelling with Algorithms, Q4 (13 marks): Fig. 4.1 shows an activity network for a project. The arc weights show activity duration in hours. J(y) D(2) K(7) A(5) E(4) B(x) I(2) F(8) C(3) L(5) G(1) H(7) F
- November 2021, Modelling with Algorithms, Q2 (11 marks): The table below shows the activities involved in a project, together with their immediate predecessors. The table also gives the duration (in hours) of each act
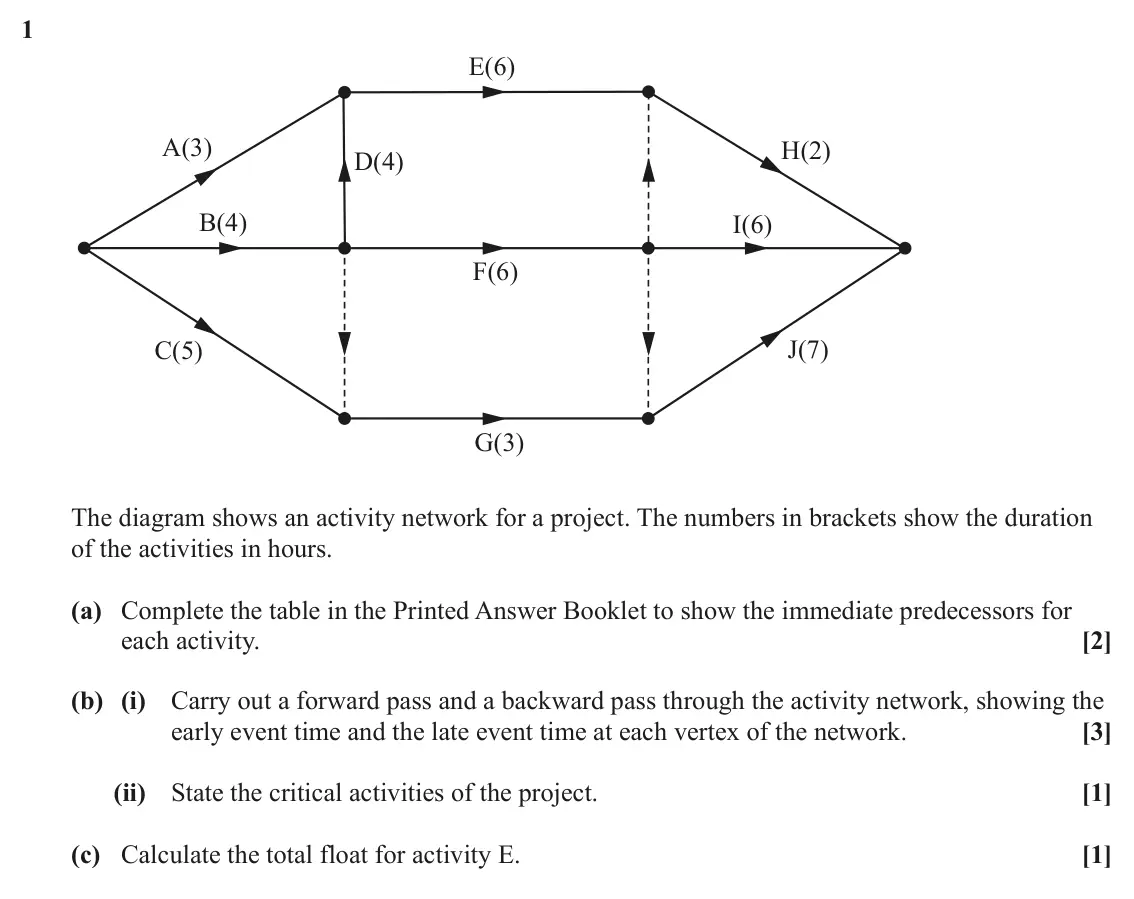
- November 2021, AS Modelling with Algorithms, Q1 (7 marks): E(6) A(3) H(2) D(4) B(4) I(6) F(6) J(7) C(5) G(3) The diagram shows an activity network for a project. The numbers in brackets show the duration of the activiti
- November 2020, Modelling with Algorithms, Q4 (13 marks): The following LP formulation can be used to find the minimum completion time, T, for the 11 activities A, B, …, K in a project. The durations of the activities
- November 2020, AS Modelling with Algorithms, Q1 (4 marks): The table in Fig. 1 lists the immediate predecessors required for each activity in a project. Activity Immediate predecessors A – B – C A D A, B E A, B F C, D G
- June 2019, Modelling with Algorithms, Q2 (13 marks): The table in Fig. 2.1 lists the duration (in minutes) and immediate predecessors for each activity in a project. Activity Duration Immediate (minutes) predecess
- June 2019, AS Modelling with Algorithms, Q2 (12 marks): The network in Fig. 2.1 represents a project using activity on arc. The durations of the activities are not yet shown. E A B F I K G D C L H J Fig. 2.1 (a) Comp
- June 2018, AS Modelling with Algorithms, Q5 (9 marks): Fig. 5 shows an activity network for a project. Each activity is represented by an arc. The early event times and late event times are shown at each vertex. 5 9
Questions, mark schemes and examiner’s reports are © OCR, from their published past papers. Plumi isn’t affiliated with any exam board. Want whole papers? Every OCR MEI A-Level Further Maths paper.
Rather write your answers by hand on iPad? Plumi marks them against the same mark schemes.